. 2015 Mar:108:1-16.
doi: 10.1016/j.neuroimage.2014.11.045. Epub 2014 Dec 12.

Finding imaging patterns of structural covariance via Non-Negative Matrix Factorization

Affiliations

Finding imaging patterns of structural covariance via Non-Negative Matrix Factorization

Aristeidis Sotiras et al. Neuroimage. 2015 Mar.

Abstract

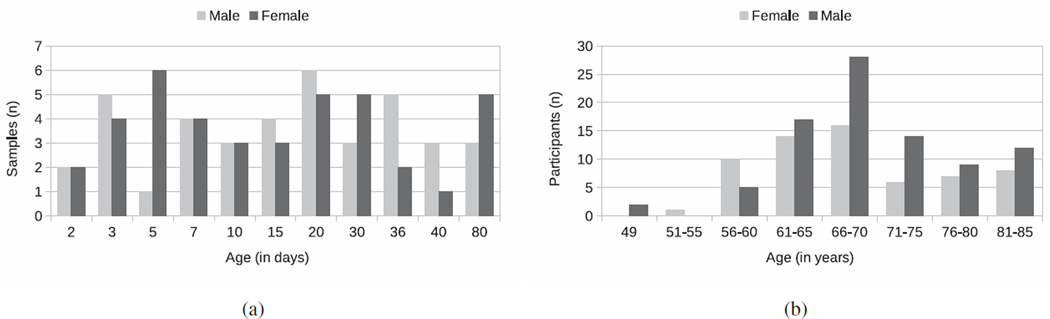
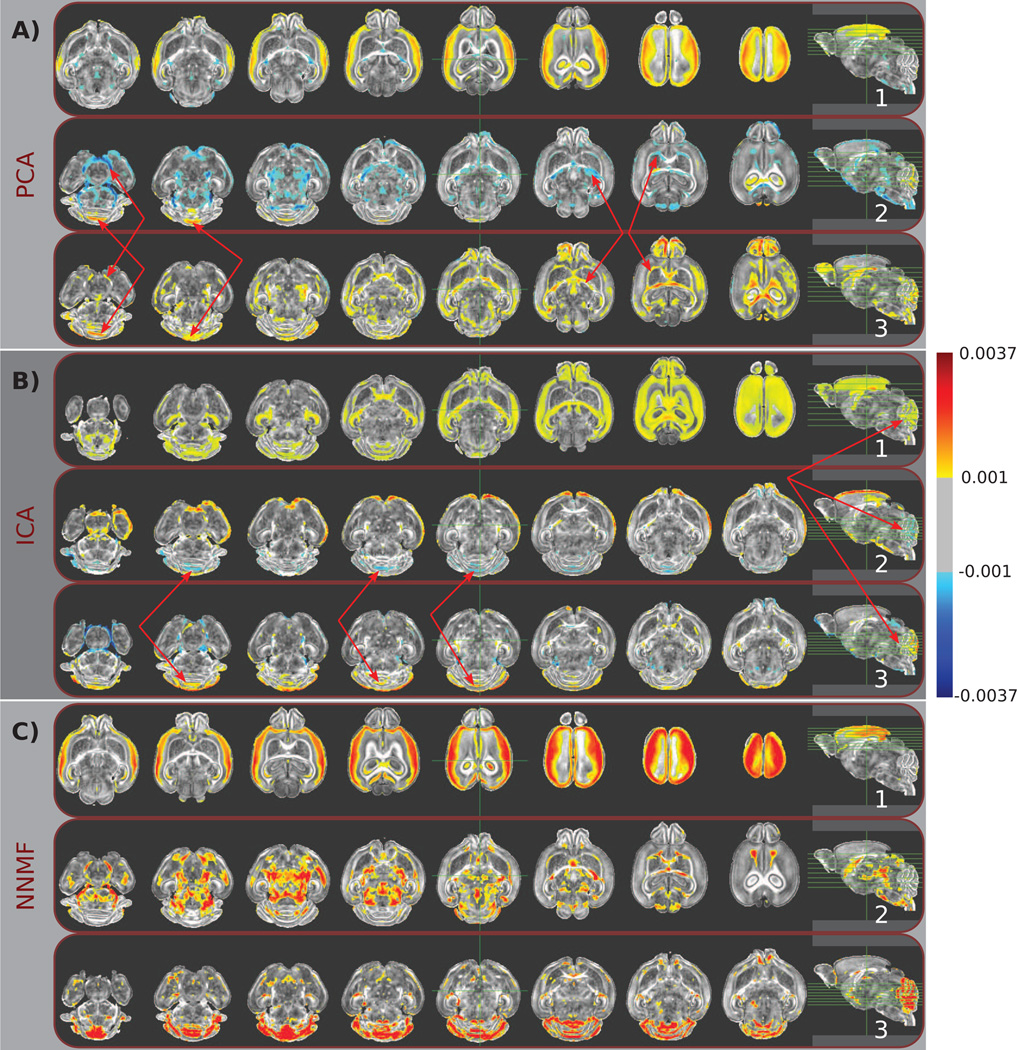
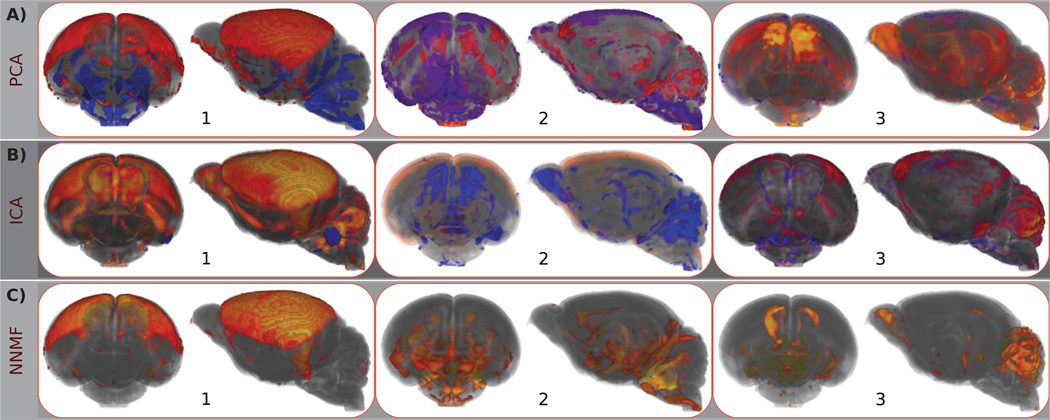
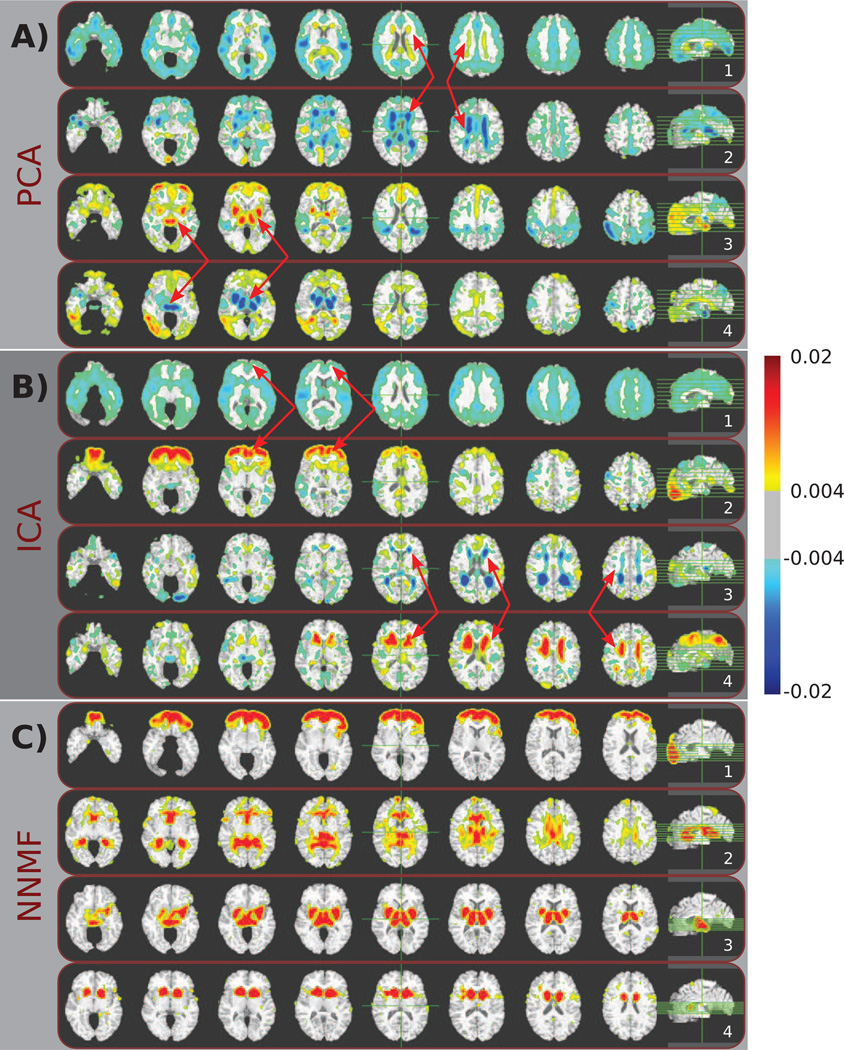
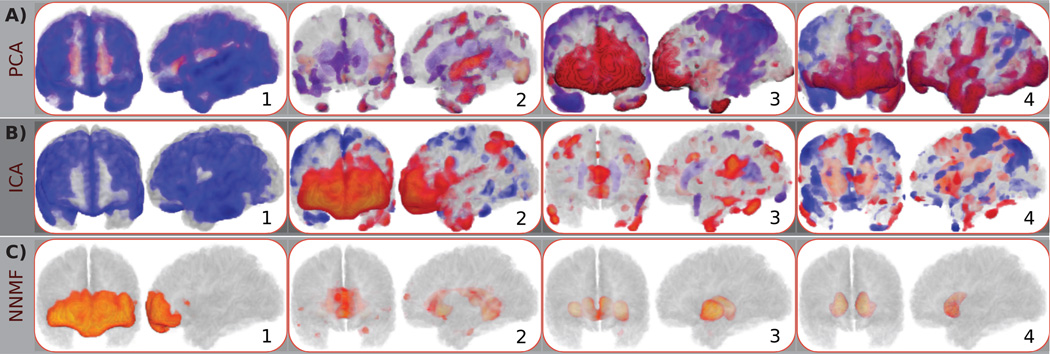
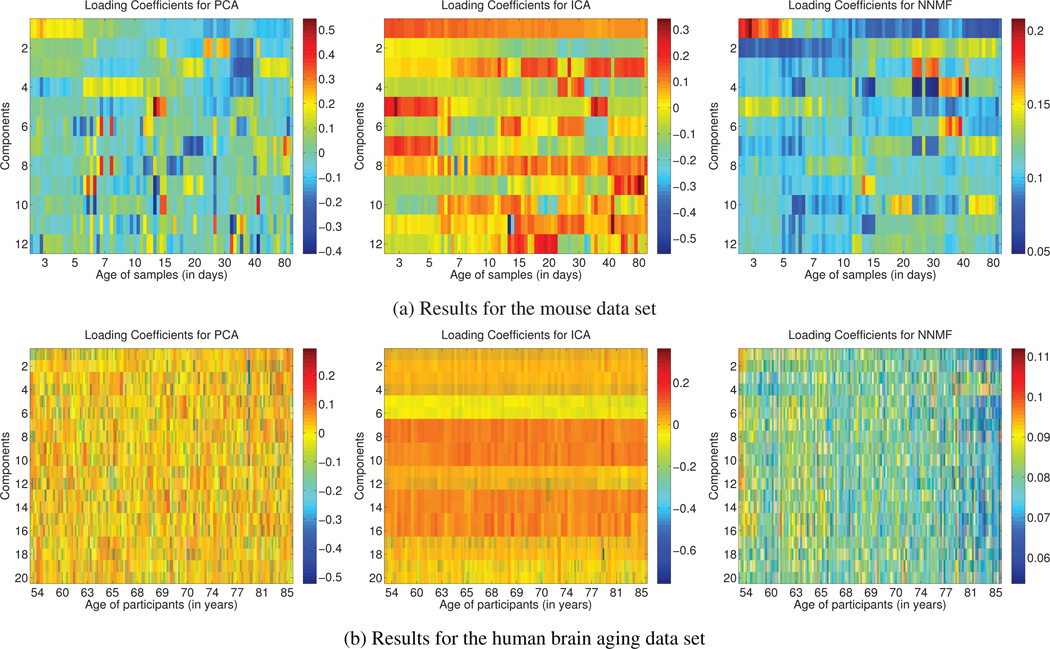
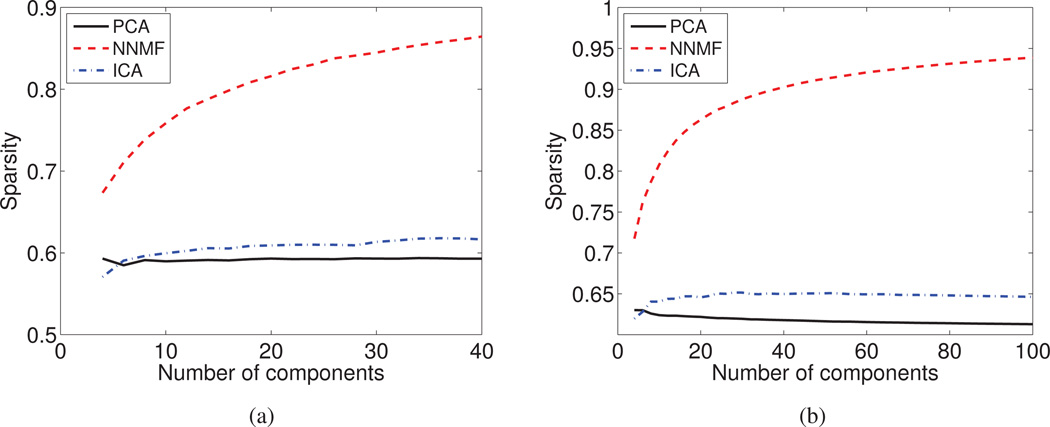
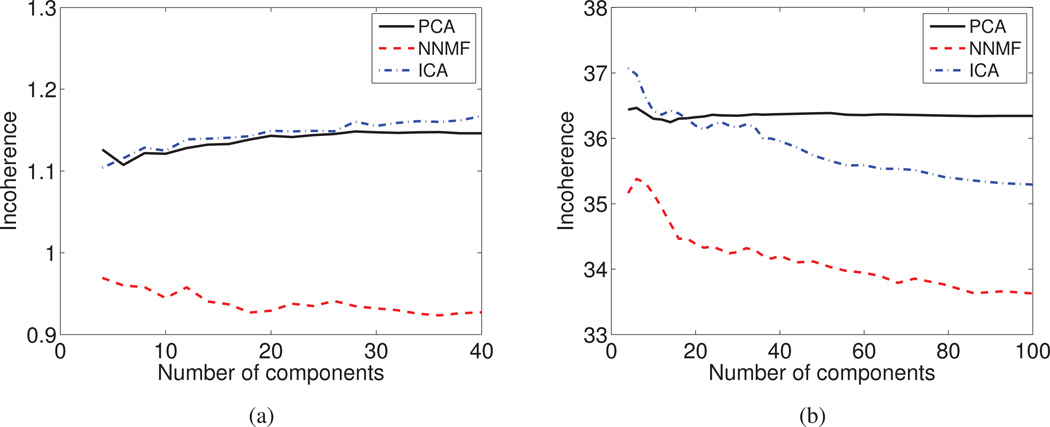
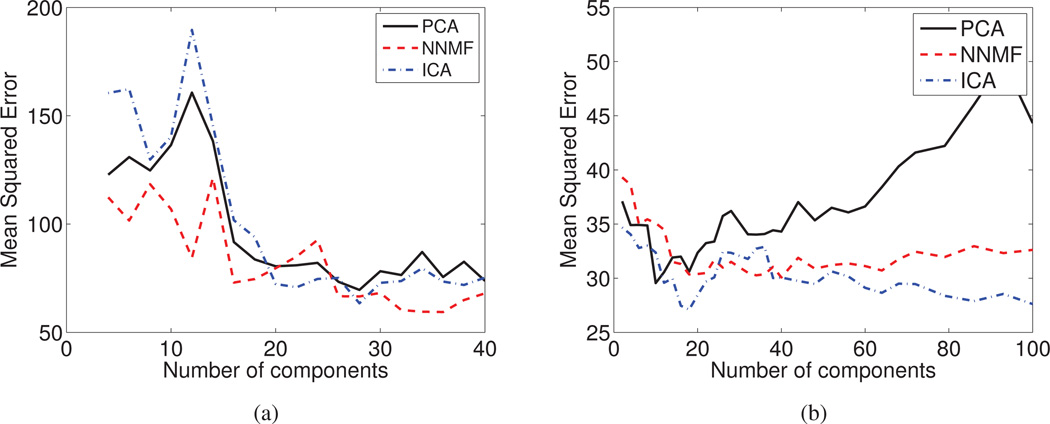
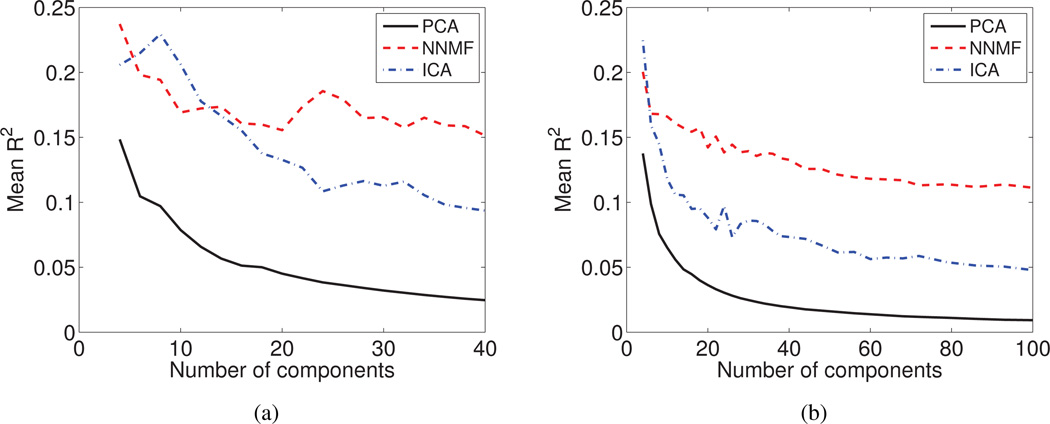
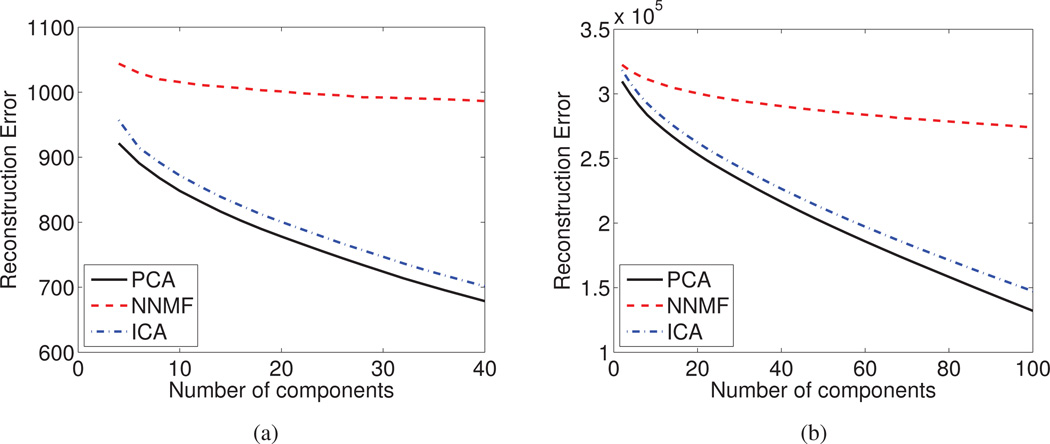
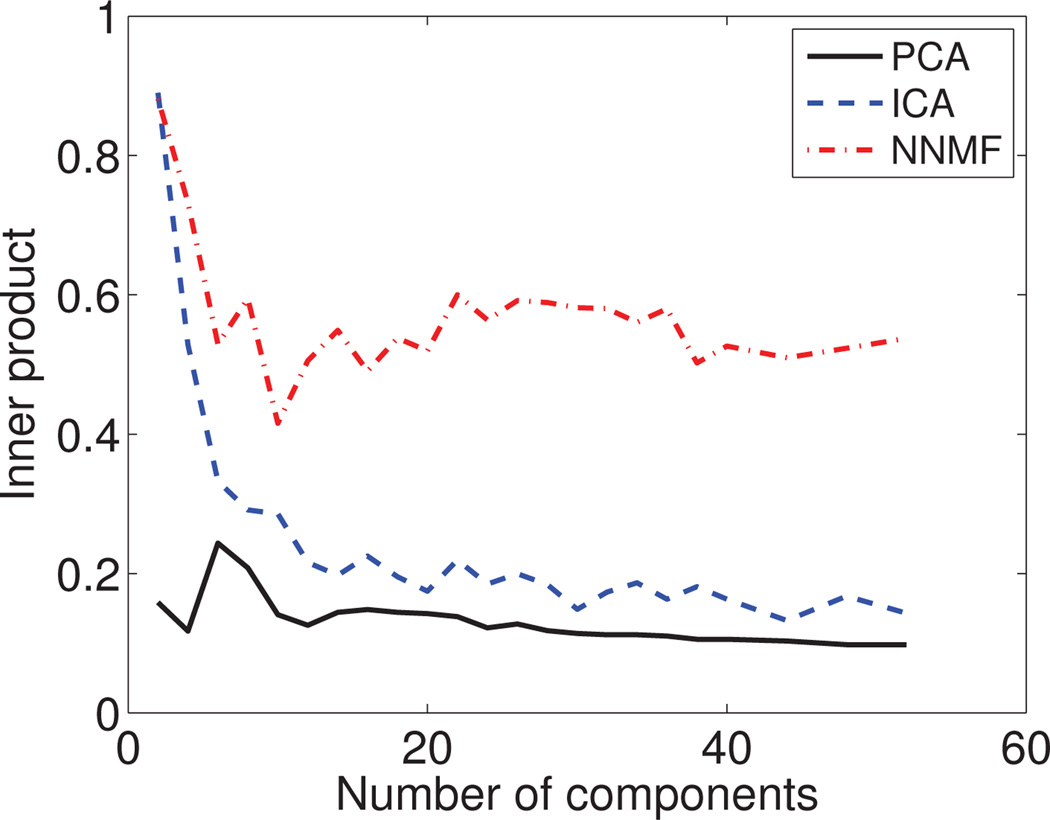
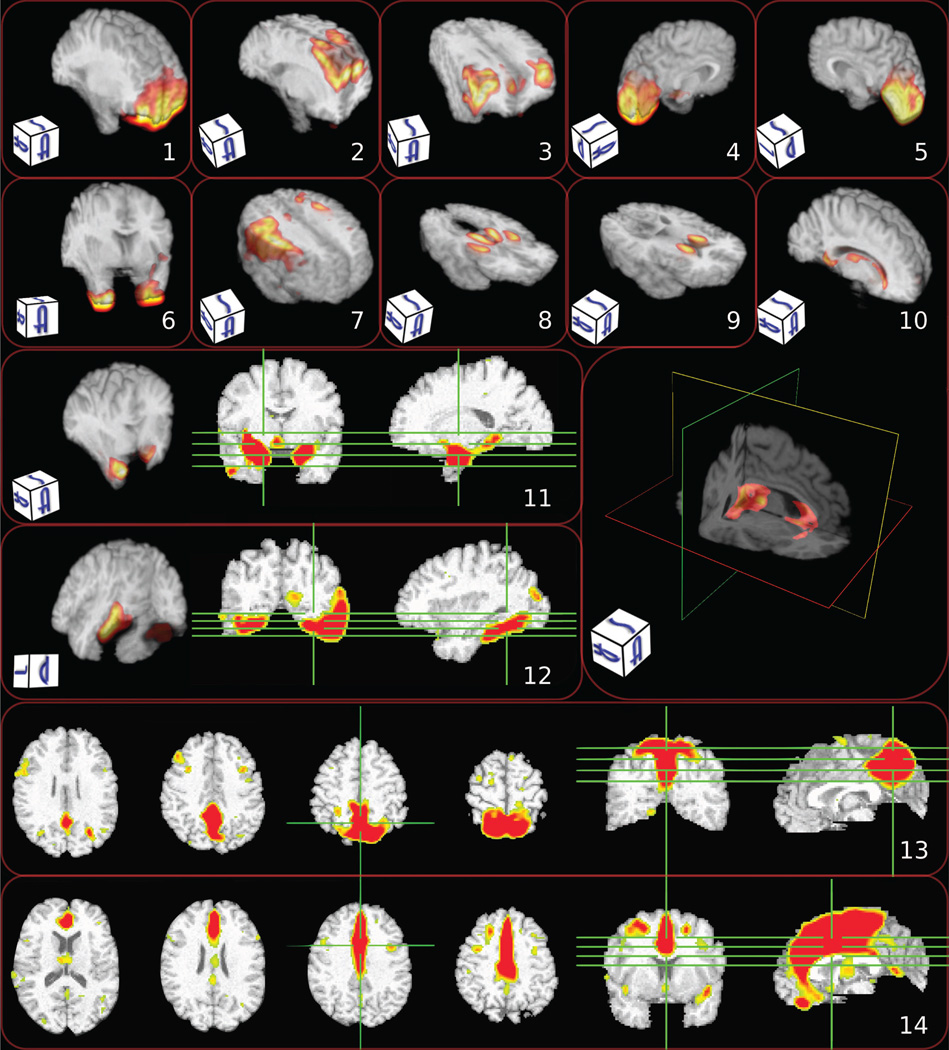
In this paper, we investigate the use of Non-Negative Matrix Factorization (NNMF) for the analysis of structural neuroimaging data. The goal is to identify the brain regions that co-vary across individuals in a consistent way, hence potentially being part of underlying brain networks or otherwise influenced by underlying common mechanisms such as genetics and pathologies. NNMF offers a directly data-driven way of extracting relatively localized co-varying structural regions, thereby transcending limitations of Principal Component Analysis (PCA), Independent Component Analysis (ICA) and other related methods that tend to produce dispersed components of positive and negative loadings. In particular, leveraging upon the well known ability of NNMF to produce parts-based representations of image data, we derive decompositions that partition the brain into regions that vary in consistent ways across individuals. Importantly, these decompositions achieve dimensionality reduction via highly interpretable ways and generalize well to new data as shown via split-sample experiments. We empirically validate NNMF in two data sets: i) a Diffusion Tensor (DT) mouse brain development study, and ii) a structural Magnetic Resonance (sMR) study of human brain aging. We demonstrate the ability of NNMF to produce sparse parts-based representations of the data at various resolutions. These representations seem to follow what we know about the underlying functional organization of the brain and also capture some pathological processes. Moreover, we show that these low dimensional representations favorably compare to descriptions obtained with more commonly used matrix factorization methods like PCA and ICA.

Keywords: Data analysis; Diffusion Tensor Imaging; Fractional anisotropy; Gray matter; Independent Component Analysis; Non-Negative Matrix Factorization; Principal Component Analysis; RAVENS; Structural Magnetic Resonance Imaging; Structural covariance.


Figures

Figure 1
Figure 1
Information regarding the data sets: (a) sample composition by age (in days) for the DT mouse data set; (b) sample composition by age (in years) for the sMR human brain aging study.
Figure 2
Figure 2
Typical components estimated by A) PCA, B) ICA, and C) NNMF are color coded and overlaid over a template mouse brain. The same color-map (shown on the right) was used for all images for ease of comparison. Warmer colors correspond to higher positive values, while cooler colors correspond to lower negative values. Note the partially overlapping nature of the principal and independent components (indicated by red arrows), which limits the comprehensive understanding of the behavior of specific brain regions. Observe, for example, that the cerebellum is encoded by multiple PCs and ICs, often through the use of opposite signs and by being contrasted to different anatomical regions, resulting in a complex representation that limits our ability to readily comprehend its direction of variability. Conversely, non-negative components are well localized, allowing for analysis that enjoys specificity comparable to classical ROI approaches. Note, for example, that a single component signals the cerebellum, facilitating the characterization of its effect.
Figure 3
Figure 3
Front and side views of 3D renderings of typical components estimated by A) PCA, B) ICA, and C) NNMF. The same components as the ones shown in the previous figure are depicted. Note that the color-map and opacity have been optimized to enhance visibility. Warm and cool colors correspond to positive and negative values, respectively. One may readily observe the global support of the estimated PCs that limits the specific of the derived representation. On the contrary, independent components are less dispersed. However, similar structures are encoded by multiple components, obstructing the characterization of specific anatomical regions. Non-negative components are parsimonious and highly non-overlapping, allowing for the characterization of specific brain areas.
Figure 4
Figure 4
Typical components estimated by A) PCA, B) ICA, and C) NNMF are color coded and overlaid over a template human brain. The same color-map (shown on the right) was used for all images for ease of comparison. Warmer colors correspond to higher positive values, while cooler colors correspond to lower negative values. Note how multiple principal and independent components highlight similar anatomical structures (indicated by red arrows). As a consequence, comprehensively understanding the behavior of specific brain regions is challenging. Conversely, non-negative components are well localized, aligning well with anatomical structures and allowing for analysis that enjoys specificity comparable to classical ROI approaches.
Figure 5
Figure 5
Front and side views of 3D renderings of typical components estimated by A) PCA, B) ICA, and C) NNMF. The same components as the ones shown in the previous figure are depicted. Note that the color-map and opacity have been optimized to enhance visibility. Warm and cool colors correspond to positive and negative values, respectively. Principal components are holistic, highly-overlapping and comprise regions of opposite sign. Independent components are sparser than the PCs. However, they are spatially dispersed, hindering the interpretability of the results. Non-negative components exhibit high sparsity, are spatially contiguous and do not overlap, leading to a readily interpretable parts-based representation.
Figure 6
Figure 6
Loading coefficients for every subject (matrix L) are color coded and shown in (a) for the mouse data set, and (b) for the human brain aging data set. From left to right, the results for PCA, ICA and NNMF are shown, respectively. In order to facilitate comparison the coefficients corresponding to each component are normalized to unit norm. The subjects have been sorted in ascending age order. The age of the subjects is given on the horizontal axis. Note that, in both cases, only the coefficients estimated by NNMF exhibit a consistent interpretable variation with age, suggesting that the captured components might reflect biological processes related to development and aging, respectively.
Figure 7
Figure 7
The average level of Sparsity is reported as a function of the derived components for (a) the DT mouse data set, and (b) the sMR human brain aging data set. NNMF is characterized by a relatively high level of sparsity, which monotonically increases with the number of derived components.
Figure 8
Figure 8
The Incoherence index is reported as a function of the derived components for (a) the DT mouse data set, and (b) the sMR human brain aging data set. NNMF provides increasingly coherent components by virtue of delivering sparse representations that group strongly co-varying regions.
Figure 9
Figure 9
The Mean Squared Error of the regression model for the Cross Validated data is reported as a function of the derived components for (a) the DT mouse data, and (b) sMR human brain aging data set. Note that, given an adequate number of features, the obtained prediction accuracy is similar for all three methods.
Figure 10
Figure 10
The average value of the coefficient of determination (R2) is reported as a function of the derived components for (a) the DT mouse data, and (b) sMR human brain aging data set. The non-negative expansion coefficients estimated by NNMF capture age-related information, suggesting that the derived components might reflect biological processes related to development and aging, respectively.
Figure 11
Figure 11
The Reconstruction Error is reported as a function of the derived components for (a) the DT mouse data, and (b) sMR human brain aging data set. PCA and ICA faithfully model the data by exploiting all available degrees of freedom, hence, being potentially prone to over-learning.
Figure 12
Figure 12
Reproducibility of results: The median value of the inner product between independently estimated corresponding components is reported. We present results by varying the number of derived components. NNMF demonstrates a better ability to generalize to unseen data.
Figure 13
Figure 13
Characteristic components estimated by NNMF. Different visualization strategies were used in order to enhance the visual perception of the components (note that the 2D images use radiographic convention). Warmer colors correspond to higher values. Note the alignment with anatomical regions: 1) prefrontal cortex; 2) superior frontal cortex; 3) superior lateral cortex; 4) left occipital lobe; 5) right occipital lobe; 6) inferior anterior temporal; 7) motor cortex; 8) thalamus and putamen; 9) head of caudate; 10) peri-ventricular structures; 11) amygdala and hippocampus; 12) fusiform; 13) medial parietal including precuneus; and 14) anterior and middle cingulate.

Similar articles

Cited by

References

    1. Alexander-Bloch A, Giedd JN, Bullmore E. Imaging structural co-variance between human brain regions. Nature reviews. Neuroscience. 2013 May;14(5):322–336. - PMC - PubMed
    1. Ashburner J. Computational anatomy with the SPM software. Magnetic Resonance Imaging. 2009 Oct;27(8):1163–1174. - PubMed
    1. Ashburner J, Friston KJ. Voxel-Based Morphometry–The Methods. NeuroImage. 2000 Jun;11(6):805–821. - PubMed
    1. Ashburner J, Hutton C, Frackowiak R, Johnsrude I, Price C, Friston K. Identifying global anatomical differences: deformation-based morphometry. Human Brain Mapping. 1998 Jan;6(5–6):348–357. - PMC - PubMed
    1. Ashburner J, Klöppel S. Multivariate models of inter-subject anatomical variability. NeuroImage. 2011 May;56(2):422–439. - PMC - PubMed

Publication types