

BOLD fractional contribution to resting-state functional connectivity above 0.1 Hz
- PMID: 25497686
- PMCID: PMC4318656
- DOI: 10.1016/j.neuroimage.2014.12.012
BOLD fractional contribution to resting-state functional connectivity above 0.1 Hz
Abstract
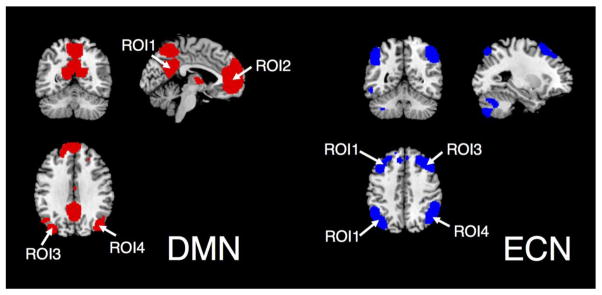
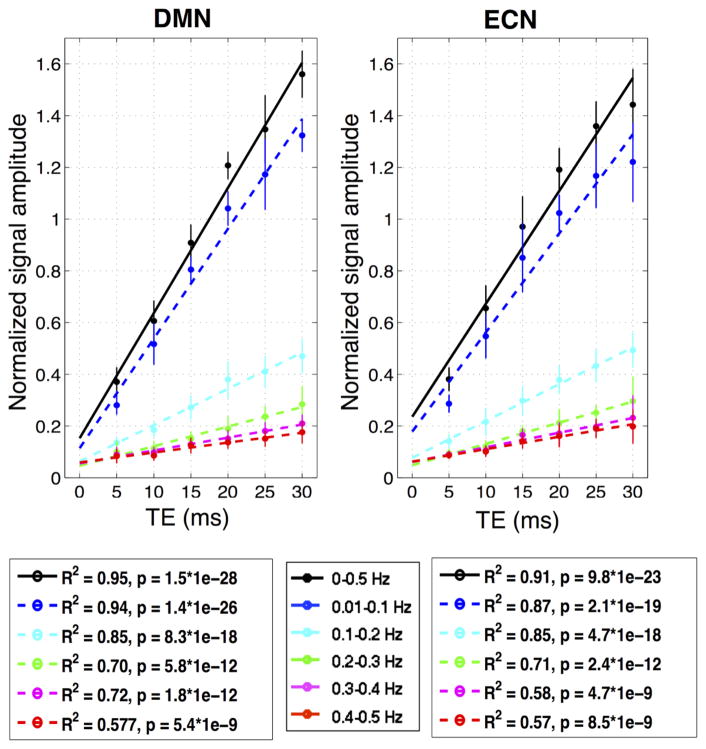
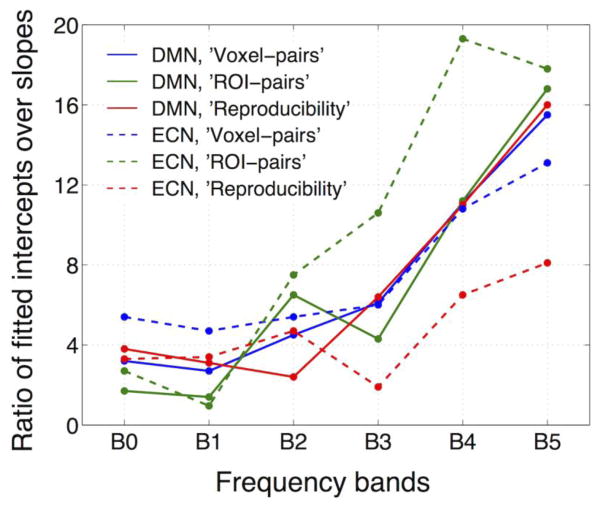
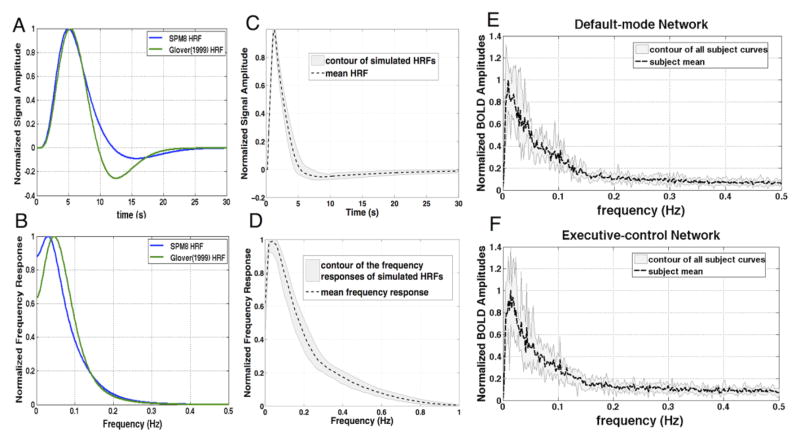
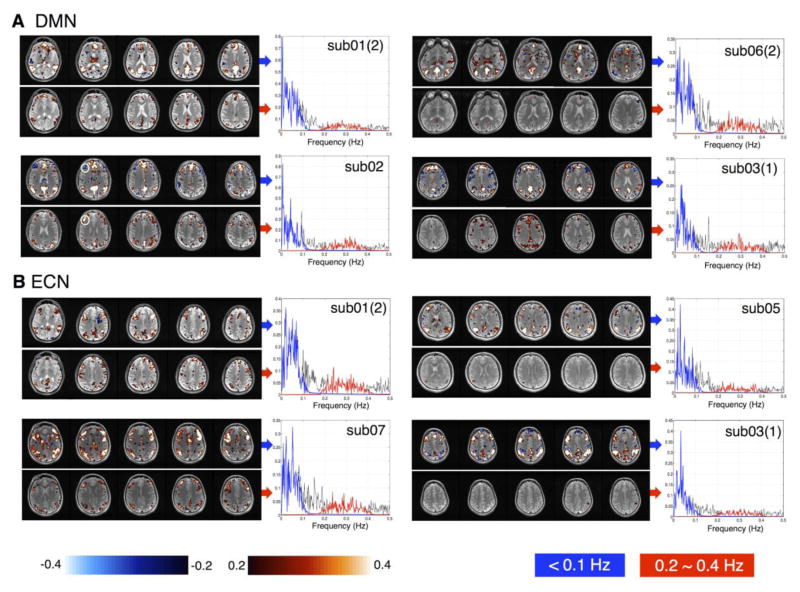
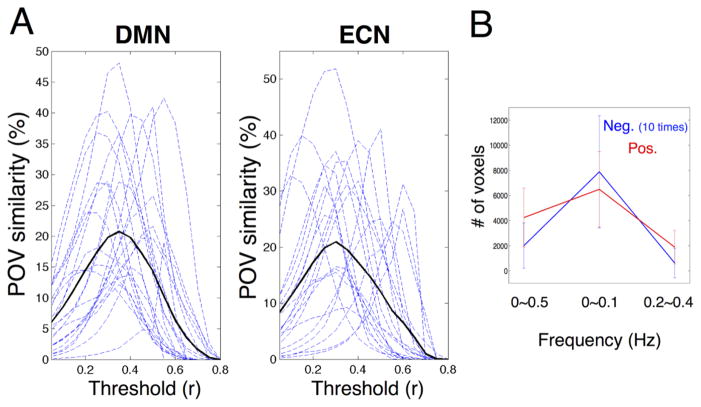
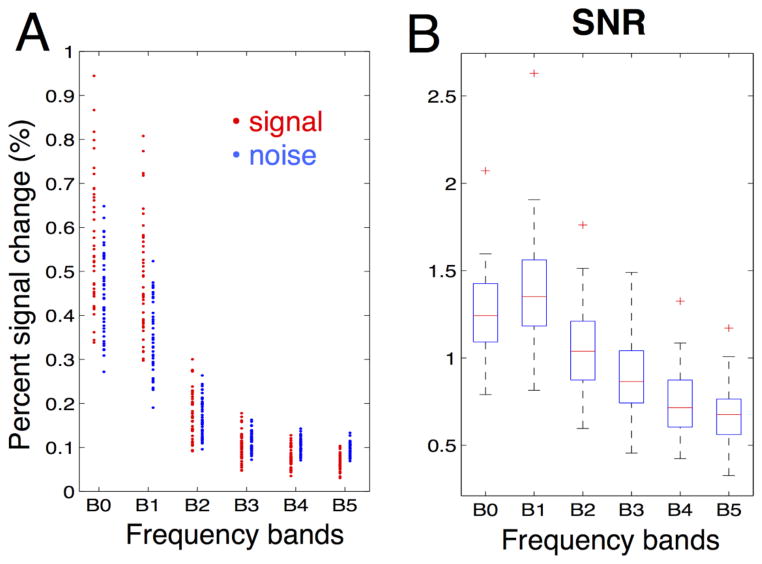
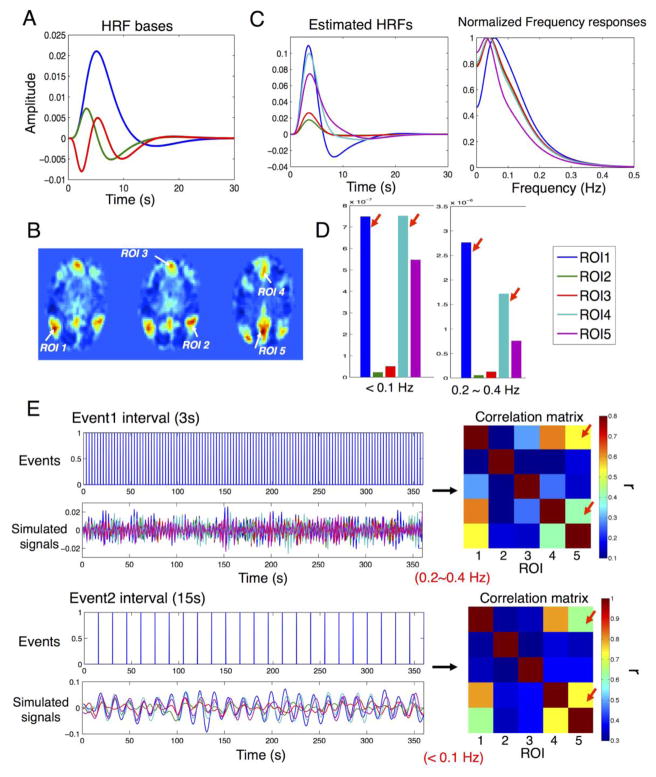
Blood oxygen level dependent (BOLD) spontaneous signals from resting-state (RS) brains have typically been characterized by low-pass filtered timeseries at frequencies ≤ 0.1 Hz, and studies of these low-frequency fluctuations have contributed exceptional understanding of the baseline functions of our brain. Very recently, emerging evidence has demonstrated that spontaneous activities may persist in higher frequency bands (even up to 0.8 Hz), while presenting less variable network patterns across the scan duration. However, as an indirect measure of neuronal activity, BOLD signal results from an inherently slow hemodynamic process, which in fact might be too slow to accommodate the observed high-frequency functional connectivity (FC). To examine whether the observed high-frequency spontaneous FC originates from BOLD contrast, we collected RS data as a function of echo time (TE). Here we focus on two specific resting state networks - the default-mode network (DMN) and executive control network (ECN), and the major findings are fourfold: (1) we observed BOLD-like linear TE-dependence in the spontaneous activity at frequency bands up to 0.5 Hz (the maximum frequency that can be resolved with TR=1s), supporting neural relevance of the RSFC at a higher frequency range; (2) conventional models of hemodynamic response functions must be modified to support resting state BOLD contrast, especially at higher frequencies; (3) there are increased fractions of non-BOLD-like contributions to the RSFC above the conventional 0.1 Hz (non-BOLD/BOLD contrast at 0.4-0.5 Hz is ~4 times that at <0.1 Hz); and (4) the spatial patterns of RSFC are frequency-dependent. Possible mechanisms underlying the present findings and technical concerns regarding RSFC above 0.1 Hz are discussed.
Keywords: Above 0.1Hz; BOLD-like TE-dependence; High frequency; Resting state functional connectivity.
Copyright © 2014 Elsevier Inc. All rights reserved.
Figures
Similar articles
-
Distributed BOLD and CBV-weighted resting-state networks in the mouse brain.Neuroimage. 2014 Feb 15;87:403-15. doi: 10.1016/j.neuroimage.2013.09.050. Epub 2013 Sep 29. Neuroimage. 2014. PMID: 24080504
-
Infraslow Electroencephalographic and Dynamic Resting State Network Activity.Brain Connect. 2017 Jun;7(5):265-280. doi: 10.1089/brain.2017.0492. Brain Connect. 2017. PMID: 28462586 Free PMC article.
-
Different neural manifestations of two slow frequency bands in resting functional magnetic resonance imaging: a systemic survey at regional, interregional, and network levels.Brain Connect. 2014 May;4(4):242-55. doi: 10.1089/brain.2013.0182. Epub 2014 Mar 24. Brain Connect. 2014. PMID: 24456196
-
Spontaneous low-frequency blood oxygenation level-dependent fluctuations and functional connectivity analysis of the 'resting' brain.Magn Reson Imaging. 2008 Sep;26(7):1055-64. doi: 10.1016/j.mri.2008.05.008. Epub 2008 Jul 26. Magn Reson Imaging. 2008. PMID: 18657923 Review.
-
Spontaneous low-frequency fluctuations in the BOLD signal in schizophrenic patients: anomalies in the default network.Schizophr Bull. 2007 Jul;33(4):1004-12. doi: 10.1093/schbul/sbm052. Epub 2007 Jun 7. Schizophr Bull. 2007. PMID: 17556752 Free PMC article. Review.
Cited by
-
Estimates of locus coeruleus function with functional magnetic resonance imaging are influenced by localization approaches and the use of multi-echo data.Neuroimage. 2021 Aug 1;236:118047. doi: 10.1016/j.neuroimage.2021.118047. Epub 2021 Apr 24. Neuroimage. 2021. PMID: 33905860 Free PMC article.
-
Building a Science of Individual Differences from fMRI.Trends Cogn Sci. 2016 Jun;20(6):425-443. doi: 10.1016/j.tics.2016.03.014. Epub 2016 Apr 30. Trends Cogn Sci. 2016. PMID: 27138646 Free PMC article. Review.
-
Intrinsic macroscale oscillatory modes driving long range functional connectivity in female rat brains detected by ultrafast fMRI.Nat Commun. 2023 Feb 6;14(1):375. doi: 10.1038/s41467-023-36025-x. Nat Commun. 2023. PMID: 36746938 Free PMC article.
-
Resting-state fMRI signals contain spectral signatures of local hemodynamic response timing.bioRxiv [Preprint]. 2023 Jan 26:2023.01.25.525528. doi: 10.1101/2023.01.25.525528. bioRxiv. 2023. Update in: Elife. 2023 Aug 11;12:e86453. doi: 10.7554/eLife.86453. PMID: 36747821 Free PMC article. Updated. Preprint.
-
Characterization of resting functional MRI activity alterations across epileptic foci and networks.Cereb Cortex. 2022 Dec 8;32(24):5555-5568. doi: 10.1093/cercor/bhac035. Cereb Cortex. 2022. PMID: 35149867 Free PMC article.
References
Publication types
MeSH terms
Substances
Grants and funding
LinkOut - more resources
Full Text Sources
Other Literature Sources
Medical
