. 2015 Feb:74:219-28.
doi: 10.1016/j.nbd.2014.12.001. Epub 2014 Dec 9.

Phenotypic characterization of a Csf1r haploinsufficient mouse model of adult-onset leukodystrophy with axonal spheroids and pigmented glia (ALSP)

Affiliations

Phenotypic characterization of a Csf1r haploinsufficient mouse model of adult-onset leukodystrophy with axonal spheroids and pigmented glia (ALSP)

Violeta Chitu et al. Neurobiol Dis. 2015 Feb.

Abstract

Mutations in the colony stimulating factor-1 receptor (CSF1R) that abrogate the expression of the affected allele or lead to the expression of mutant receptor chains devoid of kinase activity have been identified in both familial and sporadic cases of ALSP. To determine the validity of the Csf1r heterozygous mouse as a model of adult-onset leukoencephalopathy with axonal spheroids and pigmented glia (ALSP) we performed behavioral, radiologic, histopathologic, ultrastructural and cytokine expression studies of young and old Csf1r+/- and control Csf1r+/+ mice. Six to 8-month old Csf1r+/- mice exhibit cognitive deficits, and by 9-11 months develop sensorimotor deficits and in male mice, depression and anxiety-like behavior. MRIs of one year-old Csf1r+/- mice reveal lateral ventricle enlargement and thinning of the corpus callosum. Ultrastructural analysis of the corpus callosum uncovers dysmyelinated axons as well as neurodegeneration, evidenced by the presence of axonal spheroids. Histopathological examination of 11-week-old mice reveals increased axonal and myelin staining in the cortex, increase of neuronal cell density in layer V and increase of microglial cell densities throughout the brain, suggesting that early developmental changes contribute to disease. By 10-months of age, the neuronal cell density normalizes, oligodendrocyte precursor cells increase in layers II-III and V and microglial densities remain elevated without an increase in astrocytes. Also, the age-dependent increase in CSF-1R+ neurons in cortical layer V is reduced. Moreover, the expression of Csf2, Csf3, Il27 and Il6 family cytokines is increased, consistent with microglia-mediated inflammation. These results demonstrate that the inactivation of one Csf1r allele is sufficient to cause an ALSP-like disease in mice. The Csf1r+/- mouse is a model of ALSP that will allow the critical events for disease development to be determined and permit rapid evaluation of therapeutic approaches. Furthermore, our results suggest that aberrant activation of microglia in Csf1r+/- mice may play a central role in ALSP pathology.

Keywords: ALSP; CSF-1R; Dysmyelination; GM-CSF; HDLS; Leukodystrophy; Microglia.


Figures

Figure 1
Figure 1. Older adult Csf1r+/− mice exhibit cognitive, sensorimotor, emotional and olfactory deficits
(A) Lower preference for the novel (re-located) object in 6-8 month-old Csf1r+/− compared with Csf1r+/+ mice, indicative of visuospatial memory deficits (left panel; *, F1,35=4.9; p<0.03) and failure of a higher percentage of Csf1r+/− mice in the novel object location test (defined as <55%, Chi Square p< 0.01; right panel). (B) Object exploration during the object location test and (C) ambulation in the open field at 6-8 months of age. (D) Motor coordination deficits of 9-10 month-old Csf-1r+/− mice, assessed by the number of slips on a narrow round beam (*, F1,37=7.8; p<0.008). (E) Increased depression-like behavior in 9-11 month-old Csf1r+/− male mice, assessed as immobility in the forced swim test (*, F1,20=8.2; P<0.01). (F) Increased anxiety-like behavior in 9-11 month-old Csf1r+/− male mice (elevated plus maze; *F1,20=9.4; P<0.005). (G) Olfactory deficits in 9-11 month-old Csf1r+/− mice (buried food test; *, F1,34=6.3, P<0.02). All mice readily consumed palatable food in a visible food trial (not shown). Mouse numbers are indicated within the bars. The effect of sex was included as a factor in all tests. If sex was not significant, sexes were combined in analyses and graphs. If sex was a significant main effect, the graphs and analyses show the sexes individually.
Figure 2
Figure 2. MRI changes, abnormal myelination and neuronal degeneration of white matter tracts in Csf1r+/− brains
(A) Top row: Selected slices from reconstructed diffusion tensor imaging maps of brains of 12-month-old Csf1r+/− mice with either mild (13-18 balance beam slips) or severe (24-39 slips) sensorimotor deficits and of control Csf1r+/+ mice (3-9 slips). (B) FA maps corresponding to the first and third panels from the left in (A). Areas of low FA in Csf1r+/− compared to control Csf1r+/+ mice are outlined with dotted lines. (C) Quantification of lateral ventricle volumes relative to Csf1r+/+ control volumes derived by analysis of slices starting at +1.18 mm and ending at -1.82 mm from the bregma. LV volume was increased in Csf1r+/− compared to Csf1r+/+ control mice (F2, 7= 8.018, p=0.0014, Kruskal-Wallis test). (D) Quantification of cortical (Cx) and corpus callosum (CC) thicknesses in slices at +1.18 mm from the bregma. Compared to Csf1r+/+ mice, Csf1r+/− mice exhibited decreased callosal thickness (F2, 7= 7.634, p=0.0048), whereas Cx thickness was not significantly changed (F2,7=2.88; p=0.26) (n ≥ 3 mice per group). The p-values for the difference between the Csf1r+/− severe and Csf1r+/+ control groups in LV volume (C) and callosal thickness (D) were determined using Dunn’s post-hoc analysis.
Figure 3
Figure 3. Dysmyelination and neurodegeneration in the white matter of Csf1r+/− mice
Transmission electron microscopy images showing the morphology of corpus callosum neurons obtained from 10-month-old Csf1r+/+ (A) and Csf1r+/− (B, C) mice. Arrows in (B) indicate hypermyelinated axons and arrowheads indicate non-myelinated axons. The arrow in (C) indicates an axonal spheroid. Scale bars: 500 nm (A, B); 1 μ C).
Figure 4
Figure 4. Changes in myelination and neuronal and oligodendrocyte precursor cell populations in the primary motor cortex of Csf1r+/− male mice
(A) Immunostaining for mature neurofilaments (NFHP) and myelin basic protein (MBP) in coronal brain sections. Scale bar: 1 mm. (B) Higher magnification of the boxed areas shown in (A) illustrating the increased MBP and NFHP staining in the upper cortical layers at 11 weeks of age and the increased MBP staining at 10 months of age. Scale bar: 125 μm. (C) Quantification of NeuN+ neurons in individual cortical layers. Note that the increase in cortical layer V neurons of Csf1r+/− mice relative to Csf1r+/+ controls at 11 weeks (w) is lost by 10 months (m). (D) PDGFR+ OLPs are increased in the cortical layers II-III and V of 10 month-old Csf1r+/− mice. Means ± S.E.M.; n=3; * p<0.05 compared to Csf1r+/+ controls, Student’s t test.
Figure 5
Figure 5. Normal astrocyte density in brains of 10 month-old Csf1r+/− male mice
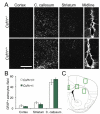
(A) GFAP staining in coronal forebrain sections. Data are representative of 3 mice/genotype. Scale bar, 200 nm. (B) Quantification of the data shown in (A). Means ± S.E.M.; n=3. (C) Anatomical location of the panels shown in (A).
Figure 6
Figure 6. Increased density of microglia in brains of Csf1r+/− male mice
(A) Iba1 staining illustrating the density of microglia in different areas of the brain. Scale bar: 50 μm. (B) Quantification of the density of microglia in prefrontal and hippocampal sections. Grey bars, Csf1r+/+, green bars, Csf1r+/−. Means ± S.E.M.; n=3; *, p<0.05 compared to Csf1r+/+ controls, Student’s two-tailed t test. M1, primary motor cortex; M2, secondary motor cortex.
Figure 7
Figure 7. Increased frequency of CSF-1R+ neurons in aging mice
(A) Forebrain sections stained with antibodies against NeuN (green), CSF-1R (red) and counterstained with DAPI (blue). The arrows point to examples of CSF-1R+ NeuN+ cortical neurons. Scale bar: 50 μm. (B) Quantification of the percentage of CSF-1R+ NeuN+ neurons in different layers of the cortex. Gray bars, Csf1r+/+, green bars, Csf1r+/−. Means ± S.E.M.; n=3 mice/group. Irrespective of the mouse genotype, Csf1r expression increases with age in cortical layers V (F1,8 = 86.85, p<0.0001) and VI (F1,8 = 18.11, p=0.0028). The p-values for the difference between the Csf1r+/− and Csf1r+/+ control groups or between age groups were determined using Tukey’s post-hoc analysis. *, p<0.05; **, p<0.01.
Figure 8
Figure 8. Altered cytokine, chemokine and receptor expression profiles in Csf1r+/− forebrains
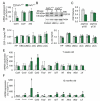
Except where otherwise indicated, estimations were performed on mRNA or protein from the anterior motor cortex and corpus callosum of 12 month-old mice. (A) Quantitative RT-PCR for the CSF-1R and its ligands (n=2). (B) Western blots for the CSF-1R, showing expression of mature (~165 kDa) and immature (~135 kDa) forms of the CSF-1R. (C) Quantitation of the CSF-1R western blot data (n=2). (D) Concentrations of CSF-1 and IL-34 in various brain regions of seven week-old mice determined by ELISA. Means ± range; n=2 mice/genotype. (E, F) Csf1r haploinsufficiency–associated changes in the expression of mRNAs of inflammatory cytokines, chemokines and receptors identified by qRT-PCR at 7 weeks (E) and 12 months (F) of age. Beta actin and GAPDH were used as house keeping gene standards in all experiments. Means ± S.E.M.; n=3 mice/genotype. The two-sided moderate t-test was performed using the LIMMA package in Bioconductor, while accounting for batch effects, where appropriate. *, p<0.05 vs Csf1r+/+. HP, hippocampus; OBCx olfactory bulb and accessory cortex; aMCx, anterior motor cortex; aCC, anterior corpus callosum; pMCx, posterior motor cortex; pCC, posterior corpus callosum. Grey bars indicate Csf1r+/+, green bars indicate Csf1r+/−.
Figure 9
Figure 9. Model of cellular interactions contributing to neurodegeneration in aging Csf1r+/− mice
The upper panel depicts the neuroprotective actions of the CSF-1R in aging wild type mice. Upregulation of CSF-1R on aging neurons (Fig. 7) is neuroprotective (Luo et al., 2013; Nandi et al., 2012). In microglia, CSF-1R signaling promotes a quiescent phenotype. These microglia may produce neuroprotective factors, keeping the balance between age-related neurodegeneration and survival in favor of survival. The lower panel illustrates effects of insufficient CSF1R expression in Csf1r+/− mice. Insufficient CSF1R signaling in Csf1r+/− neurons leads to more rapid neurodegeneration (Figs 3, 4C, 7). These neurons are hypermyelinated (Fig 4A, B) and upon their death, increase the autoantigenic load, leading to inflammation and possibly to autoimmunity. Stimulation of Csf1r+/− microglia by neuronal debris in the presence of increased GM-CSF and decreased CSF-1R signaling induces an activated dendritic cell-like state with the production of neurotoxic factors, such as IL-6 (Fig 8F) (Fischer et al., 1993; Smith, 1993). Concomitant upregulation of IL-6 and IL6Rα in the brain (Fig 8F) enhances IL-6 trans-signaling ultimately leading to neurotoxicity (Campbell et al., 2014). This establishes a feedback loop that enhances neurodegeneration.

References

    1. Ahmed R, et al. A novel A781V mutation in the CSF1R gene causes hereditary diffuse leucoencephalopathy with axonal spheroids. J Neurol Sci. 2013;332:141–4. - PMC - PubMed
    1. Axelsson R, et al. Hereditary diffuse leucoencephalopathy with spheroids. Acta Psychiatr Scand Suppl. 1984;314:1–65. - PubMed
    1. Baldwin GC, et al. Identification and characterization of a high-affinity granulocyte-macrophage colony-stimulating factor receptor on primary rat oligodendrocytes. Blood. 1993;82:3279–82. - PubMed
    1. Campbell IL, et al. Trans-signaling is a dominant mechanism for the pathogenic actions of interleukin-6 in the brain. J Neurosci. 2014;34:2503–13. - PMC - PubMed
    1. Caterini F, et al. Object recognition and object orientation in Alzheimer's disease. Neuropsychology. 2002;16:146–55. - PubMed

Publication types

MeSH terms

Substances

Supplementary concepts