. 2015 Jan;8(1):63-72.
doi: 10.1016/j.jcmg.2014.07.027. Epub 2014 Nov 5.

Macrophages and intravascular OCT bright spots: a quantitative study

Affiliations

Macrophages and intravascular OCT bright spots: a quantitative study

Jennifer E Phipps et al. JACC Cardiovasc Imaging. 2015 Jan.

Abstract

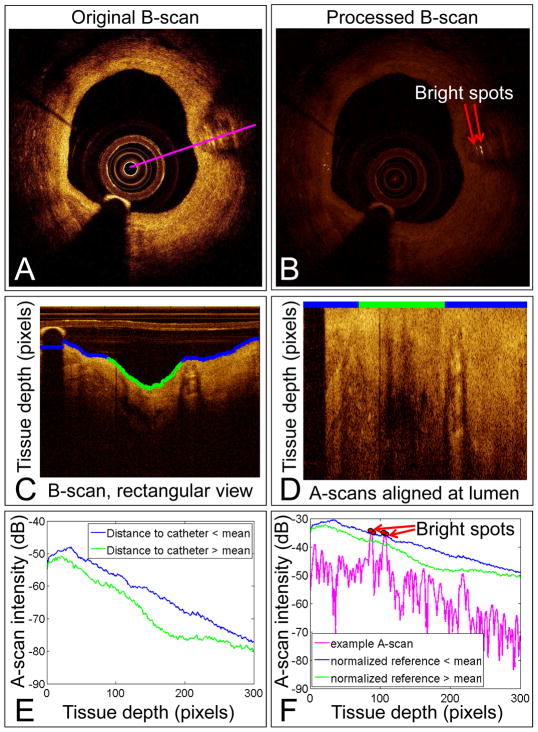
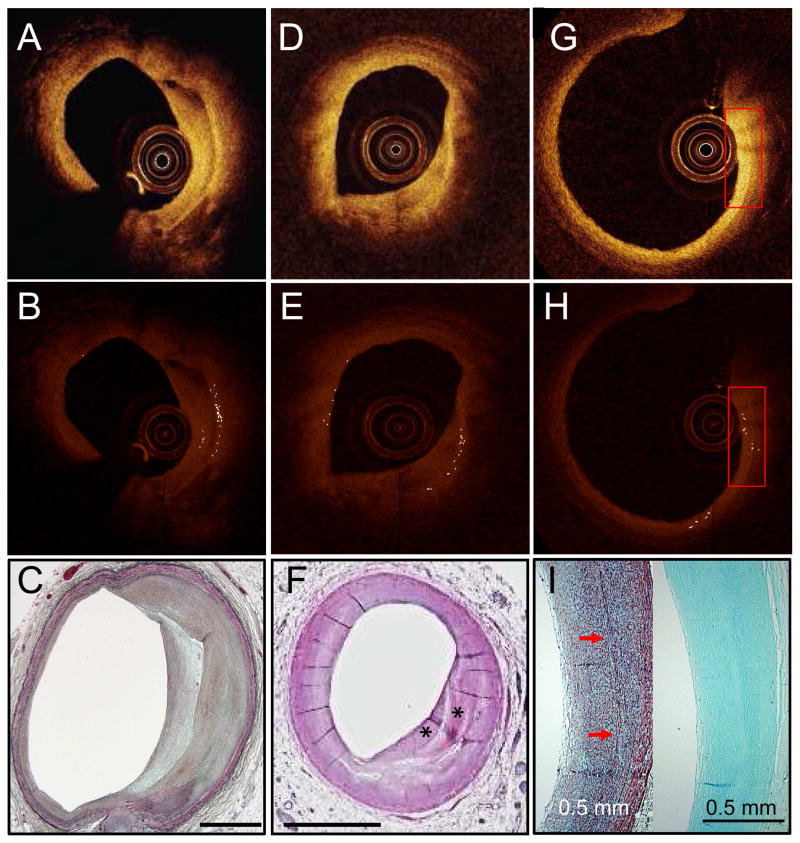
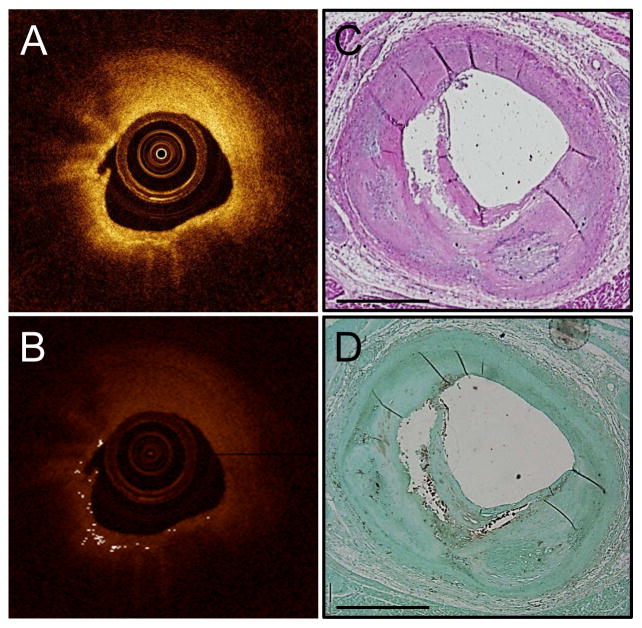
Objectives: This study hypothesized that bright spots in intravascular optical coherence tomography (IVOCT) images may originate by colocalization of plaque materials of differing indexes of refraction. To quantitatively identify bright spots, we developed an algorithm that accounts for factors including tissue depth, distance from light source, and signal-to-noise ratio. We used this algorithm to perform a bright spot analysis of IVOCT images and compared these results with histological examination of matching tissue sections.

Background: Bright spots are thought to represent macrophages in IVOCT images, and studies of alternative etiologies have not been reported.

Methods: Fresh human coronary arteries (n = 14 from 10 hearts) were imaged with IVOCT in a mock catheterization laboratory and then processed for histological analysis. The quantitative bright spot algorithm was applied to all images.

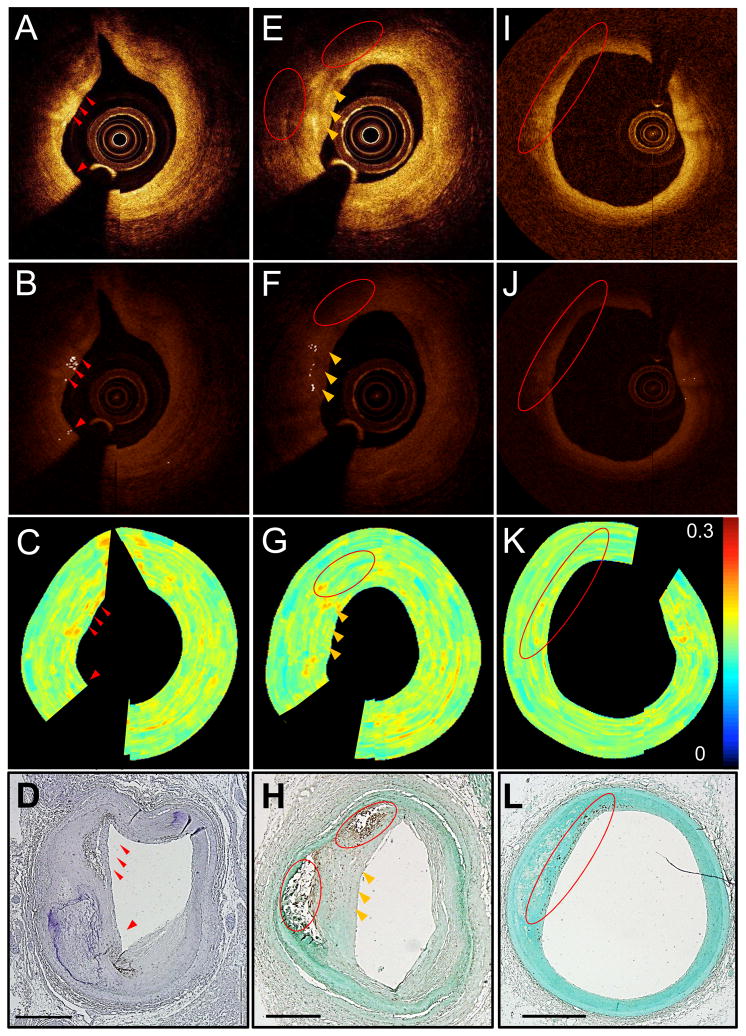
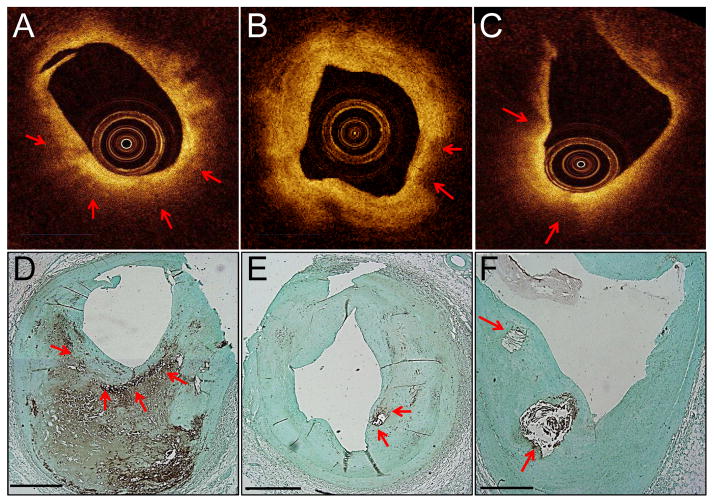
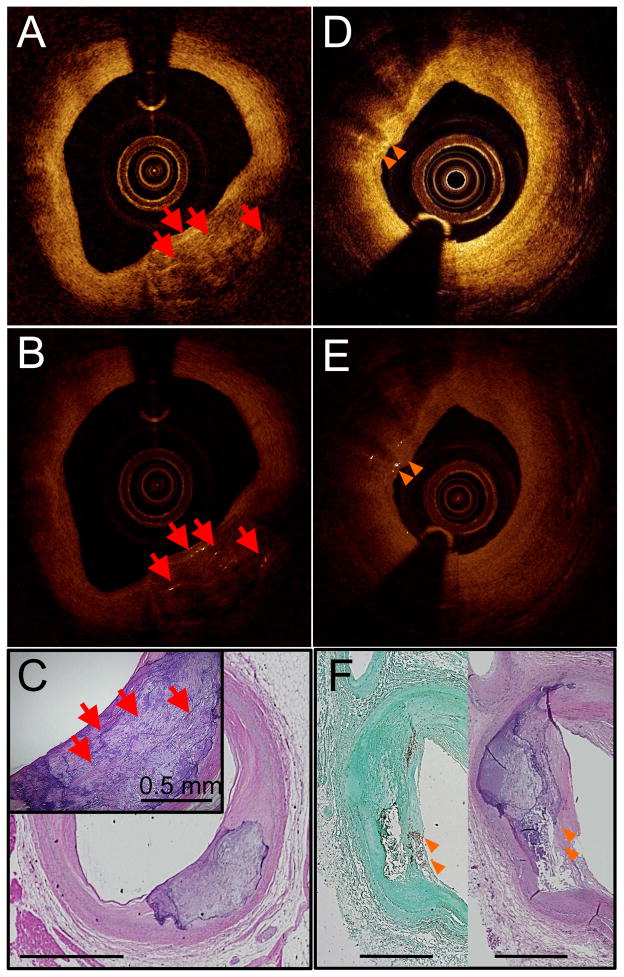
Results: Results are reported for 1,599 IVOCT images co-registered with histology. Macrophages alone were responsible for only 23% of the bright spot-positive regions, although they were present in 57% of bright spot-positive regions (as determined by histology). Additional etiologies for bright spots included cellular fibrous tissue (8%), interfaces between calcium and fibrous tissue (10%), calcium and lipids (5%), and fibrous cap and lipid pool (3%). Additionally, we showed that large pools of macrophages in CD68(+) histology sections corresponded to dark regions in comparative IVOCT images; this is due to the fact that a pool of lipid-rich macrophages will have the same index of refraction as a pool of lipid and thus will not cause bright spots.

Conclusions: Bright spots in IVOCT images were correlated with a variety of plaque components that cause sharp changes in the index of refraction. Algorithms that incorporate these correlations may be developed to improve the identification of some types of vulnerable plaque and allow standardization of IVOCT image interpretation.

Keywords: intravascular optical coherence tomography; macrophages; quantitative analysis bright spots.


Figures

Figure 1
Figure 1. Bright spot quantification method
An original B-scan (A). Algorithm-processed B-scan showing the identified bright spots (B). B-scan from (A) converted to a rectangular view (C). The blue and green line marks the tissue lumen identified by the algorithm. The blue tissue edge identifies A-scans that are closer than the mean distance to the catheter; the green tissue edge identifies A-scans further than the mean distance to the catheter. Original B-scan with A-scans aligned at the blue and green line from (C) (D). Averaged A-scans from the blue and green regions in (C) (E). The intensity required to be considered a bright spot decreases with tissue depth and increases with closeness to the catheter. An example A-scan shown in magenta (A) compared to the reference value (F). Pixels with intensity greater than the reference value are marked in red and labeled as bright spots in (B). dB=decibels.
Figure 2
Figure 2. Macrophages depicted by our quantitative bright spot detection method
Unprocessed IVOCT image with visible bright spots (red arrows) (A). Algorithm-processed IVOCT image with bright spots identified (B). Normalized standard deviation (NSD) image (C). CD68 stain showing that bright spots were caused by macrophages (D). Unprocessed IVOCT image with bright spots (yellow arrows) and shadows (red circles) caused by macrophages (E). Algorithm-processed IVOCT image with bright spots identified (F). NSD image (G). CD68 stain showing that bright spots came from a region of macrophage positivity and that the red circled macrophage pool was depicted as a shadow in (E) and (F) (H). Unprocessed IVOCT image from a region with macrophages far from the catheter (I). Algorithm-processed IVOCT image showing that bright spots were not found in the CD68+ region (J). NSD image (K). CD68 stains showing macrophage positivity in the red circle (L); this region was too far from the catheter for the signal to identify bright spots. All scale bars are 1 mm.
Figure 3
Figure 3. Macrophages that appear as dark regions
Macrophages and macrophage shadows in IVOCT images. Unprocessed IVOCT images (A–C). CD68 stain verifying the presence of macrophages (D–F). Red arrows mark macrophage-rich regions that appear as dark IVOCT regions, not bright spots. All scale bars are 1 mm.
Figure 4
Figure 4. Bright spots found near calcium
Unprocessed IVOCT image with bright spots caused by calcium mixed with islands of lipid (red arrows) (A). Algorithm-processed IVOCT image with bright spots identified (B). H&E stain (C). Unprocessed IVOCT image with bright spots that cause shadows like macrophages (orange arrows) (D). Algorithm-processed IVOCT image with bright spots identified (E). CD68 (left) and H&E (right) stains showing that macrophages co-mingled with calcium are the cause of the bright spots with shadowing (F). All scale bars are 1 mm unless otherwise noted.
Figure 5
Figure 5. Bright spots found in fibrous tissue
Unprocessed IVOCT image from a region with fibrous tissue layering that generated bright spots (A). Algorithm-processed IVOCT image with bright spots identified (B). Movat’s stain showing layering suggestive of a healed rupture (C). Unprocessed IVOCT image from a region with an interface between fibrous tissue and a long, narrow lipid core (D). Algorithm-processed IVOCT image with bright spots identified (E). H&E stain showing the fibrous components (asterisks) (F). The lipid core appears as a clear band. Unprocessed IVOCT image from a region of cellular fibrous intimal thickening that is rich in smooth muscle cells and proteoglycans (G). Algorithm-processed IVOCT image with bright spots identified (H). Movat’s stain (left) of the region within the inset showing elastin layers (arrows) (I); CD68 stain (right) showing that this region is CD68 negative. All scale bars are 1 mm unless otherwise noted.
Figure 6
Figure 6. Bright spots in TCFA
Unprocessed IVOCT image that was classified as TCFA by histology (A). Algorithm-processed IVOCT image with bright spots identified (B). H&E stain showing a TCFA (C). CD68 stain showing macrophages at the fibrous cap and lipid pool interface (D).

Comment in

References

    1. Tearney GJ, Regar E, Akasaka T, et al. Consensus standards for acquisition, measurement, and reporting of intravascular optical coherence tomography studies: a report from the International Working Group for Intravascular Optical Coherence Tomography Standardization and Validation. J Am Coll Cardiol. 2012;59:1058–72. - PubMed
    1. Tearney GJ, Yabushita H, Houser SL, et al. Quantification of macrophage content in atherosclerotic plaques by optical coherence tomography. Circulation. 2003;107:113–9. - PubMed
    1. MacNeill BD, Jang IK, Bouma BE, et al. Focal and multi-focal plaque macrophage distributions in patients with acute and stable presentations of coronary artery disease. J Am Coll Cardiol. 2004;44:972–9. - PubMed
    1. Tahara S, Morooka T, Wang Z, et al. Intravascular optical coherence tomography detection of atherosclerosis and inflammation in murine aorta. Arterioscler Thromb Vasc Biol. 2012;32:1150–7. - PMC - PubMed
    1. Raffel OC, Tearney GJ, Gauthier DD, Halpern EF, Bouma BE, Jang IK. Relationship between a systemic inflammatory marker, plaque inflammation, and plaque characteristics determined by intravascular optical coherence tomography. Arterioscler Thromb Vasc Biol. 2007;27:1820–7. - PMC - PubMed

Publication types