. 2015 Feb;1853(2):500-12.
doi: 10.1016/j.bbamcr.2014.12.003. Epub 2014 Dec 11.

Prostaglandin F2α receptor (FP) signaling regulates Bmp signaling and promotes chondrocyte differentiation

Affiliations

Prostaglandin F2α receptor (FP) signaling regulates Bmp signaling and promotes chondrocyte differentiation

Joohwee Kim et al. Biochim Biophys Acta. 2015 Feb.

Abstract

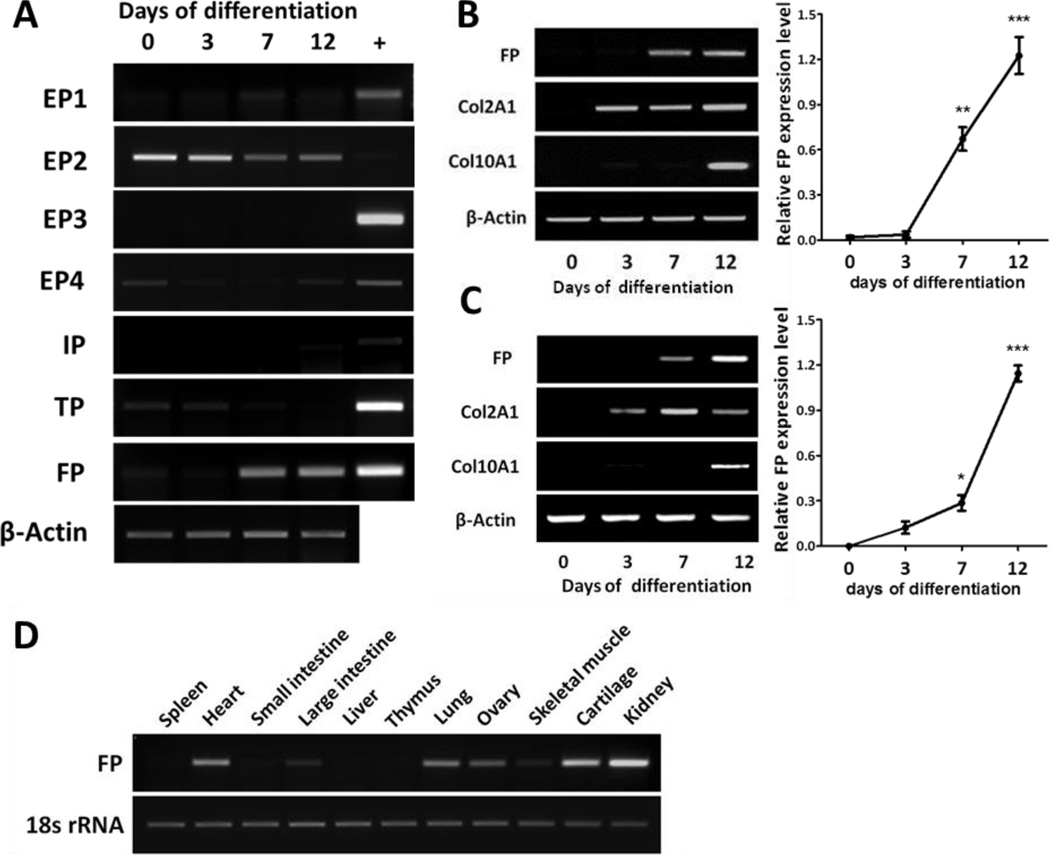
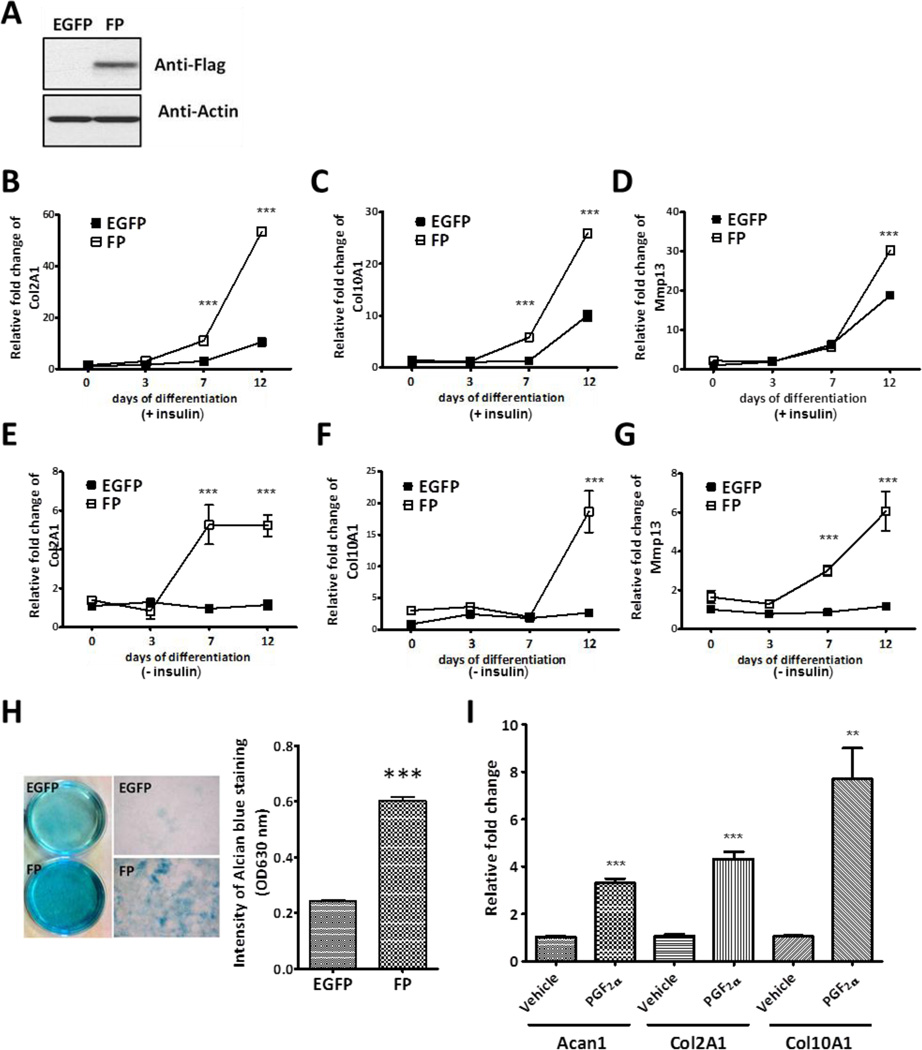
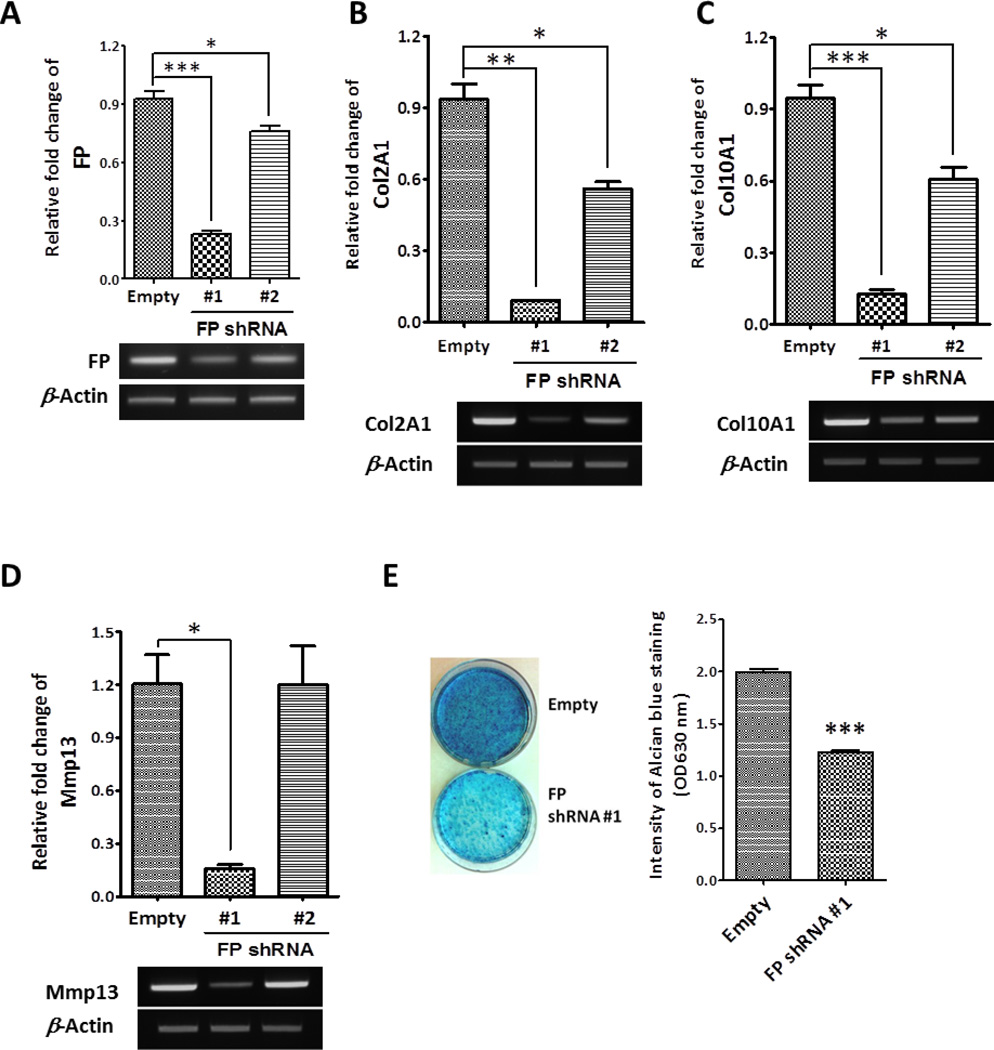
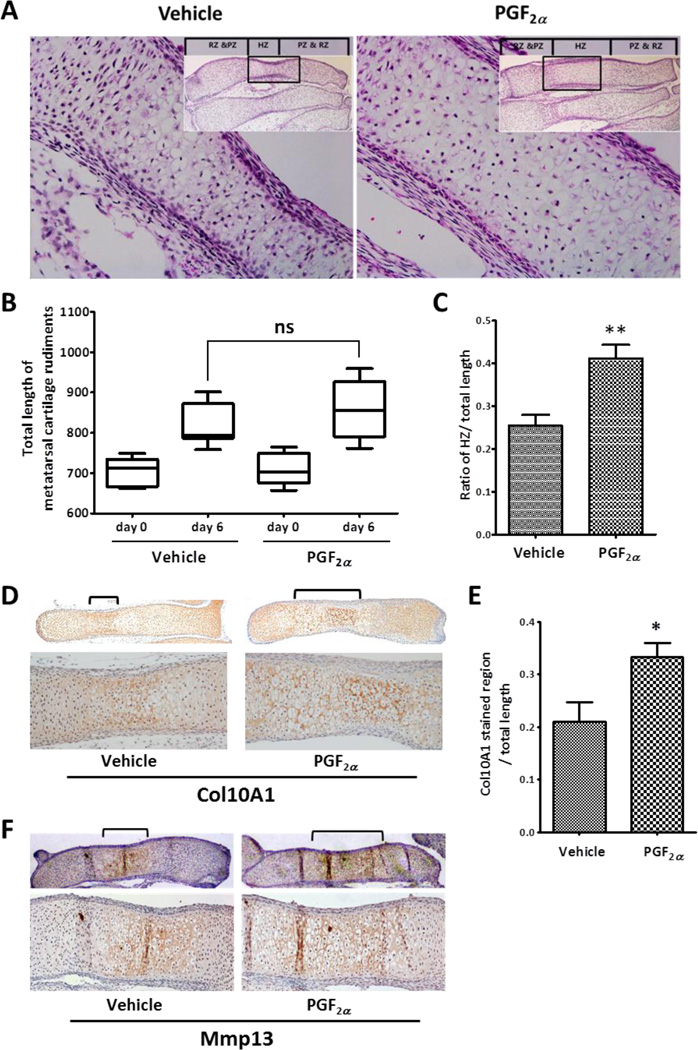
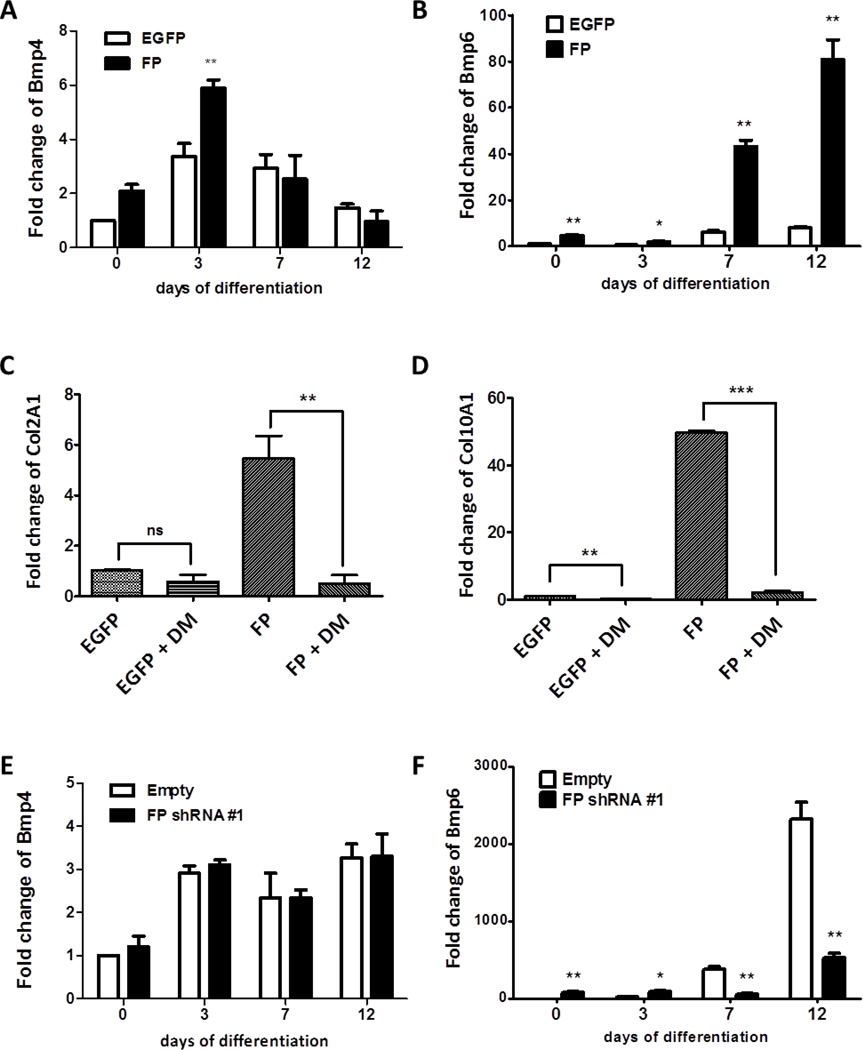
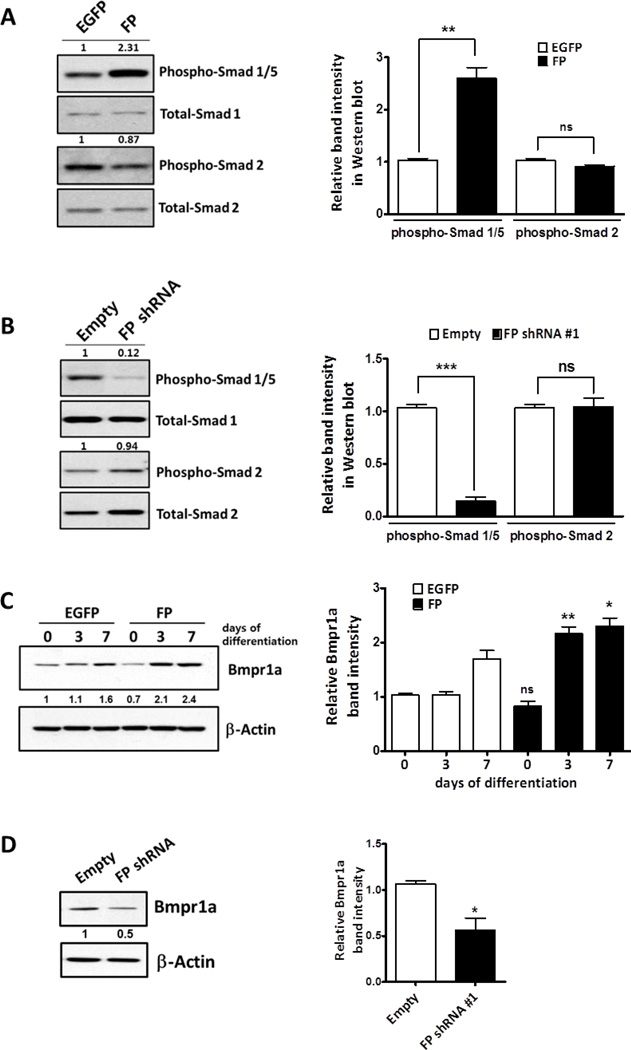
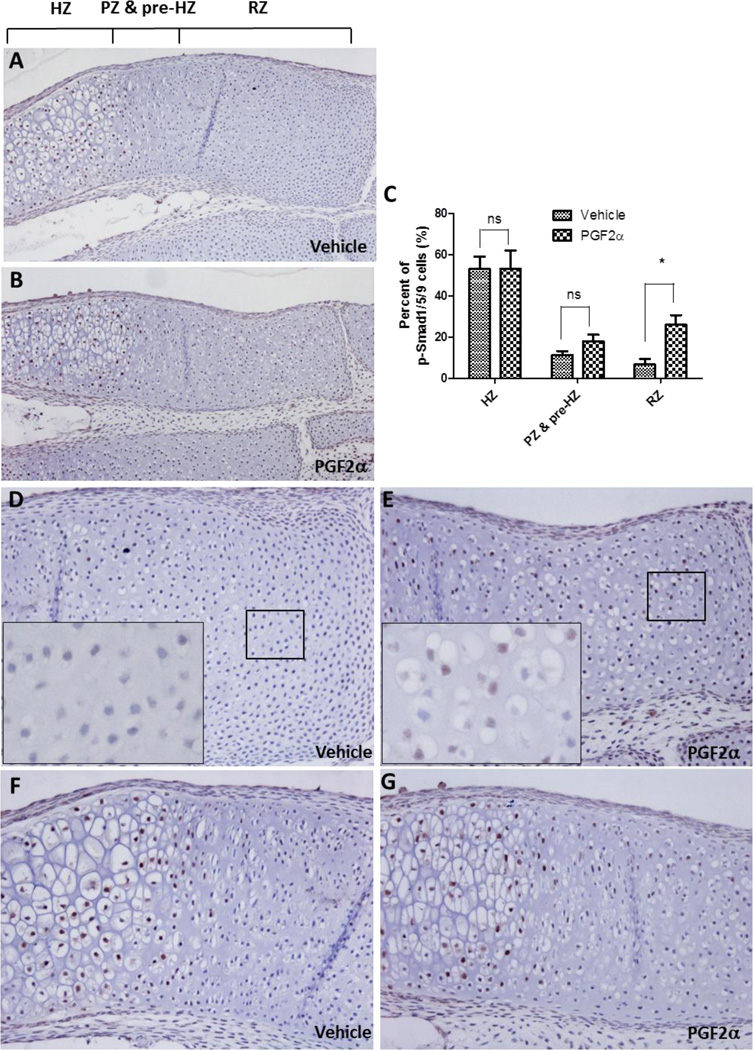
Prostaglandins are a group of lipid signaling molecules involved in various physiological processes. In addition, prostaglandins have been implicated in the development and progression of diseases including cancer, cardiovascular disease, and arthritis. Prostaglandins exert their effects through the activation of specific G protein-coupled receptors (GPCRs). In this report, we examined the role of prostaglandin F2α receptor (FP) signaling as a regulator of chondrocyte differentiation. We found that FP expression was dramatically induced during the differentiation of chondrocytes and was up-regulated in cartilages. Forced expression of FP in ATDC5 chondrogenic cell line resulted in the increased expression of differentiation-related genes and increased synthesis of the extracellular matrix (ECM) regardless of the presence of insulin. Similarly, PGF2α treatment induced the expression of chondrogenic marker genes. In contrast, knockdown of endogenous FP expression suppressed the expression of chondrocyte marker genes and ECM synthesis. Organ culture of cartilage rudiments revealed that PGF2α induces chondrocyte hypertrophy. Additionally, FP overexpression increased the levels of Bmp-6, phospho-Smad1/5, and Bmpr1a, while knockdown of FP reduced expression of those genes. These results demonstrate that up-regulation of FP expression plays an important role in chondrocyte differentiation and modulates Bmp signaling.

Keywords: Bmp; Chondrocytes; FP; Prostaglandin F(2α).


Figures

Figure 1
Figure 1. Prostaglandin F2α receptor (FP) mRNA is highly induced during chondrogenic differentiation of the ATDC5 cell line
(A) Expression of prostaglandin receptors during chondrogenic differentiation of ATDC5 cell line. ATDC5 cells were induced to differentiate in the presence of 10 µg/ml insulin. RNA was isolated at the indicated time points and RT-PCR analysis was conducted. RNA from the mouse kidney and colon were used as a positive control (+). DP was not detected in any sample. (B) RT-PCR analysis of FP, Col2A1, Col10A1, and β-Actin during chondrogenic differentiation of ATDC5 cells (left panel). (n=3, **: p < 0.01, ***: p < 0.001) The level of FP mRNA at each time point was quantified and normalized to β -Actin mRNA using ImageJ software. The relative level of FP was plotted (right panel). (n=3, *: p < 0.05, ***: p < 0.001) (C) RT-PCR analysis of FP, Col2A1, Col10A1, and β -Actin during Bmp2-induced chondrogenic differentiation of C3H10T1/2 cell line (left panel). The expression level of FP at each time point was normalized to the β -Actin level and the relative level of FP was plotted (right panel). (D) RT-PCR analysis for FP expression in various tissues of 4 weeks old C57BL/6 mouse. 18s rRNA served as a loading control.
Figure 2
Figure 2. Stimulation of FP signaling promotes chondrocyte differentiation
(A) Western blot analysis for FLAG-tagged mouse FP. Total lysates from control (EGFP) and FP over-expressing (FP) ATDC5 cells were probed for FLAG. The membrane was stripped and reprobed for β -Actin to confirm equal loading. (B, C, and D) The control and FP over-expressing ATDC5 cells were cultured in the presence of insulin and then the expression level of Col2A1 (B), Col10A1(C), and Mmp13 (D) at each time point was analyzed by quantitative real time PCR (qRT-PCR). The expression levels of marker genes were normalized to β -Actin. Data were expressed as fold changes over control (EGFP) cells at day 0. The data represent the mean ± S.E.M of three independent experiments. (***: p < 0.001) (E, F, and G) The control and FP over-expressing ATDC5 cell lines were cultured for the indicated time points without insulin supplementation. The expression levels of Col2A1 (E), Col10A1 (F), and Mmp13 (G) were analyzed by qRT-PCR. The expression levels of marker genes were normalized to β -Actin. Data were expressed as fold change over control (EGFP) cells at day 0. The data represent the mean ± S.E.M of three independent experiments. (***: p < 0.001) (H) Alcian blue staining of control and FP over-expressing ATDC5 cells at day 12 of culture without insulin supplement (left panel). The relative intensities of alcian blue staining in control and FP stable cell lines were measured by dissolving alcian blue stained cells with 6M guanidine solution. The optical density at 630nm was plotted (***: p < 0.001) (right panel). (I) Effects of PGF2a on the levels of chondrogenic marker. ATDC5 cells were treated with either vehicle or 100 nM PGF2a for 7 days. Expression of Acan1, Col2A1, and Col10A1 mRNAs were quantified by qRT-PCR. The expression levels of marker genes were normalized to β -Actin. Data were expressed as fold change over vehicle treated cells. The data represent the mean ± S.E.M. of three independent experiments. (**: p < 0.01, ***: p < 0.001)
Figure 3
Figure 3. Knockdown of endogenous FP expression suppresses chondrogenic differentiation
(A) The relative FP expression in ATDC5 cells infected with the empty vector- or FP shRNA-encoding (FP shRNA #1 and #2) lentivirus at day 12 of insulin-induced chondrogenic differentiation was analyzed by qRT-PCR and normalized to β -Actin. The expression levels of FP and β -Actin in FP shRNA cell lines were also determined by RT-PCR (gel image under graph A). (B, C, and D) The mRNA levels of (B) Col2A1, (C) Col10A1, and (D) Mmp13 in FP knockdown cells (FP shRNA #1 and #2) were determined by qRT-PCR (upper panel). The relative gene expression was normalized to β -Actin. Data were expressed as fold change over the control cell line. The expression levels of Col2A1, Col10A1, and Mmp13 were also determined by RT-PCR (lower panel). (E) Alcian blue staining of control (empty) and FP knockdown (FP shRNA #1) ATDC5 cells cultured in the presence of 10 µg/ml insulin for 15 days. The intensities of alcian blue staining in control and FP knockdown cell lines at 630 nm was plotted (right panel). (*: p < 0.05, **: p < 0.01, ***: p < 0.001)
Figure 4
Figure 4. PGF enhances ex vivo differentiation of hypertrophic chondrocytes in metatarsal cartilage rudiments
(A) H&E staining of vehicle (A, left panel) or PGF (A, right panel) treated metatarsal cartilage rudiments. The metatarsal cartilage rudiments were cultured in the presence of 100 nM PGF2a for 6 days. The resting and proliferating zone (RZ & PZ) and hypertrophic zone (HZ) were denoted in the image. The inset shows the lower magnification image of the rudiment. (B) The total length of the cartilage rudiment is plotted on the graph. There was no significant difference in total length between vehicle- and PGF2α-treated cartilages (n=5 per each treatment group, ns = no significance). (C) The ratio of the HZ to the total length of cartilage rudiment is presented on the graph. (n=5 per each treatment group, **: p < 0.01) (D) Immunohistochemical staining of Col10A1 in metatarsal cartilage rudiments treated with vehicle or 100 nM PGF for 6 days. Lower magnification images are shown in the upper panel. The lower panel represents a higher magnification image of the area marked with a bracket on the upper image. (E) The ratio of the Col10A1 stained region to the total area was presented on the graph. (n=5 per each treatment group, *: p < 0.05) (F) Immunohistochemical staining of Mmp13 in metatarsal cartilage rudiments treated with vehicle or 100 nM PGF for 6 days. Lower magnification images are shown in the upper panel. The lower panel represents a higher magnification image of the area marked with a bracket on the upper image
Figure 5
Figure 5. FP signaling regulates Bmp expression
(A and B) qRT-PCR analysis of Bmp-4 (A) and Bmp-6 (B) during chondrogenic differentiation of control (EGFP) and FP over-expressing (FP) ATDC5 cells. The control and FP over-expressing ATDC5 cell lines were cultured for the indicated time without insulin supplementation. Data were expressed as fold changes over control (EGFP) cells at day 0.The data represent the mean ± S.E.M of three independent experiments and were analyzed by two-way ANOVA followed by the Bonferroni posttest. (*: p < 0.05, **: p < 0.01, ***: p < 0.001) (C and D) The control (EGFP) and FP over-expressing ATDC5 cell lines were cultured in insulin-free media in the absence or presence (2µM) of dorsomorphin for 7 days. Col2A1 (C) and Col10A1(D) mRNA levels were determined by qRT-PCR analysis. Data were expressed as fold changes over control (EGFP) cells at day 0. The data represent the mean ± S.E.M. of three independent experiments. The fold change of respective genes was compared by t-test and it was significantly different. (**: p < 0.01, ***: p < 0.001) (E and F) qRT-PCR analysis of Bmp-4 (E) and Bmp-6 (F) during insulin-induced chondrogenic differentiation of control (empty) and FP knock-down (FP shRNA #1) ATDC5 cell lines. The cells were induced to differentiate in the presence of 10 µg/ml insulin. Data were expressed as fold changes over control (empty) cells at day 0. The data represent the mean ± S.E.M of three independent experiments and were analyzed by two-way ANOVA followed by the Bonferroni posttest. (*: p < 0.05, **: p < 0.01)
Figure 6
Figure 6. FP signaling stimulates the expression of Bmp signaling components
(A) Western blot analysis of phospho-Smad 1/5 and phospho-Smad2 in control (EGFP) and FP cell line. Control and FP over-expressing ATDC5 cells were cultured for 3 days in the absence of insulin and the total lysates were subjected to Western blot analysis. The membrane was stripped and reprobed for total Smad1 and Smad2. The level of phospho- Smads were quantified and normalized to total Smads using ImageJ software. The numbers on the Western blot represent quantification normalized to total Smads. The graph (right panel) shows fold changes of normalized phospho-Smad1/5 and phospho-Smad2 (compared with EGFP control). (n=3, **: p < 0.01) (B) Western blot analysis of phospho-Smad 1/5 and phospho-Smad2 in control and FP knockdown ATDC5 cell lines at day 7 of insulin-induced differentiation. The membrane was stripped and reprobed for Smad1 and Smad2. The numbers on the Western blot represent quantification normalized to total Smads. The graph (right panel) shows fold changes of normalized phospho-Smad1/5 and phospho-Smad2 (compared with control). (n=3, ***: p < 0.001) (C) The expression of Bmpr1a during chondrogenic differentiation of control and FP cell lines was analyzed by Western blot. The numbers shown on the Western blot represent relative Bmpr1a levels obtained by normalizing densities of each band to β -Actin bands from the same blot. The graph (right panel) shows densitometric analysis of Western blot of Bmpr1a protein. (n=3, *: p < 0.05, **: p < 0.01). (D) Western blot analysis of Bmpr1a in control and FP knockdown ATDC5 cell line at day 7 of differentiation. The numbers shown on the Western blot represent relative Bmpr1a levels obtained by normalizing densities of each band to β-Actin bands from the same blot. The graph (right panel) shows fold changes of normalized Bmpr1a (compared with control). (n=3, **: p < 0.05)
Figure 7
Figure 7. PGF increases levels of phosphorylated Smad1/5/9 in metatarsal cartilage
(A and B) Immunohistochemical staining of phospho-Smad1/5/9 in metatarsal cartilage rudiments treated with vehicle (A) or 100nM PGF (B) for 6 days. The resting (RZ), proliferating zone and pre-hypertrophic (PZ & pre-HZ), and hypertrophic zone (HZ) were denoted in the image. (C) Graphical presentation of phospho-Smad1/5/9 positive cells. (n=3, *: p <0.05) (D and E) High magnification images of resting zone. Insets show higher magnification images of the areas indicated by boxes. (F and G) High magnification images of proliferating, pre-hypertrophic, and hypertrophic zones.

References

    1. Kravis D, Upholt WB. Quantitation of type II procollagen mRNA levels during chick limb cartilage differentiation. Dev Biol. 1985;108:164–172. - PubMed
    1. O'Keefe RJ, Puzas JE, Loveys L, Hicks DG, Rosier RN. Analysis of type II and type X collagen synthesis in cultured growth plate chondrocytes by in situ hybridization: rapid induction of type X collagen in culture. J Bone Miner Res. 1994;9:1713–1722. - PubMed
    1. Wu CW, Tchetina EV, Mwale F, Hasty K, Pidoux I, Reiner A, Chen J, Van Wart HE, Poole AR. Proteolysis involving matrix metalloproteinase 13 (collagenase-3) is required for chondrocyte differentiation that is associated with matrix mineralization. J Bone Miner Res. 2002;17:639–651. - PubMed
    1. Mattot V, Raes MB, Henriet P, Eeckhout Y, Stehelin D, Vandenbunder B, Desbiens X. Expression of interstitial collagenase is restricted to skeletal tissue during mouse embryogenesis. J Cell Sci. 1995;108(Pt 2):529–535. - PubMed
    1. Sugimoto Y, Narumiya S. Prostaglandin E receptors. The Journal of biological chemistry. 2007;282:11613–11617. - PubMed

Publication types

MeSH terms