. 2015 Sep 17;34(38):4914-27.
doi: 10.1038/onc.2014.416. Epub 2014 Dec 15.

Oncogenic KRAS signalling promotes the Wnt/β-catenin pathway through LRP6 in colorectal cancer

Affiliations

Oncogenic KRAS signalling promotes the Wnt/β-catenin pathway through LRP6 in colorectal cancer

E Lemieux et al. Oncogene. .

Abstract

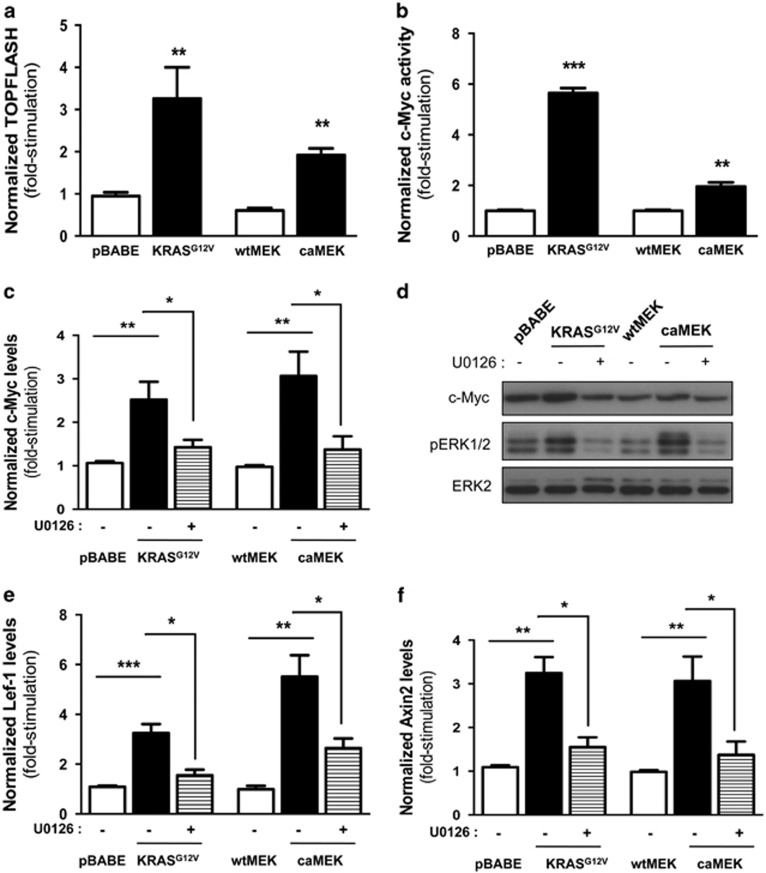
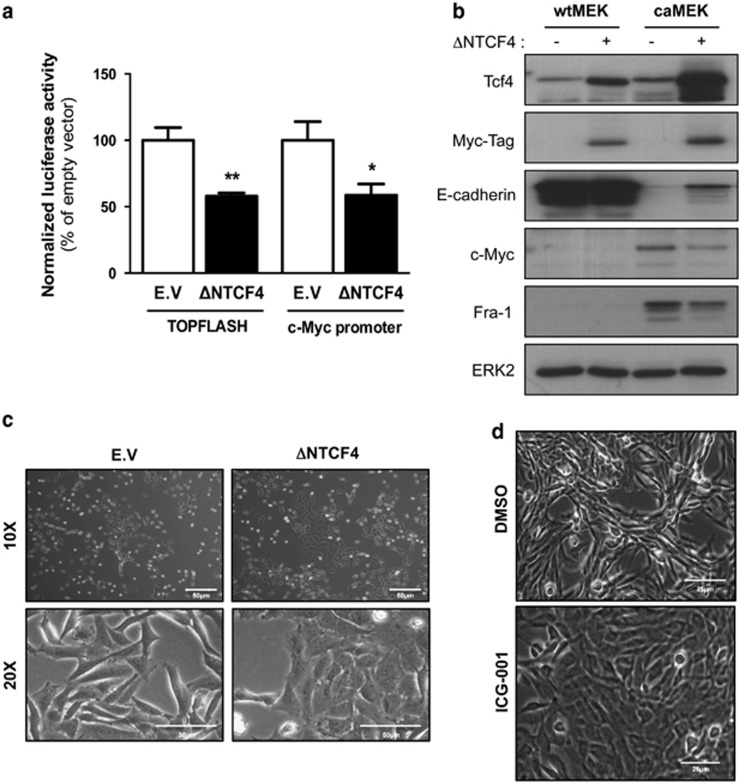
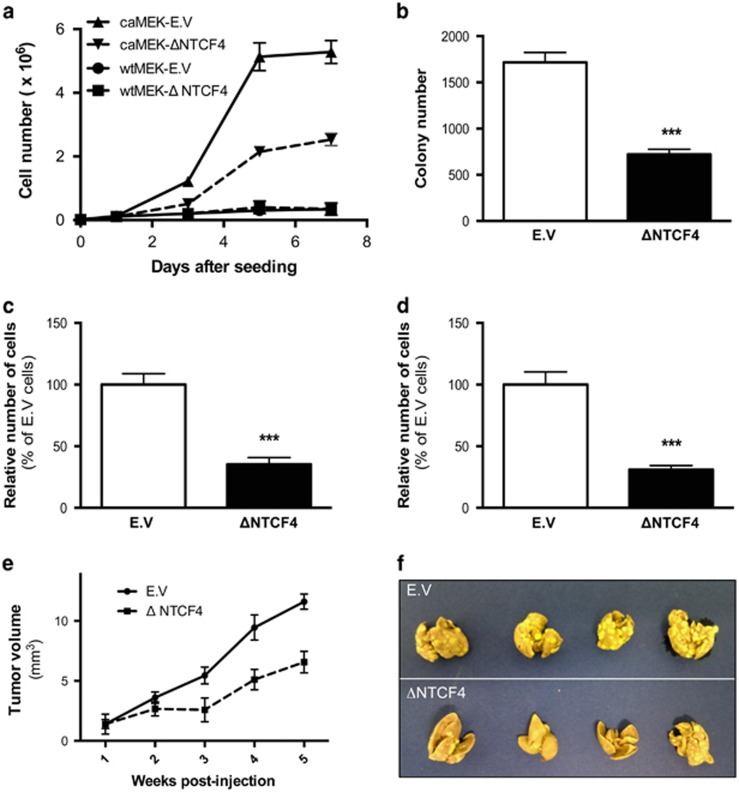
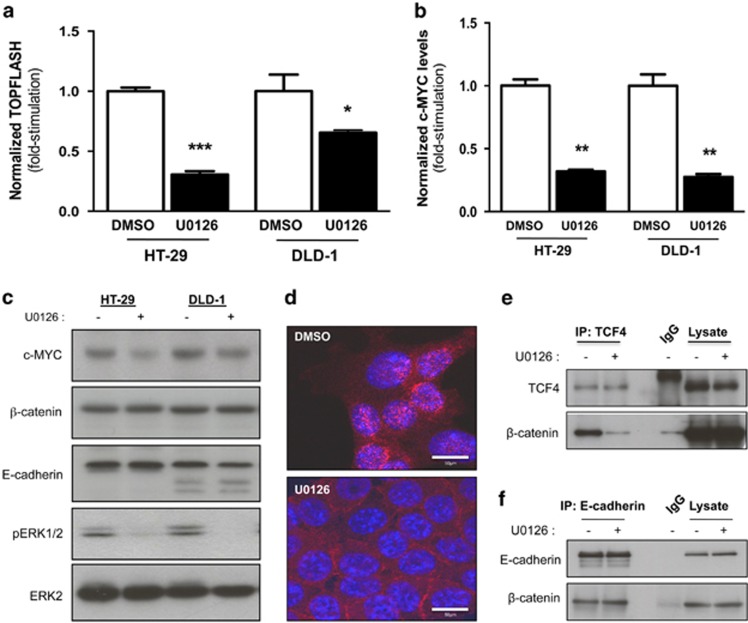
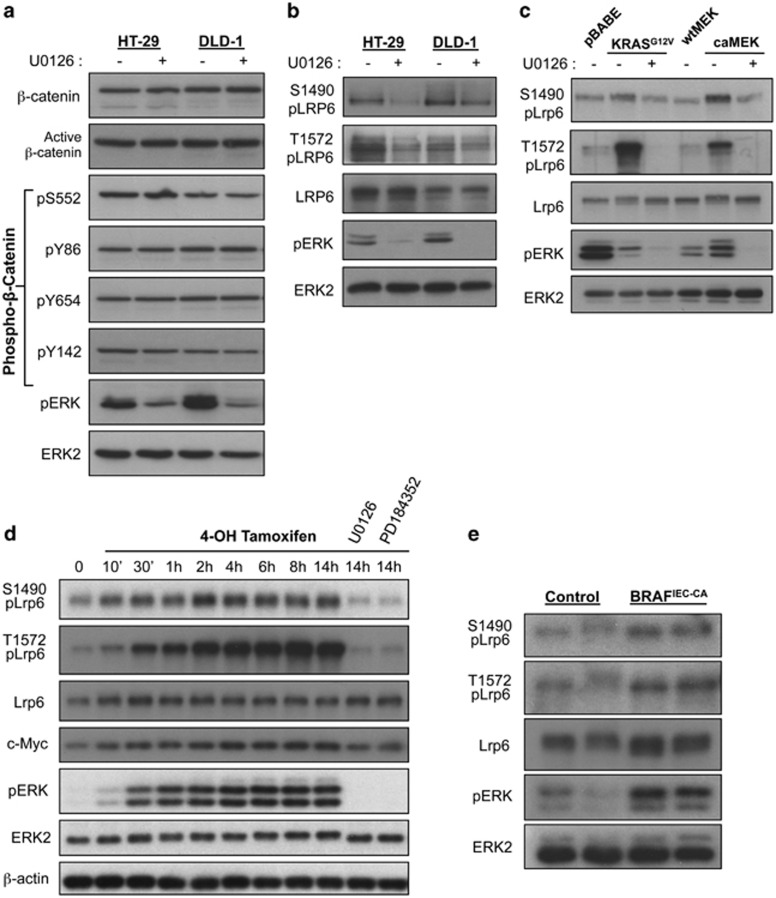
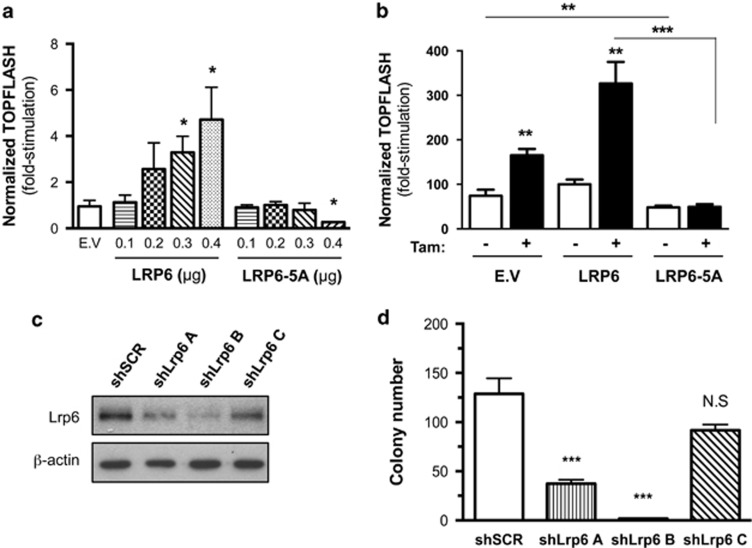
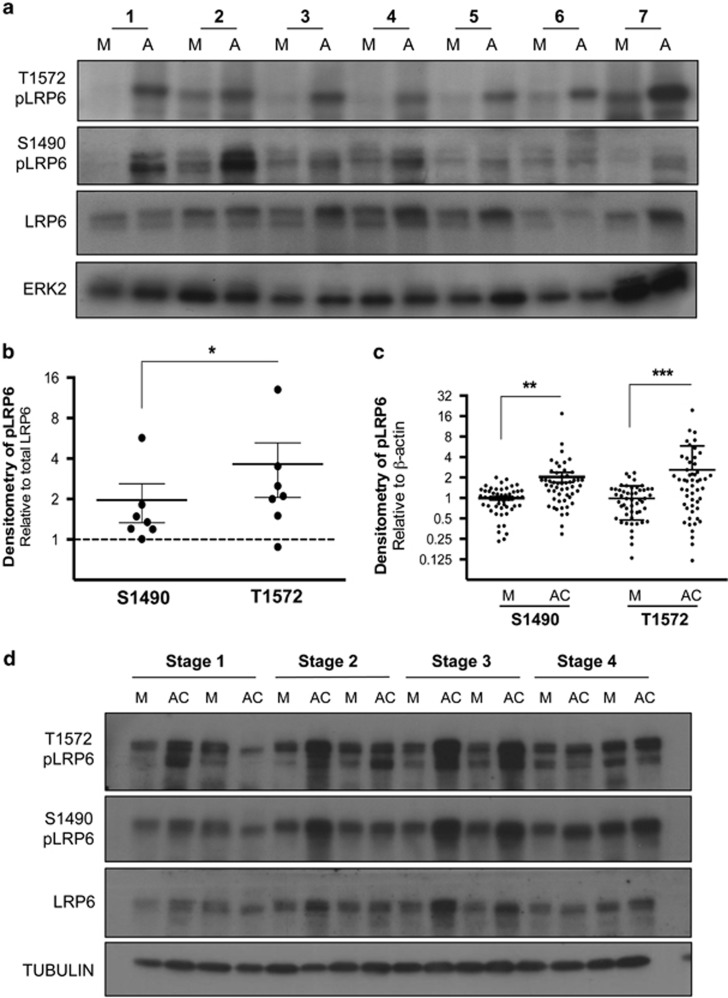
Aberrant regulation of the Wnt/β-catenin signaling pathway is one of the major causes of colorectal cancer (CRC). Loss-of-function mutations in APC are commonly found in CRC, leading to inappropriate activation of canonical Wnt signaling. Conversely, gain-of-function mutations in KRAS and BRAF genes are detected in up to 60% of CRCs. Whereas KRAS/mitogen-activated protein kinase (MAPK) and canonical Wnt/β-catenin pathways are critical for intestinal tumorigenesis, mechanisms integrating these two important signaling pathways during CRC development are unknown. Results herein demonstrate that transformation of normal intestinal epithelial cells (IECs) by oncogenic forms of KRAS, BRAF or MEK1 was associated with a marked increase in β-catenin/TCF4 and c-MYC promoter transcriptional activities and mRNA levels of c-Myc, Axin2 and Lef1. Notably, expression of a dominant-negative mutant of T-Cell Factor 4 (ΔNTCF4) severely attenuated IEC transformation induced by oncogenic MEK1 and markedly reduced their tumorigenic and metastatic potential in immunocompromised mice. Interestingly, the Frizzled co-receptor LRP6 was phosphorylated in a MEK-dependent manner in transformed IECs and in human CRC cell lines. Expression of LRP6 mutant in which serine/threonine residues in each particular ProlineProlineProlineSerine/ThreonineProline motif were mutated to alanines (LRP6-5A) significantly reduced β-catenin/TCF4 transcriptional activity. Accordingly, MEK inhibition in human CRC cells significantly diminished β-catenin/TCF4 transcriptional activity and c-MYC mRNA and protein levels without affecting β-catenin expression or stability. Lastly, LRP6 phosphorylation was also increased in human colorectal tumors, including adenomas, in comparison with healthy adjacent normal tissues. Our data indicate that oncogenic activation of KRAS/BRAF/MEK signaling stimulates the canonical Wnt/β-catenin pathway, which in turn promotes intestinal tumor growth and invasion. Moreover, LRP6 phosphorylation by ERK1/2 may provide a unique point of convergence between KRAS/MAPK and Wnt/β-catenin signalings during oncogenesis.


Figures

Figure 1
Figure 1
Oncogenic KRAS and activated MEK1 induce EMT and perturb β-catenin localization. (a) Representative phase-contrast microscopy images of IEC-6 cells expressing pBABE (empty vector), KRASG12V, wtMEK or caMEK, and treated or not with 20 μM U0126 during 24 h. (b) Equal amounts of whole-cell lysates were separated by 10% SDS–PAGE and proteins analyzed by western blotting with specific antibodies against E-cadherin, phosphorylated ERK1/2, ERK2 and HA tag. (c) IEC-6 cells stably expressing wtMEK (panels 1–3) or caMEK (panels 4–6), pBABE (panels 7–9) or KRASG12V (panels 10–12) were fixed for immunofluorescence and stained for β-catenin protein (red) and DAPI (blue). Panels 3, 6, 9 and 12. Full overlap of the fluorescence signals (yellow). Representative immunofluorescence images are shown. Bars: 25 μm.
Figure 2
Figure 2
Induction of β-catenin/TCF complex transcriptional activity in IECs transformed by oncogenic KRAS or MEK1. (a, b) IEC-6 cells stably expressing pBABE, KRASG12V, wtMEK or caMEK were transfected with 0.3 μg of TOPFLASH/FOPFLASH reporter genes (a) or c-myc/c-mut (4 × TBE2-wt/4 × TBE2-mut) luciferase reporters (b). Thirty-six hours after transfection, cells were lysed and luciferase activity was measured. The increase in luciferase activity was calculated relative to the level observed in pBABE-expressing cells, which was set at 1. Values were also normalized with Renilla-luciferase vector. Results are the mean±s.e. of at least three separate experiments. Significantly different from respective control at *P<0.05; **P<0.01; or ***P<0.001 (Student's t-test). (c, d) Cells expressing pBABE, KRASG12V, wtMEK or caMEK were treated or not with 20 μM U0126 during 24 h. Thereafter, cells were lyzed and mRNA were analyzed with quantitative real-time PCR for expression of c-Myc (c) and proteins were analyzed by western blotting for the expression of c-Myc, phosphorylated ERK1/2 and total ERK2 (d). (e, f) Cells expressing pBABE, KRASG12V, wtMEK or caMEK were treated or not with 20 μM U0126 during 24 h. Thereafter, cells were lyzed and mRNA analyzed with quantitative real-time PCR for expression of Axin2 and Lef1.
Figure 3
Figure 3
Attenuation of caMEK-driven morphological transformation of IECs occurs upon interference with the β-catenin/TCF4 complex. (a) Subconfluent IEC-6 wtMEK or caMEK cells stably expressing a dominant-negative form of TCF4 (ΔNTCF4) or the empty vector (EV) were transfected with 0.3 μg of the TOPFLASH/FOPFLASH reporter genes and c-myc/c-mut (4 × TBE2-wt/4 × TBE2-mut) luciferase reporters. Thirty-six hours after transfection, cells were lysed and luciferase activity was measured. The luciferase activity was calculated relative to the level observed in EV-expressing cells, which was set at 100%. Values were also normalized with Renilla-luciferase vector. Results are the mean±s.e. of at least three separate experiments. Significantly different from respective control at *P<0.05 or **P<0.01 (Student's t-test). (b) Equal amounts of lysates from IEC-6 wtMEK or caMEK cells stably expressing ΔNTCF4 or E.V. were separated by SDS–PAGE, and proteins analyzed by western blotting with specific antibodies against Tcf4, c-Myc, Fra-1, E-cadherin and total ERK2. (c) Representative phase-contrast microscopy images of IEC-6 caMEK expressing ΔNTCF4 or E.V. (as control). Bars: 50 μm. (d) Representative phase contrast microscopy images of IEC-6 caMEK that were treated or not with 7.5 μM ICG-001 during 36 h. Bars: 25 μm.
Figure 4
Figure 4
Expression of ΔNTCF4 inhibits proliferative, tumoral and invasive properties of cells transformed by activated MEK1. (a) IEC-6 caMEK cells stably expressing ΔNTCF4 or E.V. (as control) were seeded and the number of cells counted during 7 days. (b) IEC-6 caMEK cells stably expressing ΔNTCF4 or E.V. were cultured in soft agarose for 3 weeks before 3-(4,5-Dimethylthiazol-2-Yl)-2,5-Diphenyltetrazolium Bromide (MTT) staining. The number of colonies was calculated using the Image J software. (c) Invasion capacity of IEC-6 caMEK cells stably expressing ΔNTCF4 or E.V. through Matrigel was studied using Matrigel-coated Transwells during 48 h. Thereafter, cells were fixed and stained with 0.5% crystal violet solution. (d) Migration of IEC-6 caMEK cells stably expressing ΔNTCF4 or E.V. to the undersurface of the polycarbonate membrane of Boyden chambers was evaluated 24 h after seeding, in presence of 20 μM hydroxyurea. The number of cells in c, d was determined in 10 fields, the experiments performed in duplicate and the number of E.V.-expressing cells, which had migrated was set at 100%. Significantly different from respective control at ***P<0.001 (Student's t-test). (e) Tumor growth over time was measured after subcutaneous injection of 2 × 10⁶ of IEC-6 caMEK cells stably expressing ΔNTCF4 or E.V. The results represent the mean tumor volume obtained from at least six mice injected for each cell line. Independent experiments were performed twice. (f) Representative digital images of mouse lungs 21 days after tail vein injection of 106 IEC-6 caMEK cells expressing E.V. or ΔNTCF4. Similar results were obtained in two independent experiments.
Figure 5
Figure 5
Inhibition of MEK activity in human CRC cell lines significantly reduces β-catenin/TCF complex activity. (a) Subconfluent DLD-1 and HT-29 cells were transfected with 0.3 μg of the TOPFLASH/FOPFLASH luciferase reporter vectors. Twelve hours after transfection, cells were treated or not with 20 μM U0126 during 24 h after which luciferase activity was measured. The luciferase activity was calculated relative to the level observed in dimethylsulphoxide-treated cells, which was set at 1. The luciferase activity was also normalized with Renilla-luciferase vector. Results are the mean±s.e. of at least three separate experiments. Significantly different from untreated cells at *P<0.05; **P<0.01 or ***P<0.0001 (Student's t-test). (b, c) HT-29 and DLD-1 cells were treated or not with 20 μM U0126 during 16 h after which c-myc mRNA levels were evaluated using quantitative real-time PCR, whereas proteins were analyzed by western blotting with specific antibodies against c-MYC, β-catenin, E-cadherin, phosphorylated ERK1/2 and total ERK2. (d) HT-29 cells were treated during 16 h with 20 μM U0126. Thereafter, cells were fixed for immunofluorescence and stained for β-catenin protein (red) and DAPI (blue). (e, f) Cells were treated during 16 h with 20 μM U0126. Thereafter, 800 μg of cell lysates were immunoprecipitated with nontarget IgG (negative control), anti-TCF4 (e) or anti-E-cadherin (f) antibodies. Proteins from immunoprecipitates were solubilized in Laemmli's buffer, separated by 7.5% SDS–PAGE and analyzed by western blotting to determine β-catenin association. IP: immunoprecipitation.
Figure 6
Figure 6
LRP6 is phosphorylated in a MEK-dependent manner in human CRC cells and in IEC-6 expressing oncogenic KRAS, BRAF or MEK1. (a, b) DLD-1 and HT-29 cells were treated or not (DMSO) with 20 μM U0126 during 16 h and equal amounts of cell lysates were separated by SDS–PAGE. In a, proteins were analyzed by western blotting for expression of β-catenin phosphorylated on serine-552, tyrosine-86, tyrosine-654 and tyrosine-142 with phospho-specific antibodies. In addition, β-catenin unphosphorylated on serine-37 and threonine-41 was also analyzed by a specific antibody as well as phosphorylated ERK1/2 and total ERK2. In b, proteins were analyzed by western blotting for expression of total LRP6 and LRP6 phosphorylated on serine-1490 and threonine-1572 as well as phosphorylated ERK1/2 and total ERK2. (c) Equal amounts of lysates from IEC-6 pBABE, KRASG12V, wtMEK and caMEK expressing cells treated or not with 20 μM U0126 during 24 h were analyzed by western blotting for the expression of total ERK2, phosphorylated ERK1/2, total Lrp6 and Lrp6 phosphorylated on serine-1490 and threonine-1572. (d) IEC-6 BRAFV600EER cells were stimulated or not with 250 nM 4-OH tamoxifen in presence or absence of MEK inhibitors (20 μM U0126; 2 μM PD184352) at the indicated times. Proteins were analyzed by western blotting for the expression of total ERK2, phosphorylated ERK1/2, c-Myc, β-actin, total Lrp6 and Lrp6 phosphorylated on threonine-1572 or serine-1490. (e) Mucosal enrichments from 4-week-old BRafIEC-KO and control murine colons were analyzed by western blotting for the expression of phosphorylated ERK1/2 (pERK), ERK2, total Lrp6 and Lrp6 phosphorylated on threonine-1572 or serine-1490. Five mice per group were analyzed and representative western blot analysis of two mice per group is shown.
Figure 7
Figure 7
Oncogenic KRAS signaling triggers β-catenin/TCF4 complex activation via LRP6 phosphorylation. (a) IEC-6 KRASG12Vcells were co-transfected with 0.3 μg of luciferase TOPFLASH/FOPFLASH reporters and increasing concentrations of plasmids expressing or not (E.V., empty vector), wild-type LRP6 or LRP6-5A mutant. Twenty-four hours after transfection, cells were lysed and luciferase activity was measured. The increase in luciferase activity was calculated relative to the level observed in E.V.-expressing cells, which was set at 1. Values were also normalized with Renilla-luciferase vector. Results are the mean±s.e. of at least three separate experiments. (b) IEC-6 BRAFV600EER were co-transfected with 0.3 μg of luciferase TOPFLASH/FOPFLASH reporters and 0.4 μg of plasmids expressing or not (E.V., empty vector) wild-type LRP6 or LRP6-5A mutant. Twenty-four hours after transfection, cells were stimulated or not with 250 nM tamoxifen for an additional 24 h after which luciferase activity was measured as described in a. Significantly different from untreated cells at *P<0.05; **P<0.01 or ***P<0.0001 (Student's t-test). (c) caMEK-expressing cells were stably infected with lentiviruses encoding for a control shRNA (scrambled sequence, shControl) or encoding Lrp6-specific shRNAs (shLrp6A, B or C). After selection, stable table cell populations were lysed and protein lysates were analyzed by western blot for Lrp6 and β-actin protein expression. (d) Cell populations were cultured in soft agarose for 3 weeks before MTT staining. The number of colonies was determined using the ImageJ software. Results are the mean±s.e. of at least three independent experiments. ***, significantly different from shControl cells at P<0.05 (Student's t-test). ****P<0.005.
Figure 8
Figure 8
LRP6 phosphorylation on serine-1490 and threonine-1572 is increased in colorectal adenomas and adenocarcinomas. (a) Expression of total ERK2, LRP6 and phosphorylated LRP6 on serine-1490 and threonine-1572 was investigated by western blotting in seven paired colorectal adenomas (M: normal margins and A: adenomas). (b) Levels of phosphorylated LRP6 were normalized to the levels of total LRP6 levels in each tissue specimen. Tumor-relative phosphorylated/total LRP6 ratios were matched as reference to its normal samples (set at 1) resulting in a dimensionless value (arbitrary units (AU)). Analyzed by paired t-test and * indicates significantly different from normal margins at P⩽0.05. (c) Expression of LRP6 and phosphorylated LRP6 on serine-1490 and threonine-1572 was further investigated in a series of 53 paired specimens (M: resection margins and AC: primary adenocarcinomas) by western blot. Expression levels of phosphorylated LRP6 on serine 1490 and 1572 were normalized to the intensity β-actin expression and to a reference sample, resulting in a dimensionless value (AU). Densitometry of LRP6 phosphorylation in tumor tissues relative to their matched normal samples was analyzed by paired t-test. Significantly different from healthy resection margins **P⩽0.005 and ***P⩽0.001. (d) Representative immunoblot analysis of total LRP6 and LRP6 phosphorylated on threonine 1572 and serine 1490 performed on protein extracts from eight paired resection margins and advanced adenocarcinomas (AC). Tubulin expression is shown as a control of protein loading.

Similar articles

Cited by

References

    1. 1Fearon ER, Vogelstein B. A genetic model for colorectal tumorigenesis. Cell 1990; 61: 759–767. - PubMed
    1. 2Gregorieff A, Clevers H. Wnt signalling in the intestinal epithelium: from endoderm to cancer. Genes Dev 2005; 19: 877–890. - PubMed
    1. 3Taketo MM. Mouse models of gastrointestinal tumors. Cancer Sci 2006; 97: 355–361. - PMC - PubMed
    1. 4Ashton GH, Morton JP, Myant K, Phesse TJ, Ridgway RA, Marsh V et al. Focal adhesion kinase is required for intestinal regeneration and tumorigenesis downstream of Wnt/c-Myc signalling. Dev Cell 2010; 19: 259–269. - PMC - PubMed
    1. 5Sansom OJ, Meniel VS, Muncan V, Phesse TJ, Wilkins JA, Reed KR et al. Myc deletion rescues Apc deficiency in the small intestine. Nature 2007; 446: 676–679. - PubMed

Publication types

MeSH terms