

The landscape and therapeutic relevance of cancer-associated transcript fusions
- PMID: 25500544
- PMCID: PMC4468049
- DOI: 10.1038/onc.2014.406
The landscape and therapeutic relevance of cancer-associated transcript fusions
Abstract
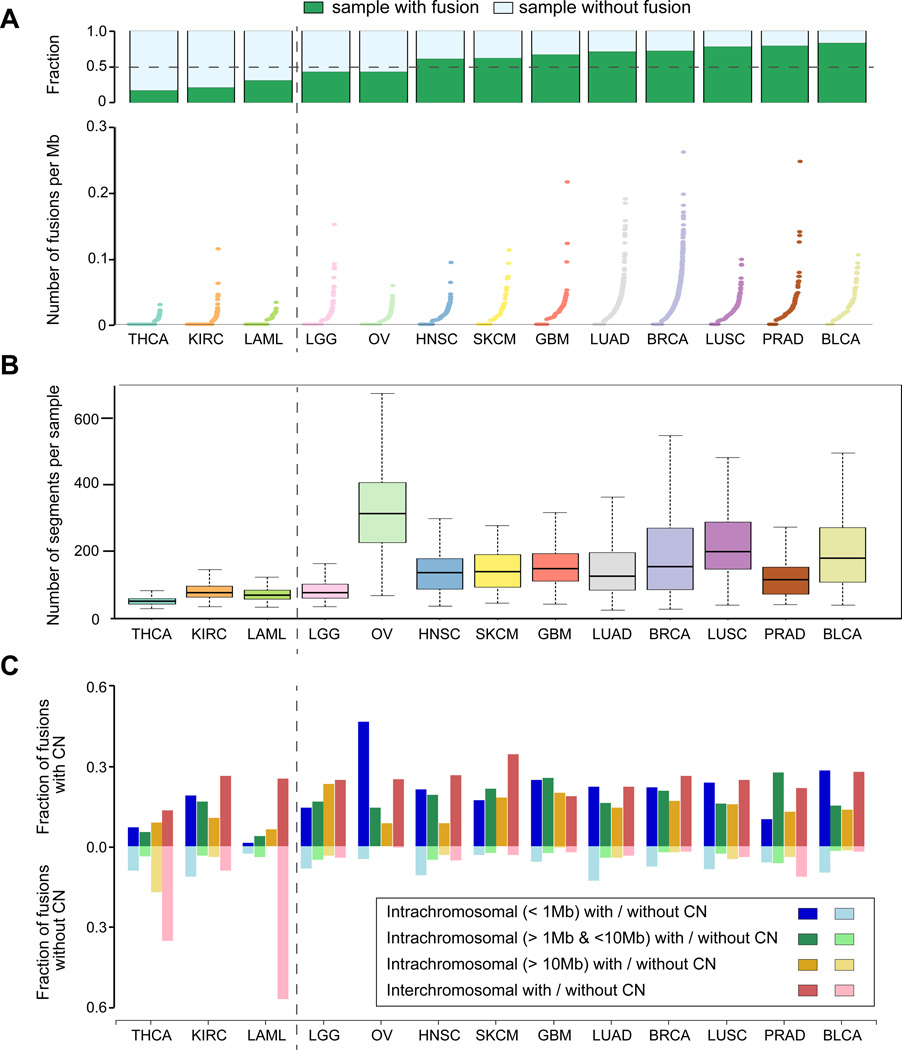
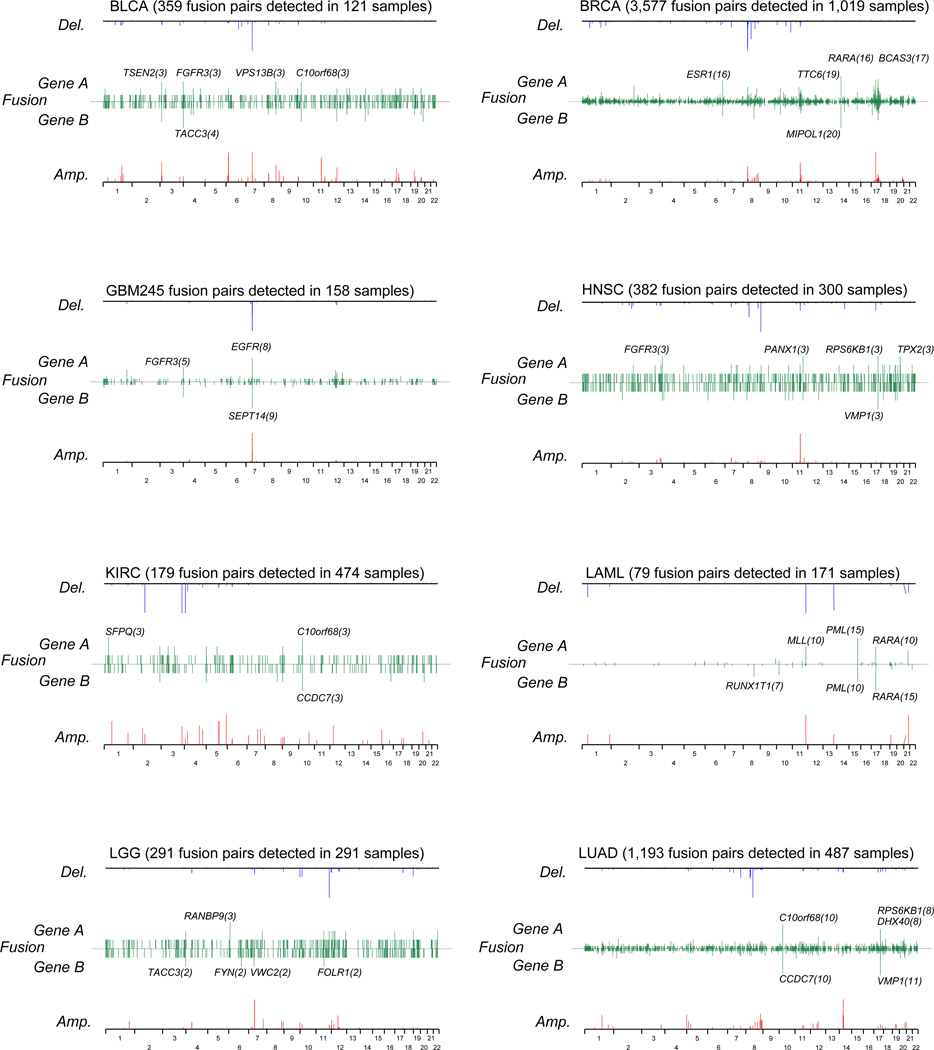
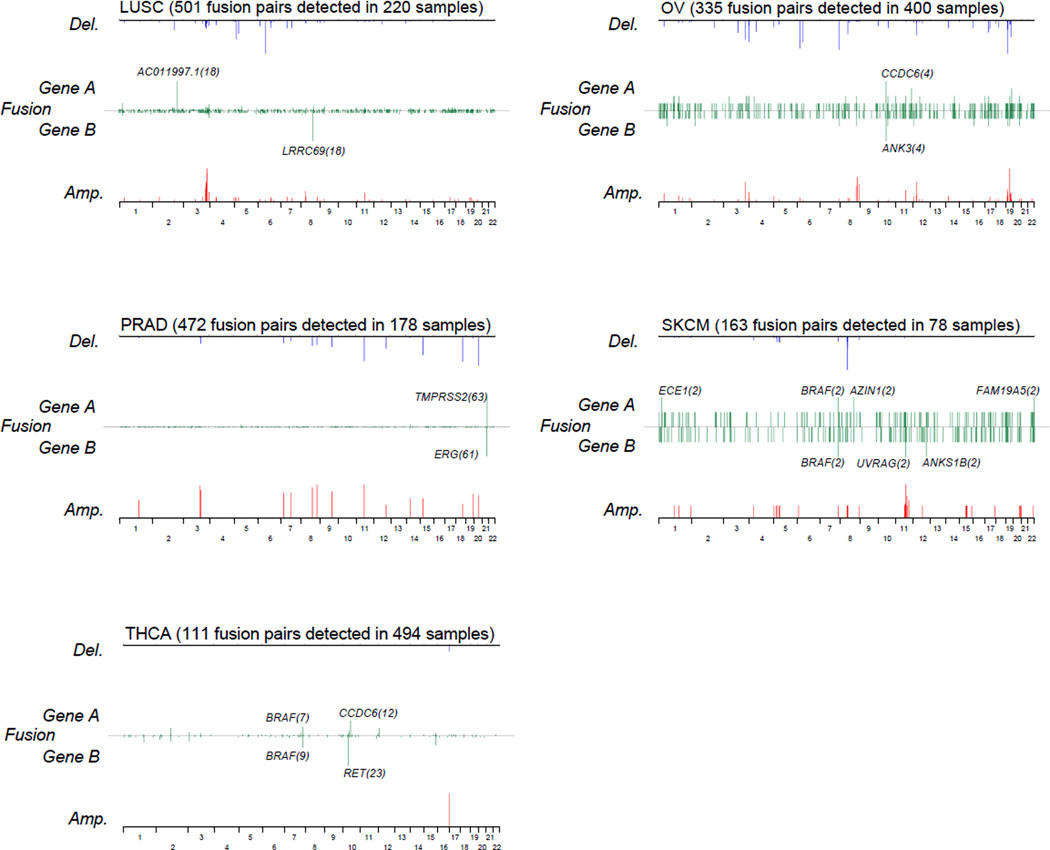
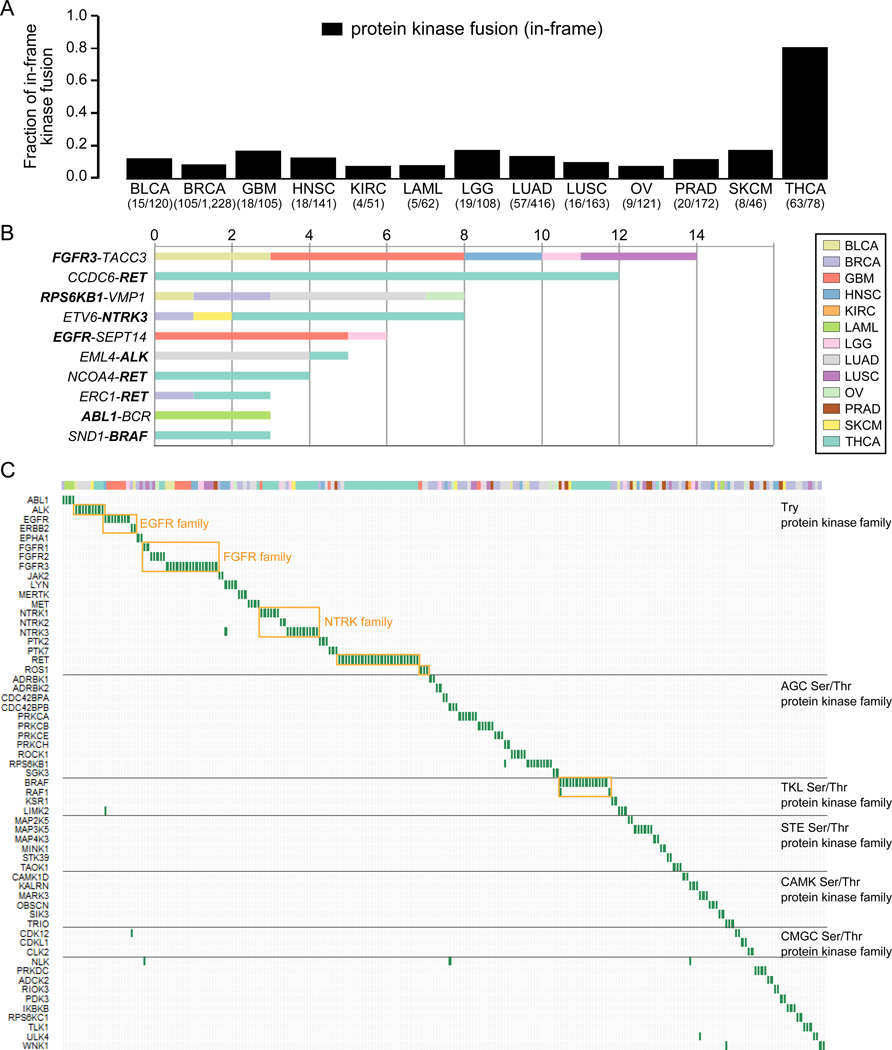
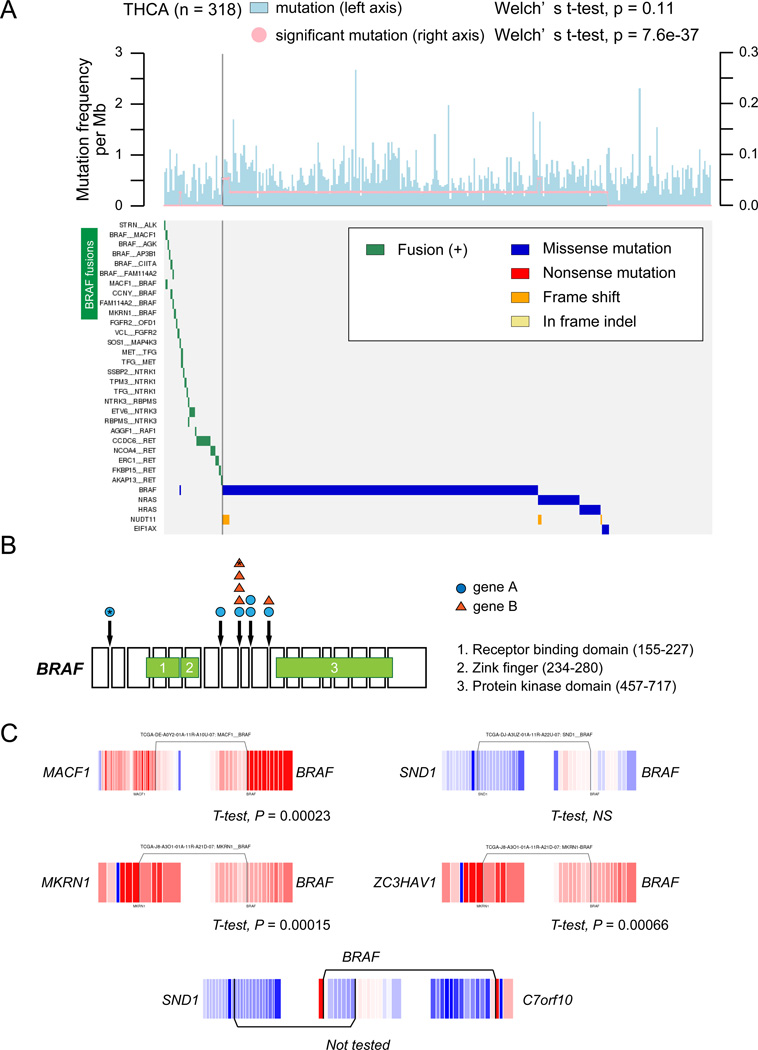
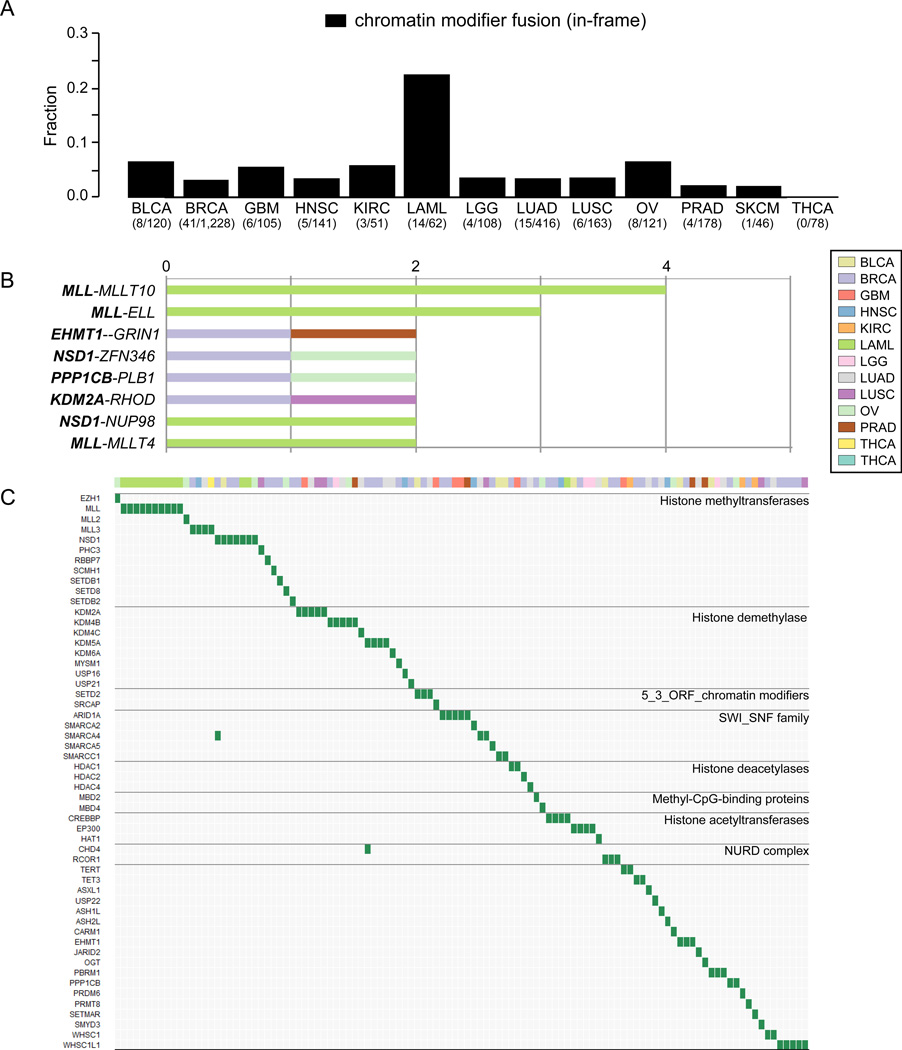
Transcript fusions as a result of chromosomal rearrangements have been a focus of attention in cancer as they provide attractive therapeutic targets. To identify novel fusion transcripts with the potential to be exploited therapeutically, we analyzed RNA sequencing, DNA copy number and gene mutation data from 4366 primary tumor samples. To avoid false positives, we implemented stringent quality criteria that included filtering of fusions detected in RNAseq data from 364 normal tissue samples. Our analysis identified 7887 high confidence fusion transcripts across 13 tumor types. Our fusion prediction was validated by evidence of a genomic rearrangement for 78 of 79 fusions in 48 glioma samples where whole-genome sequencing data were available. Cancers with higher levels of genomic instability showed a corresponding increase in fusion transcript frequency, whereas tumor samples harboring fusions contained statistically significantly fewer driver gene mutations, suggesting an important role for tumorigenesis. We identified at least one in-frame protein kinase fusion in 324 of 4366 samples (7.4%). Potentially druggable kinase fusions involving ALK, ROS, RET, NTRK and FGFR gene families were detected in bladder carcinoma (3.3%), glioblastoma (4.4%), head and neck cancer (1.0%), low-grade glioma (1.5%), lung adenocarcinoma (1.6%), lung squamous cell carcinoma (2.3%) and thyroid carcinoma (8.7%), suggesting a potential for application of kinase inhibitors across tumor types. In-frame fusion transcripts involving histone methyltransferase or histone demethylase genes were detected in 111 samples (2.5%) and may additionally be considered as therapeutic targets. In summary, we described the landscape of transcript fusions detected across a large number of tumor samples and revealed fusion events with clinical relevance that have not been previously recognized. Our results support the concept of basket clinical trials where patients are matched with experimental therapies based on their genomic profile rather than the tissue where the tumor originated.
Conflict of interest statement
The authors declare no conflict of interest.
Figures
References
-
- Mitelman F, Johansson B, Mertens F. The impact of translocations and gene fusions on cancer causation. Nat Rev Cancer. 2007;7:233–245. - PubMed
-
- Nowell PC, Hungerford DA. A minute chromosome in human chronic granulocytic leukemia. Science. 1960;132:1488–1501. - PubMed
-
- Kantarjian H, Shah NP, Hochhaus A, Cortes J, Shah S, Ayala M, et al. Dasatinib versus imatinib in newly diagnosed chronic-phase chronic myeloid leukemia. N Engl J Med. 2010;362:2260–2270. - PubMed
-
- Soda M, Choi YL, Enomoto M, Takada S, Yamashita Y, Ishikawa S, et al. Identification of the transforming EML4-ALK fusion gene in non-small-cell lung cancer. Nature. 2007;448:561–566. - PubMed
-
- Shaw AT, Kim DW, Nakagawa K, Seto T, Crino L, Ahn MJ, et al. Crizotinib versus chemotherapy in advanced ALK-positive lung cancer. N Engl J Med. 2013;368:2385–2394. - PubMed
Publication types
MeSH terms
Substances
Grants and funding
LinkOut - more resources
Full Text Sources
Other Literature Sources
