Review
. 2015 Jan;36(1):119-30.
doi: 10.1038/aps.2014.98. Epub 2014 Dec 15.

Sitagliptin protects rat kidneys from acute ischemia-reperfusion injury via upregulation of GLP-1 and GLP-1 receptors

Affiliations
Review

Sitagliptin protects rat kidneys from acute ischemia-reperfusion injury via upregulation of GLP-1 and GLP-1 receptors

Meng-wei Chang et al. Acta Pharmacol Sin. 2015 Jan.

Abstract

Aim: Sitagliptin, an oral glucose-lowering agent, has been found to produce cardiovascular protection possibly via anti-inflammatory and anti-atherosclerotic activities of glucagon-like peptide-1 receptor (GLP-1). The aim of this study was to investigate whether sitagliptin protected the kidney function from acute ischemia-reperfusion (IR) injury in rats.

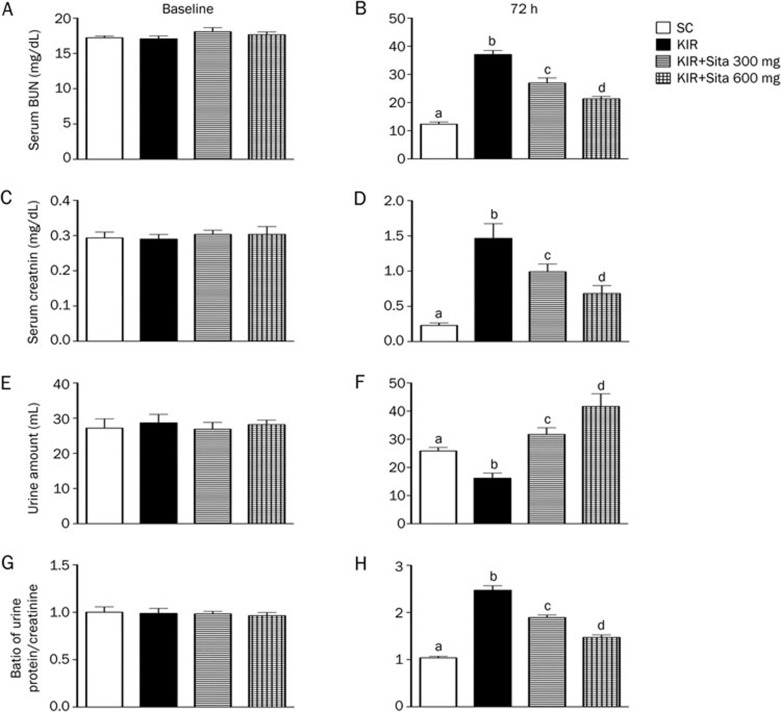
Methods: Adult male SD rats were categorized into 4 groups: sham control, IR injury, IR+sitagliptin (300 mg/kg) and IR+sitagliptin (600 mg/kg). Acute renal IR injury of both kidneys was induced by clamping the renal pedicles for 1 h. The drug was orally administered at 1, 24 and 48 h after acute IR. Blood samples and 24-h urine were collected before and at 72 h after acute IR. Then the rats were sacrificed, and the kidneys were harvested for biochemical and immunohistochemical studies.

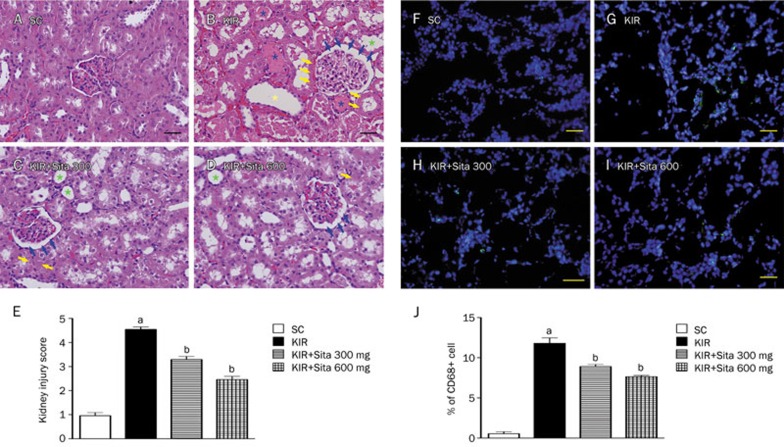
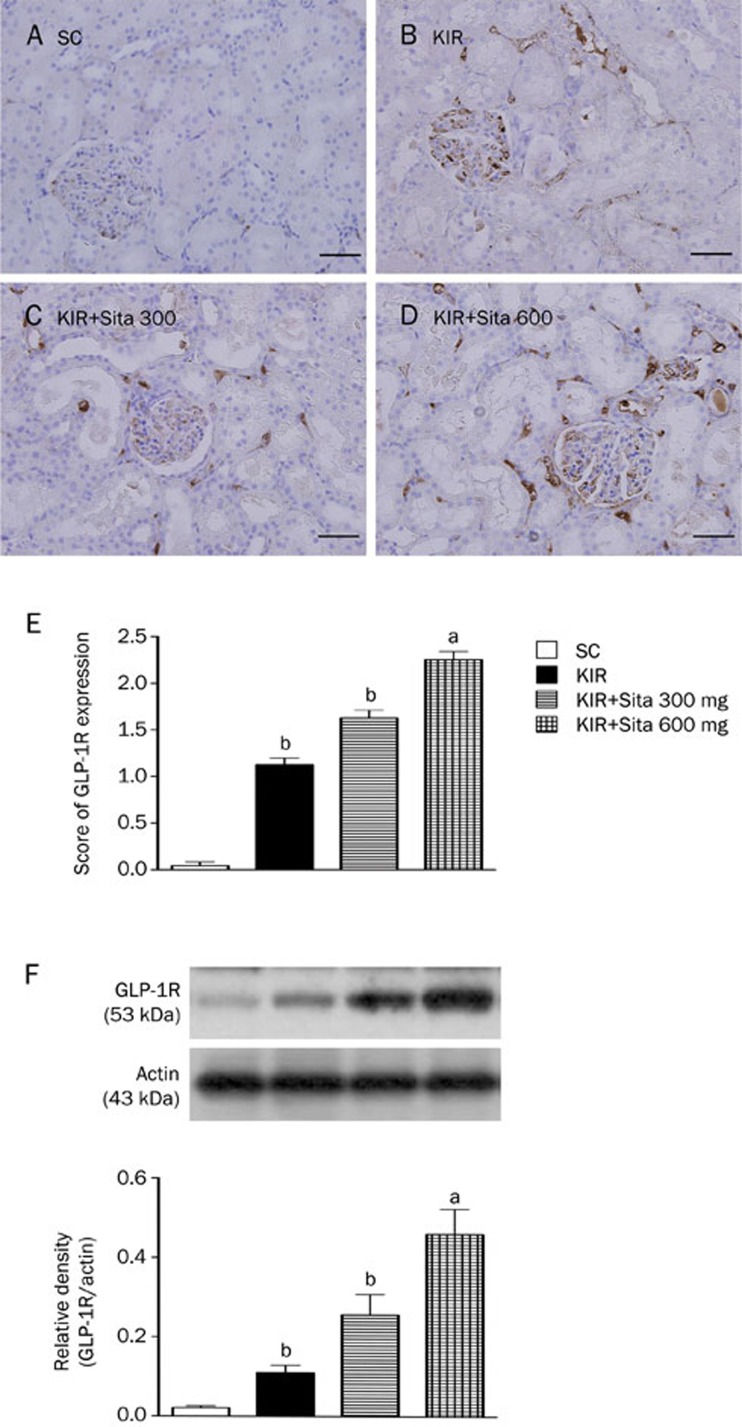
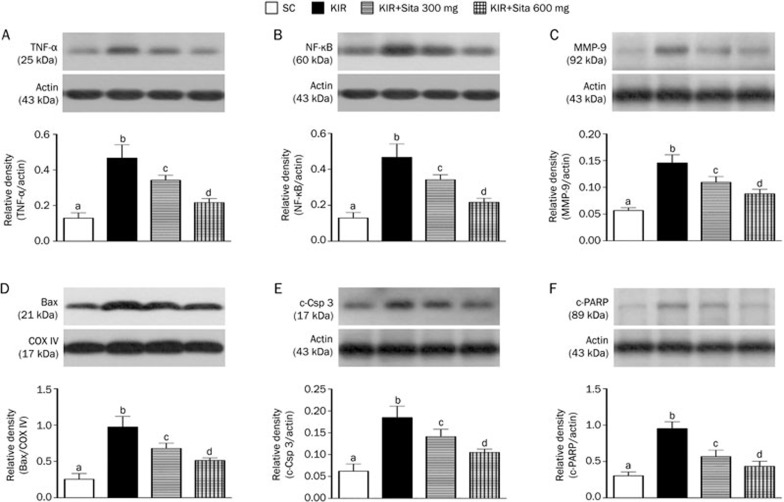
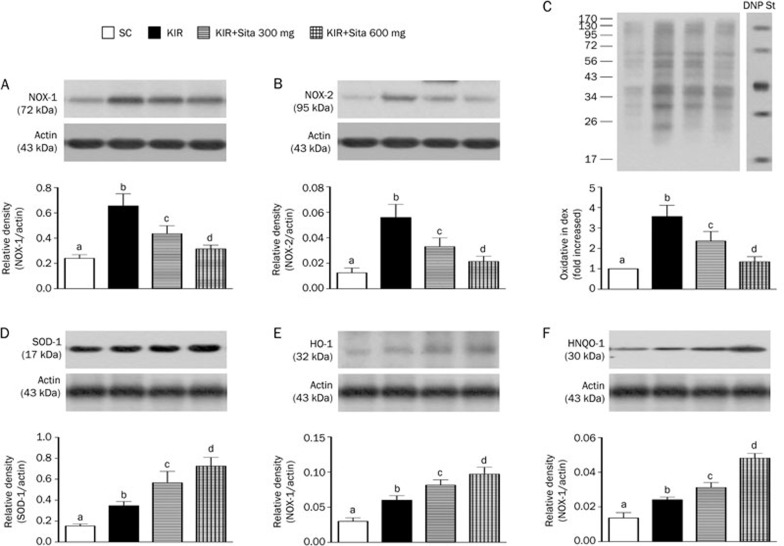
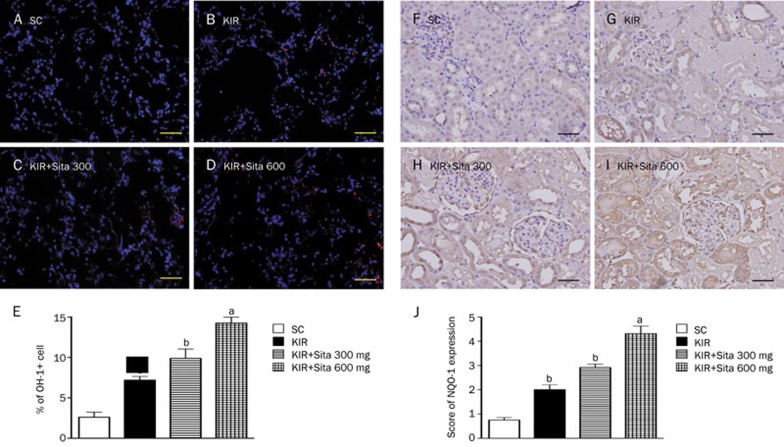
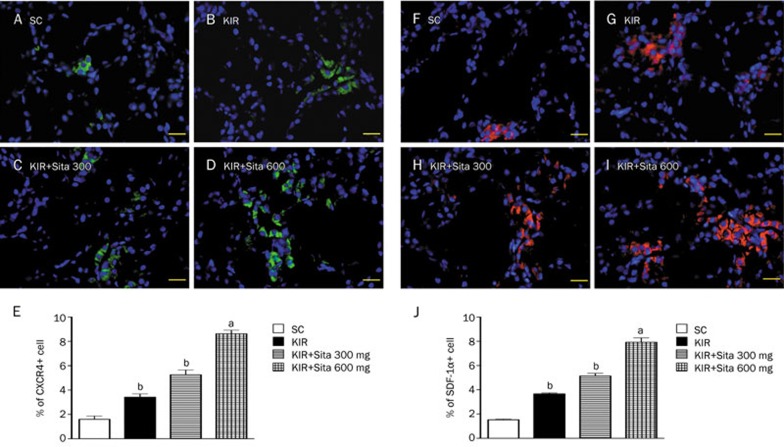
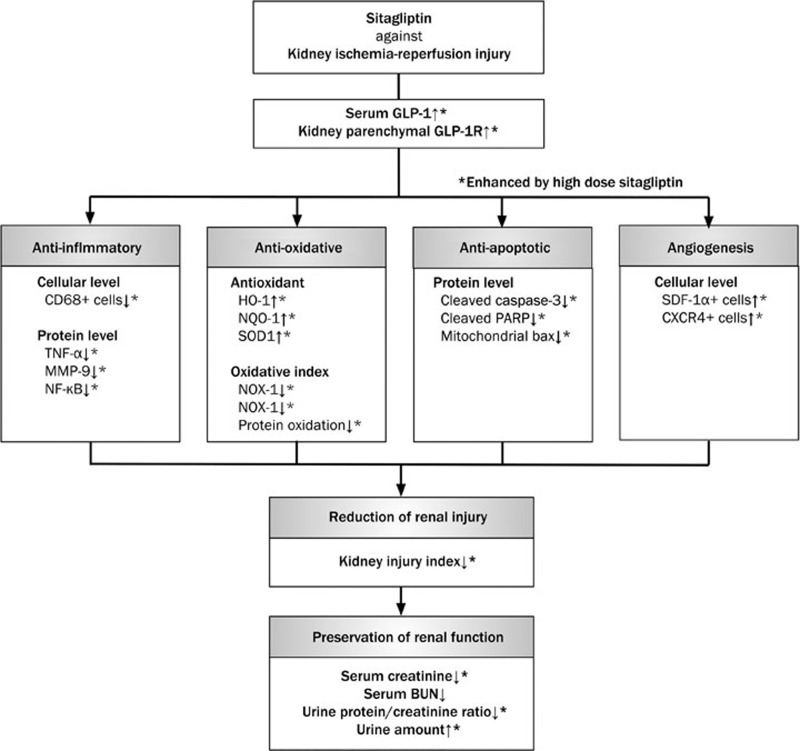
Results: Acute IR procedure markedly increased serum levels of creatinine and BUN and the ratio of urine protein to creatinine. The kidney injury score, inflammatory biomarkers (MMP-9, TNF-α and NF-κB) levels and CD68+ cells in IR kidneys were considerably increased. The expression of oxidized protein, reactive oxygen species (NOX-1, NOX-2) and apoptosis proteins (Bax, caspase-3, PARP) in IR kidneys was also significantly upregulated. All these pathological changes were suppressed by sitagliptin in a dose-dependent manner. Furthermore, the serum GLP-1 level, and the expression of GLP-1 receptor, anti-oxidant biomarkers (HO-1 and NQO-1 cells, as well as SOD-1, NQO-1 and HO-1 proteins), and angiogenesis markers (SDF-1α+ and CXCR4+ cells) in IR kidneys were significantly increased, and further upregulated by sitagliptin.

Conclusion: Sitagliptin dose-dependently protects rat kidneys from acute IR injury via upregulation of serum GLP-1 and GLP-1 receptor expression in kidneys.


Figures

Figure 1
Figure 1
Circulating level of glucagon-like peptide-1 (GLP-1) and expression of GLP-1R in kidney at 72 h after IR procedure (n=8 for each group). (A) Circulating GLP-1 level at baseline, P>0.05. (B) Circulating GLP-1 level at 72 h after acute kidney ischemia-reperfusion (IR) procedure: cP<0.01 vs sham control, bP=0.05 vs other groups. All statistical analyses using one-way ANOVA, followed by Bonferroni multiple comparison post hoc test. (C) Protein expression of GLP-1R in kidney at 72 h after acute IR procedure showing notably highest in kidney IR (KIR)+sitagliptin (Sita) 600 mg, lowest in sham control (SC), and notably higher in KIR+Sita 300 mg than in KIR only (n=2 in each group). (D) Microscopic (200×) findings of immunohistochemical (IHC) staining demonstrated that the GLP-1 receptor (GLP-1R) (brown color) in kidney at 72 h after acute IR procedure was notably highest in kidney IR (KIR)+sitagliptin (Sita) 600 mg, lowest in sham control (SC), and notably higher in KIR+Sita 300 mg than in KIR only. Scale bars in right lower corner represent 50 μm.
Figure 2
Figure 2
BUN and creatinine levels, and the ratio of urine protein to creatinine prior to and at 72 h after acute kidney IR injury (n=8 for each group). (A) Serum blood urea nitrogen (BUN) level prior to IR procedure (ie, at baseline), P>0.05. (B) Serum BUN level at 72 h after IR procedure, cP<0.01 vs other groups with different symbols. (C) Serum creatinine level prior to IR procedure, P>0.05. (D) Serum creatinine level at 72 h after IR procedure, cP<0.01 vs other groups with different symbols. (E) Urine amount prior to IR procedure, P>0.05. (F) Urine amount at 72 h after the procedure, cP<0.01 vs other groups with different symbols. (G) The ratio of urine protein to creatinine prior to IR procedure, P>0.05. (H) The ratio of urine protein to creatinine at 72 h after IR procedure, cP<0.01 vs other groups with different symbols. All statistical analyses using one-way ANOVA, followed by Bonferroni multiple comparison post hoc test. SC, sham control; KIR, kidney ischemia reperfusion; Sita, sitagliptin.
Figure 3
Figure 3
Histopathological scores and inflammatory cell infiltration in kidney at 72 h after IR injury (n=8 for each group). (A–D) H&E stain (200×) showing significantly higher degree of loss of brush border in renal tubules (green asterisk), cast formation (blue asterisk), tubular dilatation (yellow asterisk), tubular necrosis (yellow arrows), and dilatation of Bowman's capsule (blue arrows) in KIR only group than in other groups at 72 h (A–D) after IR procedure. (E) The analytical results of kidney injury score at 72 h after IR procedure: cP<0.01 vs sham control, bP=0.05 vs other groups. (F–I) IF microscopic findings (200×) showing the percentage of CD68+ cell infiltration (green signals) in kidney parenchyma among four groups at 72 h (F–I) after IR procedure. (J) The analytical results of CD68+ cells in kidney parenchyma at 72 h after IR procedure: cP<0.01 vs sham control, bP=0.05 vs other groups. All statistical analyses using one-way ANOVA, followed by Bonferroni multiple comparison post hoc test. Scale bars in right lower corner represent 50 μm. SC, sham control; KIR, kidney ischemia reperfusion; Sita, sitagliptin.
Figure 4
Figure 4
IHC findings and protein expression of glycogen-like peptide-1 receptor (GLP-1R) in kidney at 72 h after IR injury (n=8 for each group). (A–D) The IHC stain (200×) identifying the GLP-1R (brown color) in kidney parenchyma among four groups at 72 h (A–D) after IR procedure. (E) cP<0.01 vs sham control, bP=0.05 vs other groups. Scale bars in right lower corner represent 50 μm. (F) The protein expression of GLP-1R in kidney parenchyma among four group at 72 h after acute IR injury, cP<0.01 vs sham control, bP=0.05 vs other groups. All statistical analyses using one-way ANOVA, followed by Bonferroni multiple comparison post hoc test. SC, sham control; KIR, kidney ischemia reperfusion; Sita, sitagliptin.
Figure 5
Figure 5
Protein expressions of inflammatory and apoptotic biomarkers at 72 h after IR injury (n=8 for each group). (A) Analytical results of tumor necrosis factor TNF-α protein expression in kidney parenchyma at 72 h after IR procedure, cP<0.01 vs other groups. (B) Analytical results of nuclear factor NF-κB protein expression in kidney parenchyma at 72 h after IR procedure, cP<0.01 vs other groups. (C) Analytical results of matrix metalloproteinase (MMP)-9 protein expression in kidney parenchyma at 72 h after IR procedure, cP<0.01 vs other groups. (D) Analytical results of mitochondrial Bax protein expression in kidney parenchyma at 72 h after IR procedure, cP<0.01 vs other groups. (E) Analytical results of cleaved caspase 3 (c-CSP 3) protein expression in kidney parenchyma at 72 h after KIR procedure, cP<0.01 vs other groups. (F) Analytical results of cleaved PARP (c-PARP) protein expression in kidney parenchyma at 72 h after KIR procedure, cP<0.01 vs other groups. All statistical analyses using one-way ANOVA, followed by Bonferroni multiple comparison post hoc test. SC, sham control; KIR, kidney ischemia reperfusion; Sita, sitagliptin.
Figure 6
Figure 6
Protein expression of oxidative-stress, reactive oxygen species (ROS) and anti-oxidant biomarkers at 72 h after IR injury (n=8 for each group). (A) Protein expression of NOX-1 in kidney parenchyma at 72 h after IR procedure, cP<0.01 vs other groups. (B) Protein expression of NOX-2 in kidney parenchyma at 72 h after IR procedure, cP<0.01 vs other groups. (C) Oxidative stress (ie, oxidized protein) in kidney parenchyma at 72 h after IR procedure, cP<0.01 vs other groups. (D) The protein expression of superoxide dismutase 1 (SOD-1), cP<0.01 vs other groups. (E) The protein expression of heme oxygenase-1 (HO-1), cP<0.01 vs other groups. (F) The protein expression of NAD(P)H quinone oxidoreductase-1 (NQO-1), cP<0.01 vs other groups. All statistical analyses using one-way ANOVA, followed by Bonferroni multiple comparison post hoc test. SC, sham control; KIR, kidney ischemia reperfusion; Sita, sitagliptin.
Figure 7
Figure 7
IF and IHC staining of anti-oxidant cellular expressions at 72 h after IR injury (n=8 for each group). (A–D) IF microscopic findings (200×) showing the number of HO-1+cells in kidney parenchyma among four groups at 72 h after IR procedure. (E) The analytical results of HO-1+cells in kidney parenchyma at 72 h after IR procedure: cP<0.01 vs sham control, bP=0.05 vs other groups. (F–I) IHC staining of microscopic findings (200×) identifying the expression of NQO-1 cells in kidney parenchyma among four groups at 72 h after IR procedure. (J) The analytical results of NQO-1 cell expressions in kidney parenchyma at 72 h after IR procedure: cP<0.01 vs sham control, bP=0.05 vs other groups. Scale bars in right lower corner represent 50 μm. All statistical analyses were with one-way ANOVA followed by Bonferroni multiple comparison post hoc test. SC, sham control; KIR, kidney ischemia reperfusion; Sita, sitagliptin.
Figure 8
Figure 8
Angiogenesis cellular expression at 72 h after IR injury (n=8 for each group). (A–D) IF microscopic findings (200×) showing the number of CXCR4+cells in kidney parenchyma among four groups at 72 h after IR procedure. (E) The analytical results of CXCR4+ cells in kidney parenchyma at 72 h after IR procedure: cP<0.01 vs sham control, bP=0.05 vs other groups. (F–I) IF microscopic findings (200×) showing the number of stromal cell-derived factor SDF-1α+ cells in kidney parenchyma among four groups at 72 h after IR procedure. (J) The analytical results of SDF-1α+ cells in kidney parenchyma at 72 h after IR procedure: cP<0.01 vs sham control, bP=0.05 vs other groups. Scale bars in right lower corner represent 50 μm. All statistical analyses were with one-way ANOVA followed by Bonferroni multiple comparison post hoc test. SC, sham control; KIR, kidney ischemia reperfusion; Sita, sitagliptin.
Figure 9
Figure 9
Proposed mechanisms underlying the positive therapeutic effects of sitagliptin and exendin-4 on kidney ischemia-reperfusion (IR) injury. GLP-1R, glycogen-like peptide-1 receptor; TNF, tumor necrotic factor; MMP, matrix metalloproteinase; NF, nuclear factor; HO, heme oxygenase; NQO, NAD(P)H quinone oxidoreductase; GR, glutathione reductase; GPx, glutathione peroxidase; NOX, ADPH oxidase; SOD, superoxide dismutase; PARP, poly(ADP-ribose) polymerase; BUN, blood urine nitrogen.

References

    1. Jassal SV, Trpeski L, Zhu N, Fenton S, Hemmelgarn B. Changes in survival among elderly patients initiating dialysis from 1990 to 1999. CMAJ 2007; 177: 1033–8. - PMC - PubMed
    1. Coresh J, Selvin E, Stevens LA, Manzi J, Kusek JW, Eggers P, et al. Prevalence of chronic kidney disease in the United States. JAMA 2007; 298: 2038–47. - PubMed
    1. Stel VS, Kramer A, Zoccali C, Jager KJ. The 2006 ERA-EDTA Registry annual report: a precis. J Nephrol 2009; 22: 1–12. - PubMed
    1. Arogundade FA, Barsoum RS. CKD prevention in Sub-Saharan Africa: a call for governmental, nongovernmental, and community support. Am J Kidney Dis 2008; 51: 515–23. - PubMed
    1. Grassmann A, Gioberge S, Moeller S, Brown G. ESRD patients in 2004: global overview of patient numbers, treatment modalities and associated trends. Nephrol Dial Transplant 2005; 20: 2587–93. - PubMed

Publication types