. 2015 Jan;125(1):379-85.
doi: 10.1172/JCI75838. Epub 2014 Dec 15.

Targeting development of incretin-producing cells increases insulin secretion

Targeting development of incretin-producing cells increases insulin secretion

Natalia Petersen et al. J Clin Invest. 2015 Jan.

Abstract

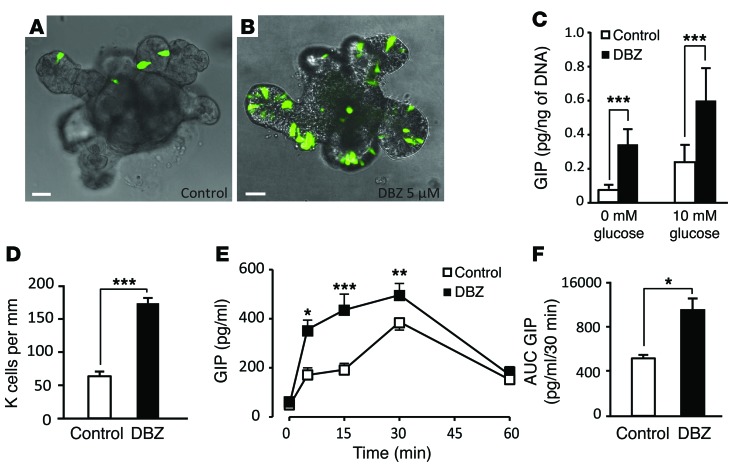
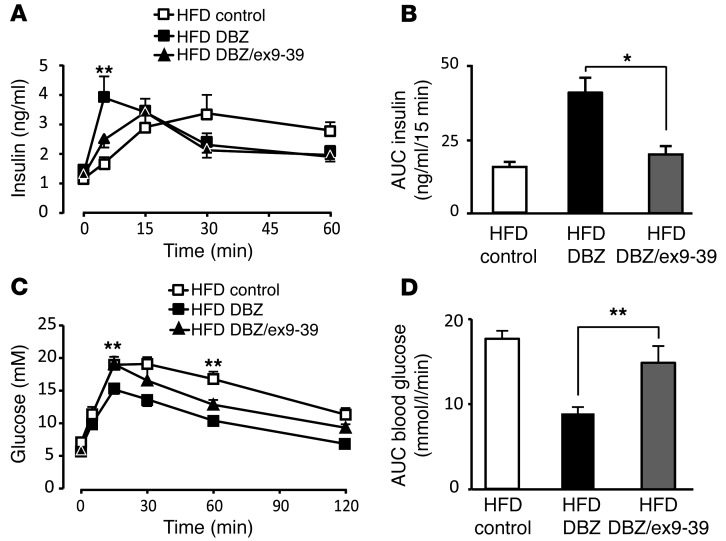
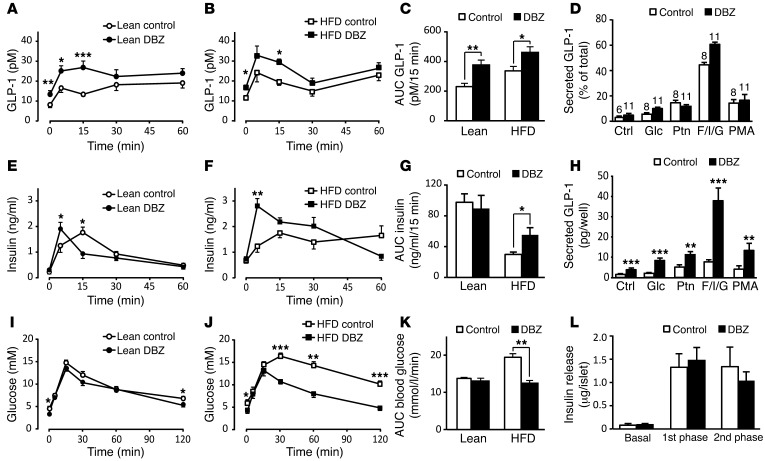
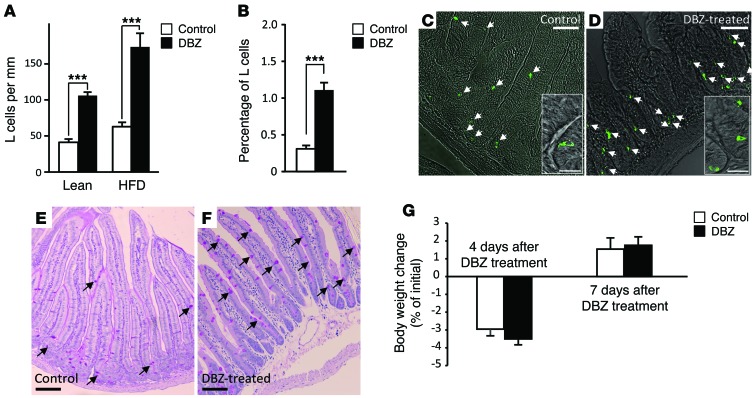
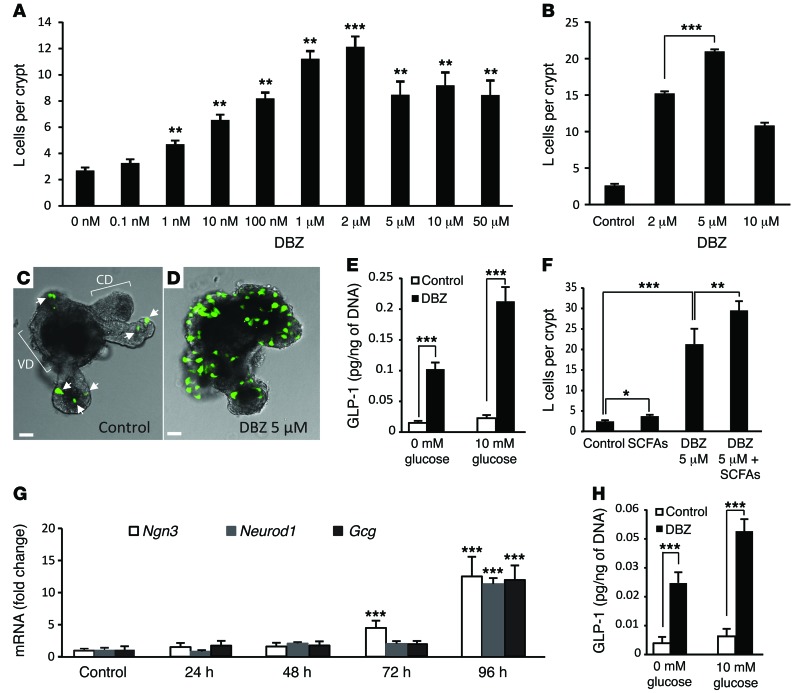
Glucagon-like peptide-1-based (GLP-1-based) therapies improve glycemic control in patients with type 2 diabetes. While these agents augment insulin secretion, they do not mimic the physiological meal-related rise and fall of GLP-1 concentrations. Here, we tested the hypothesis that increasing the number of intestinal L cells, which produce GLP-1, is an alternative strategy to augment insulin responses and improve glucose tolerance. Blocking the NOTCH signaling pathway with the γ-secretase inhibitor dibenzazepine increased the number of L cells in intestinal organoid-based mouse and human culture systems and augmented glucose-stimulated GLP-1 secretion. In a high-fat diet-fed mouse model of impaired glucose tolerance and type 2 diabetes, dibenzazepine administration increased L cell numbers in the intestine, improved the early insulin response to glucose, and restored glucose tolerance. Dibenzazepine also increased K cell numbers, resulting in increased gastric inhibitory polypeptide (GIP) secretion. Using a GLP-1 receptor antagonist, we determined that the insulinotropic effect of dibenzazepine was mediated through an increase in GLP-1 signaling. Together, our data indicate that modulation of the development of incretin-producing cells in the intestine has potential as a therapeutic strategy to improve glycemic control.


Figures

Figure 5
Figure 5. In vitro and in vivo K cell enrichment after DBZ treatment.
(A and B) K cells (green) in a representative mouse duodenal organoid before (A) and 96 hours after (B) a 3-hour pulse of 5 μM DBZ. Shown are maximum projections of a z stack through the organoid. Images are representative of 100 organoids per series from 2 platings. Scale bars: 20 μm. (C) Basal and glucose-stimulated GIP secretion in control organoids and 96 hours after a 3-hour pulse of 5 μM DBZ. n = 8 per series from 2 platings. (D) K cell numbers in the duodenum of HFD-fed mice treated with vehicle or DBZ (2× 10 mg/kg regimen). Data were obtained from microscopy of 6 transverse sections from 3 HFD-fed mice per series. (E) GIP concentrations during OGTT in control and DBZ-treated HFD-fed mice. n = 6 (control); 7 (DBZ). (F) AUC for GIP release (0–30 minutes). (CF) *P < 0.05, **P < 0.01, ***P < 0.001, nonpaired 2-tailed Student’s t test.
Figure 4
Figure 4. Blockade of the GLP-1 receptor modulates the effect of DBZ on insulin secretion and glucose tolerance.
HFD-fed mice, treated or not with DBZ and/or exendin 9-39 (ex9-39), were subjected to OGTT. (A) Plasma insulin concentrations. (B) AUC insulin (0–15 minutes). (C) Blood glucose concentrations. (D) AUC glucose (0–120 minutes). n = 6 (HFD control and HFD DBZ); 7 (HFD DBZ plus exendin 9-39). *P < 0.05, **P < 0.01, 1-way ANOVA with Bonferroni test.
Figure 3
Figure 3. GLP-1 and insulin secretion and glucose tolerance after DBZ treatment.
(AC) Plasma GLP-1 concentration during OGTT (A and B) and area under curve (AUC) for GLP-1 release (0–15 minutes; C) in lean and HFD-fed mice. n = 12 (lean control); 10 (lean DBZ); 6 (HFD control); 8 (HFD DBZ). (D) GLP-1 release, expressed as percent total GLP-1 content, in response to vehicle control (Ctrl); 10 mM glucose (Glc); 0.5% peptone (Ptn); 10 μM forskolin, 10 μM IBMX, and 10 mM glucose combined (F/I/G); or 1 μM phorbol myristate acetate (PMA) in mouse intestinal cultures. n = 2 (control); 3 (DBZ). Number of cultures is indicated for each group. (EG) Insulin response during OGTT (E and F) and AUC (0–15 minutes; G) in lean and HFD-fed mice. n = 10 (lean control); 8 (lean DBZ); 6 (HFD control and DBZ). (H) Absolute GLP-1 secretion per well in response to various stimuli in intestinal cultures (treatments and number of cultures as in D). n = 2 (control); 3 (DBZ). (IK) Blood glucose concentrations during OGTT (I and J) and AUC (0–120 minutes; K) in lean and HFD-fed mice. n = 11 (lean control); 13 (lean DBZ); 6 (HFD control and DBZ). (L) Basal (3 mM glucose) or stimulated (20 mM glucose; 2 phases shown) insulin release in isolated mouse islets. n = 8 islet batches per group (2 mice per treatment). *P < 0.05, **P < 0.01, ***P < 0.001, nonpaired 2-tailed Student’s t test (AC, EG, and IL) or 1-way ANOVA with Bonferroni test (D and H).
Figure 2
Figure 2. In vivo L cell enrichment by the 2× 10 mg/kg DBZ regimen.
(A) L cell numbers in lean and HFD-fed mouse ileum. L cells were identified by GLP-1 staining and counted; results are expressed as number of cells per millimeter of mucosal lining. Data are from microscopy of 6 transverse sections per series from 3 lean and 4 HFD-fed mice. (B) L cell numbers, determined by FACS analysis, in combined lean mouse jejunum and ileum. n = 3 samples each (control and DBZ); each sample was pooled from 2 mice. (A and B) ***P < 0.001, nonpaired 2-tailed Student’s t test. (C and D) Immunostaining for GLP-1 (green) in the small intestine of a lean mouse. Arrows denote L cells (also shown at higher magnification in the insets). (E and F) Periodic acid–Schiff (PAS) staining for goblet cells (arrows) in the small intestine. (G) Body weight change in control and DBZ-treated mice after overnight fasting for OGTT. Initial body weight in nonfasted mice before treatment was assigned as 0. n = 12 (control); 10 (DBZ). Nonpaired 2-tailed Student’s t test. (CF) Images are representative of 6 transverse sections per series (vehicle and DBZ). Scale bars: 100 μm; 20 μm (insets).
Figure 1
Figure 1. L cell enrichment in intestinal organoids by the NOTCH inhibitor DBZ.
(A) L cell numbers in mouse ileum organoids after 96 hours of continuous exposure to different DBZ concentrations. (B) L cell numbers in mouse organoids 96 hours after a 3-hour DBZ pulse. (C and D) L cells (green) in a representative Glu-Venus mouse organoid before (C) and 96 hours after (D) a 3-hour pulse of 5 μM DBZ. Shown are maximum projections of a z stack through the organoid. VD, villus domain, CD, crypt domain. Arrows denote L cells. Scale bars: 20 μm. (AD) n = 100 crypts (3 platings) per series. (E) Baseline and glucose-stimulated GLP-1 secretion in mouse ileum organoids 96 hours after a 3-hour pulse of 5 μM DBZ. n = 7 per series from 2 platings. (F) L cell numbers 96 hours after continuous treatment with SCFAs (combined 5 mM acetate, 1 mM propionate, and 1 mM butyrate), 5-μM DBZ pulse, or both. n = 100 crypts (3 platings) per series. (G) Gene expression of Ngn3, Neurod1, and Gcg in organoids at the indicated time points after a 5-μM DBZ pulse. n = 4–6 samples from 3 platings. (H) Baseline and glucose-stimulated GLP-1 secretion in human ileum organoids 96 hours after a 3-hour pulse of 5 μM DBZ. n = 6 per series from 2 platings. *P < 0.05, **P < 0.01, ***P < 0.001 vs. control or as indicated by brackets, 1-way ANOVA with Bonferroni test (AD and F) or nonpaired 2-tailed Student’s t test (E, G, and H).

Comment in

References

    1. Holst JJ, Deacon C, Toft-Nielsen MB, Bjerre-Knudsen L. On the treatment of diabetes mellitus with glucagon-like peptide-1. Ann N Y Acad Sci. 1998;865:336–343. doi: 10.1111/j.1749-6632.1998.tb11193.x. - DOI - PubMed
    1. Holst JJ, Gromada J. Role of incretin hormones in the regulation of insulin secretion in diabetic and nondiabetic humans. Am J Physiol Endocrinol Metab. 2004;287(2):E199–E206. doi: 10.1152/ajpendo.00545.2003. - DOI - PubMed
    1. Knop FK, Vilsbøll T, Holst JJ. Incretin-based therapy of type 2 diabetes mellitus. Curr Protein Pept Sci. 2009;10(1):46–55. doi: 10.2174/138920309787315158. - DOI - PubMed
    1. van der Flier LG, Clevers H. Stem cells, self-renewal, and differentiation in the intestinal epithelium. Annu Rev Physiol. 2009;71:241–260. doi: 10.1146/annurev.physiol.010908.163145. - DOI - PubMed
    1. Stanger BZ, Datar R, Murtaugh LC, Melton DA. Direct regulation of intestinal fate by Notch. Proc Natl Acad Sci U S A. 2005;102(35):12443–12448. doi: 10.1073/pnas.0505690102. - DOI - PMC - PubMed

Publication types