. 2015 Jan;18(1):104-11.
doi: 10.1038/nn.3897. Epub 2014 Dec 15.

ErbB4 regulation of a thalamic reticular nucleus circuit for sensory selection

Affiliations

ErbB4 regulation of a thalamic reticular nucleus circuit for sensory selection

Sandra Ahrens et al. Nat Neurosci. 2015 Jan.

Abstract

Selective processing of behaviorally relevant sensory inputs against irrelevant ones is a fundamental cognitive function whose impairment has been implicated in major psychiatric disorders. It is known that the thalamic reticular nucleus (TRN) gates sensory information en route to the cortex, but the underlying mechanisms remain unclear. Here we show in mice that deficiency of the Erbb4 gene in somatostatin-expressing TRN neurons markedly alters behaviors that are dependent on sensory selection. Whereas the performance of the Erbb4-deficient mice in identifying targets from distractors was improved, their ability to switch attention between conflicting sensory cues was impaired. These behavioral changes were mediated by an enhanced cortical drive onto the TRN that promotes the TRN-mediated cortical feedback inhibition of thalamic neurons. Our results uncover a previously unknown role of ErbB4 in regulating cortico-TRN-thalamic circuit function. We propose that ErbB4 sets the sensitivity of the TRN to cortical inputs at levels that can support sensory selection while allowing behavioral flexibility.


Conflict of interest statement

The authors declare no competing financial interests.

Figures
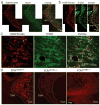
Figure 1
Figure 1. SOM+ neurons are a major TRN population expressing ErbB4
(a) Left: a representative image of a coronal TRN section from a Som-Cre;Ai14 mouse. SOM+ neurons were identified on the basis of the intrinsic fluorescence of tdTomato (SOM/Tomato). Middle: the same brain section was processed for immunohistochemistry with an antibody recognizing NeuN to label all the neurons. Right: overlay; 79.89 ± 2.37% (n = 2 mice) of TRN neurons are SOM+. The border of TRN is outlined. (b) Representative images of TRN from a Som-Cre;Ai14 mouse. Left: SOM+ TRN neurons expressed tdTomato; middle: ErbB4 was recognized by an antibody. (c) High magnification images of neurons in the TRN, showing that tdTomato (red) and ErbB4 (green) are co-expressed in the same cells (overlay). Arrow denotes a SOM+ neuron that had ErbB4 staining in the soma. Arrowhead denotes a SOM neuron that had no ErbB4 staining in the soma but was surrounded by fibers (presumably from other neurons) that had ErbB4 staining. ~100% of SOM+ TRN neurons were recognized by the ErbB4 antibody (n = 3 mice). (d) Representative images of ErbB4 expression recognized by an antibody. Left and middle: ErbB4 was expressed in TRN neurons in a SOMErbB4+/+ (WT) mouse (left), but not in a SOMErbB4−/− (KO) mouse (middle). Right: ErbB4 expression appeared normal in the hippocampus (Hipp) of the same KO mouse. Similar results were obtained in 3 WT and 3 KO mice.
Figure 2
Figure 2. Behavioral tasks that assess sensory selection
(a & b), The basic 2-alternative choice (AC) tasks. (a) Auditory task: mice initiated each trial by a nose poke into the center port of the operant chamber. After a variable (200–300 ms) silent period, a frequency-modulated target sound was presented. Mice were required to stay in the port until the onset of the sound. The center frequency of the target sound (8 kHz or 20 kHz) indicated the side port where water reward would be delivered (left or right, respectively). Mice were only rewarded in trials in which they chose the correct port as their first response. (b) Visual task: same as in a, except that a nose poke into the center port turned on a light on the same side where water reward would be delivered (left or right). (c) After learning the basic auditory 2-AC task (see a), mice were tested in an “auditory/auditory” paradigm. As in the basic 2-AC task, mice initiated a trial by a nose poke into the center port. After a silent delay of 50 ms, a train of five 100-ms pure tone distractors was presented. The frequency of each of the five distractor tones in the train was 5, 8, 12.5, 16 and 20 kHz, and the order in which the tones were presented was random for each trial. In each trial, one of the frequency-modulated target sounds (denoted as a waveform in red), which indicated reward at one of the side ports (see a), was presented and immersed in the train of distractor tones (note that the frequency-modulated target sounds are qualitatively different from the pure tone distractors – see Methods). The position of the target in a train was randomized between 100 and 300 ms after the onset of the first distracter tone. Mice were required to stay in the port until the target was presented. (d) After learning both the auditory and the visual basic 2-AC tasks, mice were tested in a “visual/auditory” paradigm in which, after the nose poke into the center port, a light cue and one of the target sounds (8 kHz or 20 kHz) were simultaneously presented. However, only the light predicted reward, and the sound was random in relation to the reward. In order to obtain the reward, the mice had to attend to the light and ignore the sound. Congruent (top) and incongruent (bottom) trials occurred at the same frequency and were randomized. (e) The WT, HET, or KO mice had similar performance in the basic auditory (left) and visual (right) 2-AC tasks (auditory: WT, 85.87 ± 0.88%, n = 33 mice, HET, 86.59 ± 0.74%, n = 28 mice, KO, 86.03 ± 0.85%, n = 30 mice, F(2,88) = 0.20, P = 0.82, one-way analysis of variance (ANOVA); visual: WT, 89.9 ± 0.87%, n = 24 mice, HET, 88.47 ± 0.86%, n = 22 mice, KO, 89.95 ± 0.79%, n = 20 mice, F(2,63) = 0.97, P = 0.38; one-way ANOVA). Data are presented as mean ± s.e.m.
Figure 3
Figure 3. ErbB4 deficiency in SOM+ TRN neurons affects sensory selection
(ac), behavioral phenotypes of WT, HET, and KO mice. (a) Reducing ErbB4 levels in SOM+ neurons improved performance in the auditory/auditory task (WT n = 16 mice, HET n = 13 mice, KO n = 14 mice; F(2,40) = 11.06; KO compared with WT: session 1, *P = 0.025, session 2, ***P = 0.0008, session 3, ***P = 0.0006; HET compared with WT: session 1, **P = 0.0044, session 2, **P = 0.0048, session 3, **P = 0.0014; Two-way repeated measures (RM) ANOVA followed by Tukey’s tests). (b & c) Reducing ErbB4 levels in SOM+ neurons impaired performance in the incongruent trials (b) (WT n = 16 mice, HET n = 11 mice, KO n = 14 mice; F(2,38) = 11.38; KO compared with WT: session 1, **P = 0.005, session 2, ***P = 0.0004, session 3, ***P = 0.0004, session 4, ***P = 0.0008, session 5, ****P < 0.0001; KO compared with HET: session 1, P = 0.01, session 2, P = 0.017, session 3, P = 0.036, session 4, P = 0.016, session 5, P = 0.011; Two-way RM ANOVA followed by Tukey’s tests), but not in the congruent trials (c) (F(2,38) = 0.40; P = 0.67, Two-way RM ANOVA), of the visual/auditory task. (df), behavioral phenotypes of mice in which ErbB4 is selectively deleted in the TRN. “TRN KO”, Som-Flp;Erbb4lox/lox mice in which the TRN was injected with a Flp-dependent AAV expressing Cre-GFP, so as to delete ErbB4 in SOM+ TRN neurons; “Control”, Som-Flp;Erbb4lox/lox mice in which the TRN was injected with a Flp-dependent AAV expressing GFP. (d) Selective deletion of ErbB4 in SOM+ TRN neurons improved performance in the auditory/auditory task (Control, n = 7 mice, TRN KO, n = 7 mice, F(1,12) = 31.69; session 1, ****P < 0.0001, session 2, ****P < 0.0001, session 3, ***P = 0.0004; Two-way repeated measures (RM) ANOVA followed by Bonferroni tests). (e & f) Selective deletion of ErbB4 in SOM+ TRN neurons impaired performance in the incongruent trials (e) (Control, n = 7 mice, TRN KO, n = 7 mice, F(1,12) = 21.46; session 1, ***P = 0.0001, session 2, **P = 0.006, session 3, **P = 0.001, session 4, **P = 0.002, session 5, *P = 0.013, Two-way RM ANOVA followed by Bonferroni tests), but not in the congruent trials (f) (F(1,12) = 0.06; P = 0.81, Two-way RM ANOVA), of the visual/auditory task. Data are presented as mean ± s.e.m.
Figure 4
Figure 4. ErbB4 deficiency in SOM+ TRN neurons enhances excitatory synaptic transmission onto these neurons
(a) A schematic of the paired-recording configuration. In red is a SOM+ TRN neuron. (b) Left: representative EPSC traces recorded from SOM/SOM+ neuronal pairs in the TRN in WT, HET, and KO mice. Calibrations: 20 pA and 50 ms. Right, top panel: quantification of AMPAR-mediated EPSC amplitude, which was normalized to the mean EPSC amplitude of SOM neurons (WT: SOM, 1 ± 0.18, SOM+, 0.33 ± 0.07, n = 10 pairs (7 mice), DF = 9, T = 3.20, *P = 0.011, paired t-test; HET: SOM, 1 ± 0.19, SOM+, 3.48 ± 0.82, n = 7 pairs (5 mice), DF = 6, T = 2.71, *P = 0.035, paired t-test; KO: SOM, 1 ± 0.16, SOM+, 4.92 ± 0.88, n = 9 pairs (5 mice), DF = 8, T = 4.35, **P = 0.0024, paired t-test). Bottom panel: quantification of NMDAR-mediated EPSC amplitude, which was normalized to the mean EPSC amplitude of SOM neurons (WT: SOM, 1 ± 0.18, SOM+, 0.71 ± 0.22, n = 4 pairs (4 mice), DF = 3, T = 2.47, P = 0.09, paired t-test; HET: SOM, 1 ± 0.37, SOM+, 3.34 ± 0.66, n = 4 pairs (3 mice), DF = 3, T = 5.46, *P = 0.012, paired t-test; KO: SOM, 1 ± 0.52, SOM+, 5.48 ± 1.16, n = 5 pairs (4 mice); DF = 4, T = 3.40, *P = 0.027, paired t-test). Data are presented as mean ± s.e.m.
Figure 5
Figure 5. ErbB4 deficiency in SOM+ TRN neurons selectively enhances cortical drive onto TRN
(a) Left: a schematic of the recording configuration. The CT-TRN pathway is selectively stimulated by photo-activation of ChR2 (green), and EPSCs are recorded from SOM+ TRN neurons (red). Right: an image of a brain slice used in the recording. The slice was prepared from a SOM-Cre;Ai14 mouse in which the AAV-CAG-ChR2(H134R)-YFP was injected into the primary somatosensory cortex (arrow). (b) Same as in a, except that the TC-TRN pathway was selectively stimulated, and the AAV-CAG-ChR2(H134R)-YFP was injected into the ventrobasal complex of the thalamus (arrow). (c) Representative emEPSC traces recorded from SOM+ TRN neurons in response to the photo-stimulation (blue bars) of either the CT-TRN (top row) or the TC-TRN (bottom row) pathway, using the minimal photo-stimulation protocol. Calibrations: 20 pA and 2 ms. (d) Left: quantification of the amplitude of emEPSCs driven by the CT-TRN pathway (WT: 25.81 ± 7.35 pA, n = 7 cells (2 mice); HET: 55.45 ± 5.91 pA, n = 10 cells (3 mice); KO: 77.92 ± 6.07 pA, n = 8 cells (3 mice); F(2,22) = 20.23, *P = 0.018, ** P = 0.0027, ****P < 0.0001, one-way ANOVA followed by Tukey’s test). Right: quantification of the amplitude of emEPSCs driven by the TC-TRN pathway (WT: 106.8 ± 10.41 pA, n = 10 cells (3 mice); HET: 122.8 ± 17.74 pA, n = 9 cells (2 mice); KO: 129.9 ± 14.53 pA, n = 11 cells (3 mice); F(2,27) = 0.70, P = 0.5, one-way ANOVA). (e) A schematic of the recording configuration, in which both the CT axons and their collaterals to TRN were photo-stimulated, and the synaptic responses were recorded from neurons in the thalamus. (f) Left: representative synaptic response traces recorded from thalamic neurons in response to photo-stimulation (blue bars) of the CT pathway. EPSCs and IPSCs in each neuron evoked by the same stimulation were recorded at the reversal potential of inhibitory and excitatory synaptic currents, respectively. Calibrations: 50 pA and 100 ms. Right: quantification of the ratio of inhibitory to excitatory charge transfer (I/E) (WT: 0.88 ± 0.15, n = 9 cells (3 mice); HET: 5.88 ± 0.79, n = 16 cells (3 mice); KO: 8.87 ± 0.91, n = 16 cells (3 mice); F(2,38) = 19.70, *P = 0.023, ***P = 0.001, ****P < 0.0001, one-way ANOVA followed by Tukey’s test). Data are presented as mean ± s.e.m.
Figure 6
Figure 6. ErbB4 deficiency does not affect presynaptic function of SOM+ TRN neurons
(a) A schematic recording configuration. The SOM+ TRN neurons (green) in SOM-IRES-Cre mice were infected with the AAV-DIO-ChR2(H134R)-YFP. The IPSCs, which were evoked by photo-stimulation of the SOM+ TRN neurons, were recorded from neurons in the thalamus. (b) Left: representative IPSC traces, which were recorded from a thalamic neuron in a SOMErbB4+/+ (WT; top) or a SOMErbB4−/− (KO; bottom) mouse, respectively, in response to photo-stimulation (blue bars) of the SOM+ TRN neurons. A pair-pulse stimulation protocol was used. Calibrations: 50 pA and 50 ms. Right: there was no significant difference between WT and KO mice in the paired-pulse ratio at different inter-pulse intervals (WT, n = 11 cells; KO, n = 14 cells; F(1,23) = 0.29, P = 0.59, two-way RM ANOVA). Under our experimental regime there was no significant difference between WT and KO in the peak amplitude of the first IPSCs in the paired-pulses (WT, 240.1±29.8 pA, n = 11; KO, 257.6±39 pA, n = 15; P = 0.74, t-test). Data are presented as mean ± s.e.m.
Figure 7
Figure 7. Blocking GluA4 trafficking in SOM+ TRN neurons in ErbB4 mutant mice reverses the enhanced cortical drive
(a) A schematic of the recording configuration. The CT–TRN pathway in SOMErbB4−/− (KO) mice is selectively stimulated by photo-activation of ChR2-YFP (light green), and EPSCs are recorded from SOM+ TRN neurons (dark green). (b) Left: representative emEPSC traces recorded from a control SOM+ TRN neuron (“KO”), and a SOM+ TRN neuron expressing GluA4-C-tail-GFP (“KO, C-tail-GFP”). The emEPSCs were evoked by minimal photo-stimulation (blue bars) of the CT-TRN pathway. Calibrations: 20 pA and 2 ms. Right: quantification of the emEPSC amplitude (“KO”, n = 8 cells (2 mice); “KO, C-tail-GFP”, n = 9 cells (3 mice); DF = 15; T = 10.65, ****P < 0.0001, t-test). The KO data is the same as that in Fig. 5c & d. (c) Same as in (a), except that the TC–TRN pathway is selectively stimulated. (d) Left: representative emEPSC traces recorded from a control SOM+ TRN neuron expressing GFP (“KO, GFP”), and a SOM+ TRN neuron expressing GluA4-C-tail-GFP (“KO, C-tail-GFP”). The emEPSCs were evoked by minimal photo-stimulation (blue bars) of the TC-TRN pathway. Calibrations: 20 pA and 2 ms. Right: quantification of the emEPSC amplitude (“KO, GFP”: n = 13 cells (3 mice); “KO, C-tail-GFP”, n = 11 cells (3 mice); DF = 22, T = 0.25, P = 0.81, t-test). Data are presented as mean ± s.e.m.
Figure 8
Figure 8. To rescue the behavioral phenotypes of ErbB4 mutant mice by reversing the enhanced cortical drive to TRN
(a) Expression of GluA4-C-tail in SOM+ TRN neurons reduced the performance level of KO mice to that of WT in the auditory/auditory task (“KO, GFP”, n = 8 mice; “KO, C-tail-GFP”, n = 8 mice; F(1,14) = 20.94; session 1, **P = 0.0042, session 2, **P = 0.0075, session 3, ****P < 0.0001, Two-way RM ANOVA followed by Bonferroni tests). The WT data in Fig. 3a is re-plotted here for visual inspection. (b & c) Expression of GluA4-C-tail in SOM+ TRN neurons increased the performance of KO mice in the incongruent trials (b) (“KO, GFP”, n = 8 mice; “KO, C-tail-GFP”, n = 8 mice; F(1,14) = 19.61; session 1, ***P = 0.0007, session 2, **P = 0.0024, session 3, *P = 0.025, session 4, n.s., not significant (P = 0.074), session 5, **P = 0.0074; Two-way RM ANOVA followed by Bonferroni tests), but not in the congruent trials (c) (F(1,14) = 2.09, P = 0.17, Two-way RM ANOVA), of the visual/auditory task. The WT data in Fig. 3b is re-plotted here for visual inspection. Data are presented as mean ± s.e.m.

Comment in

References

    1. Zikopoulos B, Barbas H. Circuits formultisensory integration and attentional modulation through the prefrontal cortex and the thalamic reticular nucleus in primates. Rev Neurosci. 2007;18:417–438. - PMC - PubMed
    1. Ferrarelli F, Tononi G. The thalamic reticular nucleus and schizophrenia. Schizophr Bull. 2010;37:306–315. - PMC - PubMed
    1. Crick F. Function of the thalamic reticular complex: the searchlight hypothesis. Proc Natl Acad Sci U S A. 1984;81:4586–4590. - PMC - PubMed
    1. Pinault D. The thalamic reticular nucleus: structure, function and concept. Brain Res Brain Res Rev. 2004;46:1–31. - PubMed
    1. Halassa MM, et al. State-dependent architecture of thalamic reticular subnetworks. Cell. 2014;158:808–821. - PMC - PubMed

Publication types

LinkOut - more resources