. 2015 Jan;18(1):46-55.
doi: 10.1038/nn.3896. Epub 2014 Dec 15.

A region-specific neurogenesis mode requires migratory progenitors in the Drosophila visual system

Affiliations

A region-specific neurogenesis mode requires migratory progenitors in the Drosophila visual system

Holger Apitz et al. Nat Neurosci. 2015 Jan.

Erratum in

Abstract

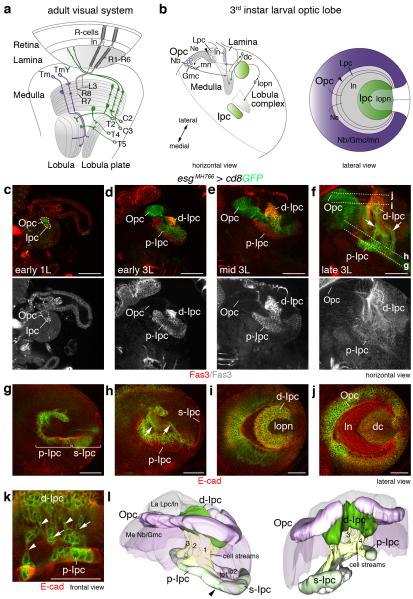
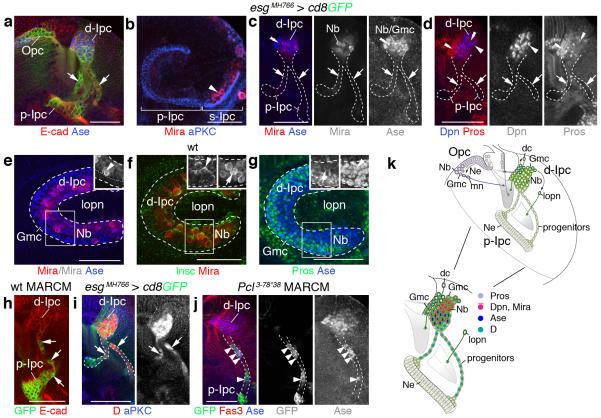
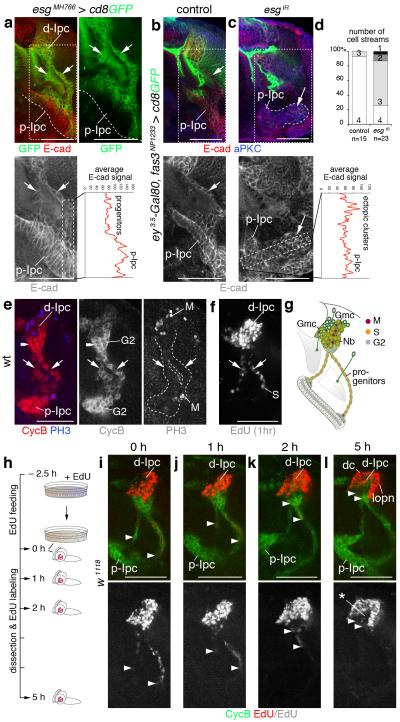
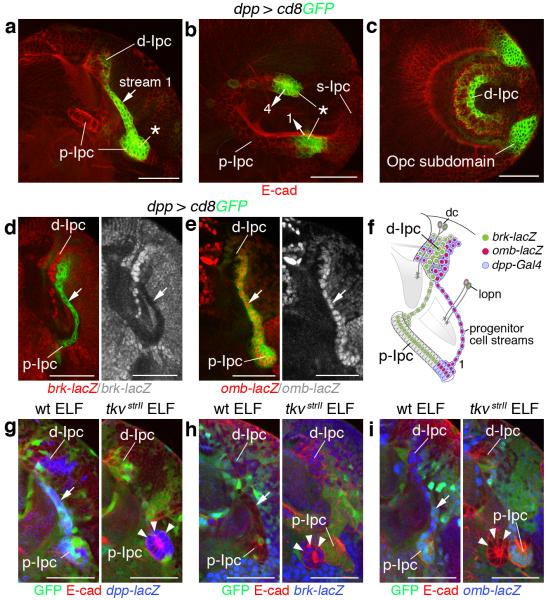
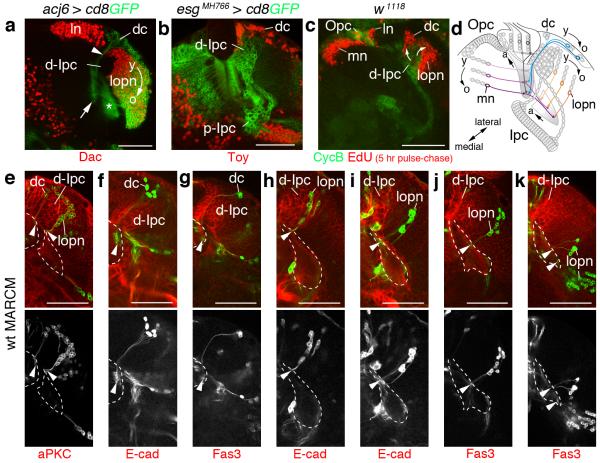
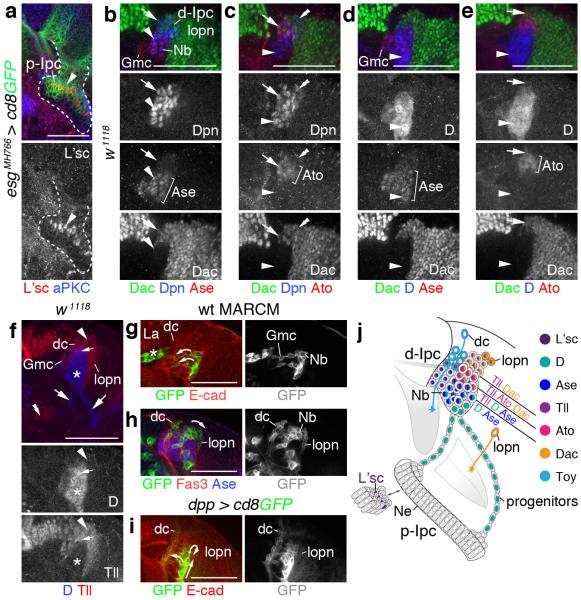
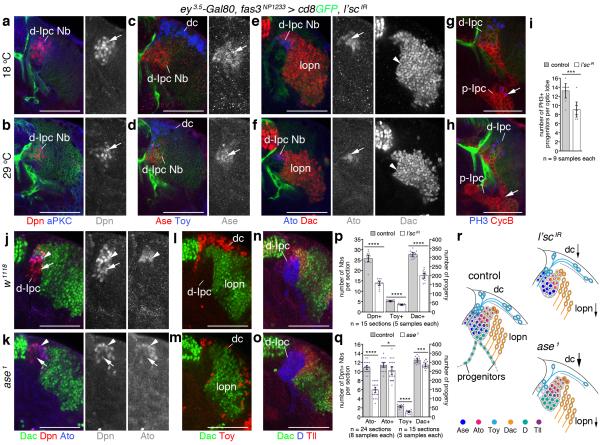
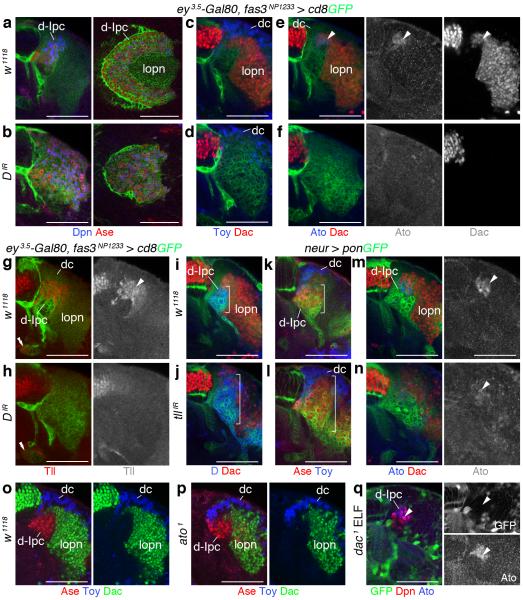
Brain areas each generate specific neuron subtypes during development. However, underlying regional variations in neurogenesis strategies and regulatory mechanisms remain poorly understood. In Drosophila, neurons in four optic lobe ganglia originate from two neuroepithelia, the outer (OPC) and inner (IPC) proliferation centers. Using genetic manipulations, we found that one IPC neuroepithelial domain progressively transformed into migratory progenitors that matured into neural stem cells (neuroblasts) in a second domain. Progenitors emerged by an epithelial-mesenchymal transition-like mechanism that required the Snail-family member Escargot and, in subdomains, Decapentaplegic signaling. The proneural factors Lethal of scute and Asense differentially controlled progenitor supply and maturation into neuroblasts. These switched expression from Asense to a third proneural protein, Atonal. Dichaete and Tailless mediated this transition, which was essential for generating two neuron populations at defined positions. We propose that this neurogenesis mode is central for setting up a new proliferative zone to facilitate spatio-temporal matching of neurogenesis and connectivity across ganglia.


Figures

Figure 1
Figure 1. The larval Drosophila optic lobe shows extensive cell streams in the Ipc.
Schematics of adult (a) and third instar larval (b) optic lobes. Outer and inner proliferation center (Opc, Ipc) progeny are shown in purple and green, respectively. dc, distal cells; Gmc, ganglion mother cells; ln, lamina neurons; Lpc, lamina precursor cells; lopn, lobula plate neurons; mn, medulla neurons; neuroblast, Nb; Tm and TmY, transmedullary neurons; arrowheads, lamina furrow. (c-f) escargot (esg)MH766-Gal4, UAS-cd8GFP (green) transgenes label Opc neuroepithelial (Ne) cells, Ipc neuroepithelial cell subsets and their progeny in early first (1L) and early, mid and late third (3L) larval stages. The Ipc and offspring express Fasciclin 3 (Fas3, red). Opc neuroepithelial cells are located superficially, Ipc neuroepithelial cells centrally. Cell streams (arrows) connect the proximal and distal Ipc (p-Ipc, d-Ipc), as their distance increases. Lines (f) indicate focal planes shown in (g–j). esgMH766-Gal4, UAS-cd8GFP and E-cadherin (E-cad, red) labeling shows that the p-Ipc and surface-Ipc (s-Ipc) form an asymmetric horseshoe (indicated by brackets in g), and the d-Ipc a symmetric horseshoe (i). The d-Ipc surrounds lobula plate neurons (i). The superficial Opc and lamina crescents are adjacent to distal cells (j). Cell streams (arrows) consist of interconnected, elongated (arrowheads) cells (h,k). (l) A 3D model shown at two angles illustrates the four main cell streams between the p-Ipc and d-Ipc. The s-Ipc generates the lobula cell clusters lo1 and lo2. arrowhead, p-Ipc/d-Ipc boundary. Detailed genotypes and sample numbers are presented in Supplementary Table 1. Scale bars, 50 μm.
Figure 2
Figure 2. Cell streams in the Ipc consist of progenitors.
(ad) escargot (esg)MH766-Gal4, UAS-cd8GFP (green; not shown in bd) delineates the p-Ipc neuroepithelium and cell streams. (a) p-Ipc neuroepithelial cells express E-cadherin (E-cad; red). The d-Ipc contains Asense-positive neuroblasts (Ase+ Nbs, blue). (b) Miranda-positive neuroblasts (Mira+, red, arrowhead) delaminate from the s-Ipc (brackets) visualized with aPKC (blue). (c,d) d-Ipc neuroblasts express Mira (red), Ase (blue) (c) and Deadpan (Dpn, blue) (d). Ganglion mother cells (Gmc) in the lower d-Ipc express Ase (double arrowheads, c). Prospero (Pros, red, d) labels Gmcs intermingled with d-Ipc neuroblasts and in two zones facing the lamina and the optic lobe surface (double arrowheads). Cell streams (arrows) weakly express cytoplasmic Mira but not Ase, Dpn or Pros (c,d). (e) The lower d-Ipc contains centrally Ase+ and Mira+ neuroblasts and Ase+ Gmcs, and peripherally Ase+ Gmcs. (f) In neuroblasts, basal Mira crescents (arrow) are orientated peripherally and apical Inscuteable crescents (Insc, green, arrowheads) centrally. (g) Pros (green) forms basal crescents (arrows) in neuroblasts. Nuclear Pros and Ase (blue) colocalize in Gmcs. (h) Wild type (wt) MARCM clones show that cell streams (arrows) originate from the p-Ipc. (i) Cell streams (arrows) and the d-Ipc express Dichaete (D, red). Polycomblike (Pcl3-78*38) mutant progenitors (green) generated by MARCM (j) prematurely express Ase (blue, arrowheads). (k) Ipc schematic summarizing cellular marker distributions. dc, distal cells; mn, medulla neurons; lopn, lobula plate neurons. b,eg show lateral views. For genotypes and sample numbers, see Supplementary Table 1. Scale bars, 50 μm.
Figure 3
Figure 3. Migratory progenitors arise by epithelial-mesenchymal transition and require escargot (esg).
(a) Progenitors, leaving the p-Ipc (line) and entering cell streams (arrows), upregulate esgMH766-Gal4, UAS-cd8GFP (green) and downregulate E-cadherin (E-cad, red). (b,c) Compared to controls (b), Ipc-specific knockdown of esg (esgIR) using fasciclin3 (fas3)NP1233-Gal4 induces ectopic clusters continuous with the p-Ipc (large arrows, c) that maintain strong E-cad expression. Small arrows indicate one of the streams (b). Graphs show average E-cad fluorescence signals in boxes in left-hand higher-magnification panels. (d) Quantification of main cell stream numbers in controls and upon esg knockdown. (e) p-Ipc neuroepithelial cells strongly express CyclinB (CycB, red). After leaving the p-Ipc, progenitors express phosphoHistone 3 (PH3, blue). (f) Progenitors in streams (arrows), labeled by 1 hour EdU incubation, are in S phase. They enter G2 phase at the d-Ipc base (double arrowheads, e). d-Ipc neuroblasts and ganglion mother cells (Nb/Gmc) undergo S phase and mitosis (e,f). (g) Summary of Ipc cell cycle profile. (hl) In EdU pulse-chase experiments, brains of wandering third instar larvae were assessed at 0, 1, 2 and 5 hours after 2.5 hours EdU feeding. Arrowheads indicate the most proximal EdU+ (red) progenitors within streams. The distance of EdU+ progenitors to the p-Ipc gradually increases, consistent with migration. After 5 hours, d-Ipc neuroblasts/Gmcs above CycB (green) expressing progenitors are no longer labeled with EdU (asterisk, l). Labeling persists in distal cells (dc) and lobula plate neurons (lopn). For genotypes and sample numbers, see Supplementary Table 1. Scale bars, 50 μm.
Figure 4
Figure 4. Local Decapentaplegic (Dpp) signaling is required for epithelial-mesenchymal transition in p-Ipc subdomains.
(a-c) dpp-Gal4, UAS-cd8GFP (green) label ventral and dorsal subdomains of the p-Ipc (asterisks), progenitor cell streams 1 and 4 (arrows) and parts of the central d-Ipc. Optic lobes are shown in a horizontal orientation in a (cf. Fig. 1f) and in a lateral orientation in b (cf. Fig. 1g) and c (cf. Fig. 1i). (d,e) dpp-labeled cell streams (arrows) are brinker (brk)-lacZ negative (red, d) and optomotor-blind (omb)-lacZ positive (red, e). (f) Schematic illustrating dpp, omb and brk marker expression in the Ipc. (gi) Unlike in wild type (wt) (left panels), in thickveins (tkvstrII) ELF mosaics (right panels), mutant GFP-negative cells adjacent to p-Ipc neuroepithelial cells form small ectopic clusters that express dpp-lacZ (blue, arrowheads, g) and brk-lacZ (blue, arrowheads, h), but not omb-lacZ (blue, arrowheads, i). Optic lobes are co-labeled with E-cadherin (E-cad, red, ac,gi). For genotypes and sample numbers, see Supplementary Table 1. Scale bars, 50 μm.
Figure 5
Figure 5. d-Ipc progeny are generated in a defined spatio-temporal pattern.
(a,b) The d-Ipc produces two populations, distal cells (dc) and lobula plate neurons (lopn) labeled with abnormal chemosensory jump 6 (acj6)-Gal4, UAS-cd8GFP (green, a). Somata of Twin of eyeless-positive (Toy+) distal cells (red, b) reside in a layer above Dachshund-positive (Dac+) lobula plate neurons (red, a). Distal cell neurites form tracts (arrowhead) between ganglion mother cell (Gmc)-enriched d-Ipc zones adjacent to lamina neurons (ln) and project into the proximal medulla neuropil (arrow, a). Lobula plate neurons extend neurites into the lobula complex neuropils (asterisk, a). The d-Ipc produces Dac (young, y) and Dac and acj6-Gal4 (old, o) expressing progeny (a). (c) In EdU labeling experiments (incorporation for 2.5 hours, dissection after 5 hours), newly born EdU+ lamina neurons and medulla neurons (mn) (red) are added laterally and medially of Opc neuroepithelial cells, respectively. Distal cells and lobula plate neuron columns are added from lower and upper d-Ipc (arrows), respectively. (d) Schematic of locations and simplified projections of young, medium-aged and older Opc and d-Ipc progeny. (ek) MARCM clones of d-Ipc progeny correlate birth-order and position of somata with their projections (arrowheads) in medulla and lobula complex neuropils (outlined). Clones of newly generated distal cells and lobula plate neurons are situated adjacent to the d-Ipc and extend neurites into anterior neuropil domains (e). Older neurons are shifted laterally and innervate more posterior neuropil domains (fk). For genotypes and sample numbers, see Supplementary Table 1. Scale bars, 50 μm.
Figure 6
Figure 6. Transcription factor expression patterns in d-Ipc neuroblasts.
(a) p-Ipc neuroepithelial cells (arrowhead) adjacent to cell streams express Lethal of scute (L’sc, red). (b,c) Deadpan-positive (Dpn+, blue) d-Ipc neuroblasts (Nb) sequentially express Asense (Ase, red, arrowheads, b), Atonal (Ato, red, arrows, c) and Dachshund (Dac, green, arrows b,c), and solely Dac (double arrowheads, c). (d,e) Dichaete (D, blue) shows strong overlap with Ase (red, arrowheads, d), and weak or no overlap with Ato (red) and Dac (green) in neuroblasts (arrows, e). (f) Progenitors (arrows) and lower d-Ipc neuroblasts (asterisk) express D (blue). Tailless (Tll, red) is expressed in p-Ipc neuroepithelial cells (double arrowheads), upper d-Ipc neuroblasts (arrowheads), ganglion mother cells (Gmc), and young distal cells (dc) and lobula plate neurons (lopn). D and Tll overlap in central neuroblasts (small arrows). (g) The wild type (wt) MARCM clone shows that neuroblasts in the lower d-Ipc give rise to Gmcs orientated towards the lamina (la, arrows), and where distal cells are found. Asterisk indicates an independent lamina glia clone. (h) The clone shows labeling of distal cells, and Ase-negative neuroblasts in the upper d-Ipc, that produce lobula plate neurons. (i) GFP driven by decapentaplegic (dpp)-Gal4 is present in a subset of neuroblasts and persists in both distal cell and lobula plate neuron populations. (j) Summary of expression patterns. For genotypes and sample numbers, see Supplementary Table 1. Scale bars, 50 μm.
Figure 7
Figure 7. Lethal of scute and Asense differentially promote d-Ipc neuroblast supply and maturation.
(af) fasciclin3 (fas3)NP1233-Gal4 drives lethal of scute (l’sc) RNAi transgene expression at 18°C (control, a,c,e) and after a shift to 29°C (knockdown, b,d,f). Compared to controls, l’sc knockdown decreases Deadpan-positive (Dpn+) neuroblast (Nb) numbers (red, arrows, a,b). Fewer Asense-positive (Ase+) neuroblasts (red, arrows) and Twin of eyeless-positive (Toy+) distal cells (dc, blue) form (c,d). Fewer Atonal-positive (Ato+) neuroblasts (blue, arrows) and Dachshund-positive (Dac+) progeny (red, arrowheads) arise (e,f). (g,h) Less progenitors in cell streams (arrows) show phosphoHistone 3 (PH3, blue, arrow). (i) Quantification of PH3-positive progenitors per optic lobe in controls and upon l’sc knockdown. (j,k) ase loss decreases Dpn+/Ato neuroblast numbers (red, arrows). Dpn+/Ato+ (blue) neuroblasts are affected less (arrowheads). (l,m) Toy+ distal cell (red) numbers are reduced; Dac+ progeny (green) are mildly affected. (n,o) Dichaete (D, blue) and Tailless (Tll, red) persist. (p,q) Quantification of l’sc knockdown and ase1 loss-of-function phenotypes. Asterisks indicate statistically significant differences. (r) Schematic summarizing observed phenotypes. Arrow sizes indicate the extent of cell loss. D and Tll expression are not shown for l’sc. (i,p,q) Graphs show data point distributions and means ± 95% confidence intervals. Two-tailed unpaired Student’s t-test p-values: (i) p=0.0007; (p) p=1.18×10⁻¹²; p=1.07×10⁻¹²; p=1.95×10⁻¹³; (q) p=2.88×10⁻¹⁷; p=0.02; p=2.11×10⁻¹¹; p=0.0007. t-values and degrees of freedom (df): (i) t=4.16, df=15.96; (p) t=13.71, df=23.32; t=12.41, df=27.12; t=14.29, df=24.68; (q) t=13.65, df=43.17; t=2.44, df=35; t=10.70, df=28; t=3.84, df=27.51. For genotypes and sample numbers, see Supplementary Table 1. Scale bars, 50 μm.
Figure 8
Figure 8. Dichaete acts upstream of Tailless to mediate the transition from Asense-positive to Atonal/Dachshund-positive neuroblasts.
(ah) Effects of Ipc-specific Dichaete (D) knockdown using fas3NP1233-Gal4 (b,d,f,h) were compared to w1118 controls (a,c,e,g). (a,b) D knockdown does not affect the formation of Deadpan/Ase-positive (Dpn+/Ase+) neuroblasts. Lobula plate neurons (lopn) fail to form. Lateral views in right-hand panels show that the d-Ipc does not form a crescent and instead is disk-shaped. (c-f) Twin of eyeless (Toy+) distal cells (dc) are generated; Atonal/Dachshund-positive (Ato+/Dac+) neuroblasts (arrowheads) and Dac-expressing lobula plate neurons are absent. (g,h) D knockdown leads to complete loss of Tailless (Tll) in d-Ipc neuroblasts (arrowhead) and their progeny. Tll expression in the p-Ipc (double arrowheads) is not affected. (in) Effects of tll knockdown using neuralized (neur)-Gal4 in d-Ipc neuroblasts (j,l,n) were compared to w1118 controls (i,k,m). (i,j) Upon tll knockdown, D expression is expanded. (k,l) Ase+ d-Ipc neuroblasts and Toy+ distal cells can form. (m,n) Ato+/Dac+ d-Ipc neuroblasts (arrowheads) and Dac+ neuroblasts and lobula plate neurons are reduced. (o,p) Loss of ato does not interfere with Dac expression. (q) Loss of dac in ELF clones does not interfere with Ato expression. For genotypes and sample numbers, see Supplementary Table 1. Scale bars, 50 μm.

References

    1. Lui JH, Hansen DV, Kriegstein AR. Development and evolution of the human neocortex. Cell. 2011;146:18–36. - PMC - PubMed
    1. Florio M, Huttner WB. Neural progenitors, neurogenesis and the evolution of the neocortex. Development. 2014;141:2182–2194. - PubMed
    1. Brand AH, Livesey FJ. Neural stem cell biology in vertebrates and invertebrates: more alike than different? Neuron. 2011;70:719–729. - PubMed
    1. Homem CC, Knoblich JA. Drosophila neuroblasts: a model for stem cell biology. Development. 2012;139:4297–4310. - PubMed
    1. Ayala R, Shu T, Tsai LH. Trekking across the brain: the journey of neuronal migration. Cell. 2007;128:29–43. - PubMed

Publication types

MeSH terms