. 2015 Feb;47(2):106-14.
doi: 10.1038/ng.3168. Epub 2014 Dec 15.

Pan-cancer network analysis identifies combinations of rare somatic mutations across pathways and protein complexes

Affiliations

Pan-cancer network analysis identifies combinations of rare somatic mutations across pathways and protein complexes

Mark D M Leiserson et al. Nat Genet. 2015 Feb.

Abstract

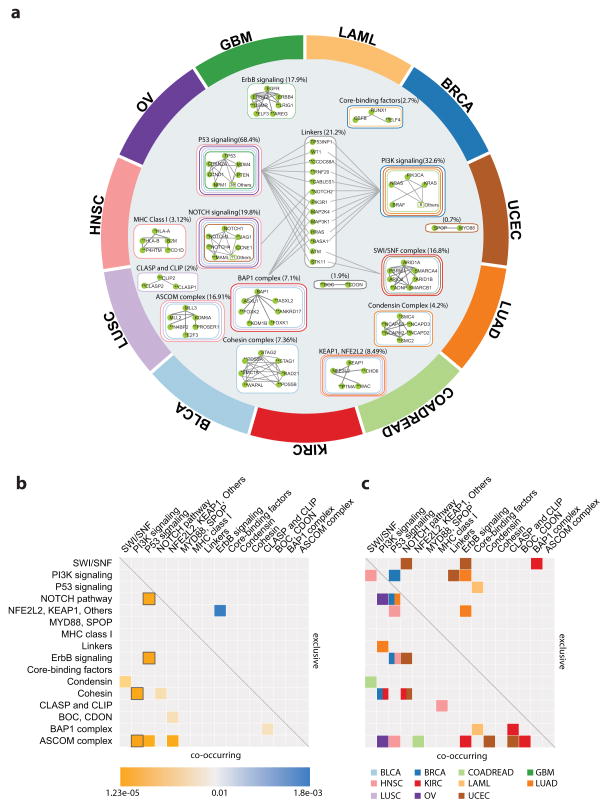
Cancers exhibit extensive mutational heterogeneity, and the resulting long-tail phenomenon complicates the discovery of genes and pathways that are significantly mutated in cancer. We perform a pan-cancer analysis of mutated networks in 3,281 samples from 12 cancer types from The Cancer Genome Atlas (TCGA) using HotNet2, a new algorithm to find mutated subnetworks that overcomes the limitations of existing single-gene, pathway and network approaches. We identify 16 significantly mutated subnetworks that comprise well-known cancer signaling pathways as well as subnetworks with less characterized roles in cancer, including cohesin, condensin and others. Many of these subnetworks exhibit co-occurring mutations across samples. These subnetworks contain dozens of genes with rare somatic mutations across multiple cancers; many of these genes have additional evidence supporting a role in cancer. By illuminating these rare combinations of mutations, pan-cancer network analyses provide a roadmap to investigate new diagnostic and therapeutic opportunities across cancer types.


Conflict of interest statement

Competing Financial Interests

A patent application related to this work has been filed.

Figures

Figure 1
Figure 1
HotNet2 Pan-Cancer analysis (a) The Pan-Cancer mutation data combines SNVs (nsSNVs and small indels) and CNAs (amplifications and deletions) in 19,459 genes in 3,281 samples. The number of samples with SNVs/CNAs is shown for each gene, with points colored by the total. (b) Removing hypermutator samples and genes with few RNA-Seq reads in all tumor types leaves 11,565 genes in 3,110 samples for analysis with a wide range in the number of samples having an SNV (x-axis) or CNA (y-axis) in these genes. (c) HotNet2 finds significantly mutated subnetworks using a diffusion process on a protein-protein interaction network. Each node (protein) is assigned a score (heat) according to the frequency/significance of SNVs or CNAs in the corresponding gene. Heat diffuses across edges of network. Subnetworks containing nodes that both send and receive a significant amount of heat (outlined) are reported. (d) Subnetworks identified by HotNet2 include genes with wide range of heat scores, including both frequently mutated, known cancer genes (hot genes) and rarely mutated genes (cold genes) that are implicated due to their interactions with other cancer types. Thus, HotNet2 delves into long tail of rarely mutated genes by analysis of combinations of interacting genes.
Figure 2
Figure 2
Overview of HotNet2 Pan-Cancer results. (a) Hotnet2 consensus subnetworks are arranged near the cancer types where they are enriched for mutations using a force-directed layout (BLCA=bladder urothelial carcinoma, BRCA=breast invasive carcinoma, COADREAD=colon adenocarcinoma and rectum adenocarcinoma, GBM=glioblastoma multiforme, HNSC=head and neck squamous cell carcinoma, KIRC=kidney renal clear cell carcinoma, LAML=acute myeloid leukemia, LUAD=lung adenocarcinoma, LUSC=lung squamous cell carcinoma, OV=ovarian serous cystadenocarcinoma, UCEC=uterine corpus endometrioid carcinoma). Colored outlines surrounding each network indicate the cancer types that are enriched for mutations (corrected P<0.05). Interactions between proteins in a subnetwork are derived from the three interaction networks used in our Pan-Cancer analysis. In the center, there are 13 “linker” genes that are members of more than one consensus subnetwork; dotted lines between linkers and other consensus subnetworks indicate protein-protein interactions between them. (b) Heat map of significant co-occurrence (yellow, lower triangular) and exclusivity (blue, upper triangular) of mutations across all Pan-Cancer samples in the most frequently mutated HotNet2 Pan-Cancer consensus and condensin subnetworks (P < 0.01, Cochran–Mantel–Haenszel test). Black outlines indicate pairs of subnetworks that have P < 0.05 after multiple hypothesis correction. (c) Exclusivity/co-occurrence (P < 0.01, Fisher’s exact test) within individual cancer types using the same color scheme as part (a).
Figure 3
Figure 3
HotNet2 Pan-Cancer subnetworks overlapping SWI/SNF and BAP1 complexes. (a) Subnetwork containing members of the SWI/SNF complex including the BAF proteins ARID1A and ARID1B, PBAF proteins PBRM1 and ARID2, catalytic core member SMARCA4, SMARCB1 and ADNP. (a - Top) Mutation matrix shows the samples (colored by cancer type as shown in legend) with a mutation of the indicated type: full ticks represent SNVs, indels, and splice site mutations; upticks and downticks represent amplifications and deletions, respectively. A black dot corresponds to samples with an inactivating mutation in the gene, that the genes contain at least one of the following mutations: nonsense, frame shift indels, nonstop, or splice site. The number of samples with mutations in a gene is in parenthesis; genes with * were significant by exactly one of GISTIC2, MuSiC, MutSigCV, Oncodrive, or the list of driver genes in while genes with ** were not significant by any of these methods. (a - Bottom left) Interactions between proteins in the subnetwork from each interaction network are colored according to mutually enriched cancer type with corresponding P-values. (a - Bottom right) PBRM1 protein sequence exhibited significant clustering of missense mutations (P=1.6×10⁻⁵) in a 105 amino acid bromodomain, a region that was reported to be mutated in a different renal clear cell carcinoma cohort, but not in TCGA KIRC publication. (B) Subnetwork containing members of the BAP1 complex including core PR-DUB complex, comprised of the deubiquinating enzyme BAP1 and the polycomb group proteins ASXL1 and ASXL2, as well as the BAP1-interacting proteins: ANKRD17, FOXK1, FOXK2, and KDM1B. Colors, marks, and panel organization are structured as in panel (a). (C) Inactivating mutations across samples (columns) in the SWI/SNF and BAP1 complexes (rows) in KIRC. The bottom row shows the mRNA expression classification of each sample. The mutations in these complexes are surprisingly exclusive in KIRC (P<3.6×10⁻⁴, Fisher’s exact test, corrected), and BAP1 is significantly enriched in mutations in the third expression subtype (P<3.4×10⁻⁸, Fisher’s exact test).
Figure 4
Figure 4
HotNet2 Pan-Cancer subnetworks overlapping the cohesin and condensin complexes. (a) Cohesin consensus subnetwork and its mutations. Colors and marks as in Figure 2(a). None of the genes is mutated in more than 1.9% of the samples, but the subnetwork is mutated in >4% of the samples in each cancer type. STAG1 exhibits significant (P<6×10⁻⁵) clustering of missense mutations across 135 residues (highlighted) in the Pfam-B domain (PFAM ID: PB002581), a pattern suggesting inactivation of the corresponding domain. (b) Condensin consensus subnetwork, its mutations. (Top) Mutation matrix shows five genes in the condensin I and II complexes. Only one gene, SMC4, was significant by individual gene scores. (Bottom left) A subnetwork consisting of NCAPD2 and SMC4, both members of Condensin I, was significantly mutated in BLCA, while a subnetwork consisting of NCAPD3, NCAPG2 and NCAPH2, all members of Condensin II, was significantly mutated in LUAD and LUSC. At the gene level: NCAPD2 was significantly mutated in BLCA; SMC4 was significantly mutated in BLCA and HNSC; NCAPD3 was significantly mutated in LUAD; and NCAPG2 was significantly mutated in LUSC. (Bottom right) NCAPH2 shows a significant (P < 2.6×10⁻⁴) cluster of missense mutations between R551 and S556.

Comment in

References

    1. The Cancer Genome Atlas Network. Comprehensive molecular portraits of human breast tumours. Nature. 2012;490:61–70. - PMC - PubMed
    1. The Cancer Genome Atlas Network. Comprehensive genomic characterization defines human glioblastoma genes and core pathways. Nature. 2008;455:1061–8. - PMC - PubMed
    1. Creighton CJ, et al. Comprehensive molecular characterization of clear cell renal cell carcinoma. Nature. 2013 doi: 10.1038/nature12222. - DOI - PMC - PubMed
    1. The Cancer Genome Atlas Network. Genomic and Epigenomic Landscapes of Adult De Novo Acute Myeloid Leukemia. N Engl J Med. 2013 doi: 10.1056/NEJMoa1301689. - DOI - PMC - PubMed
    1. Hammerman PS, et al. Comprehensive genomic characterization of squamous cell lung cancers. Nature. 2012;489:519–25. - PMC - PubMed

Publication types

Substances