. 2015 Apr;22(4):583-96.
doi: 10.1038/cdd.2014.195. Epub 2014 Dec 12.

The MT2 receptor stimulates axonogenesis and enhances synaptic transmission by activating Akt signaling

Affiliations

The MT2 receptor stimulates axonogenesis and enhances synaptic transmission by activating Akt signaling

D Liu et al. Cell Death Differ. 2015 Apr.

Abstract

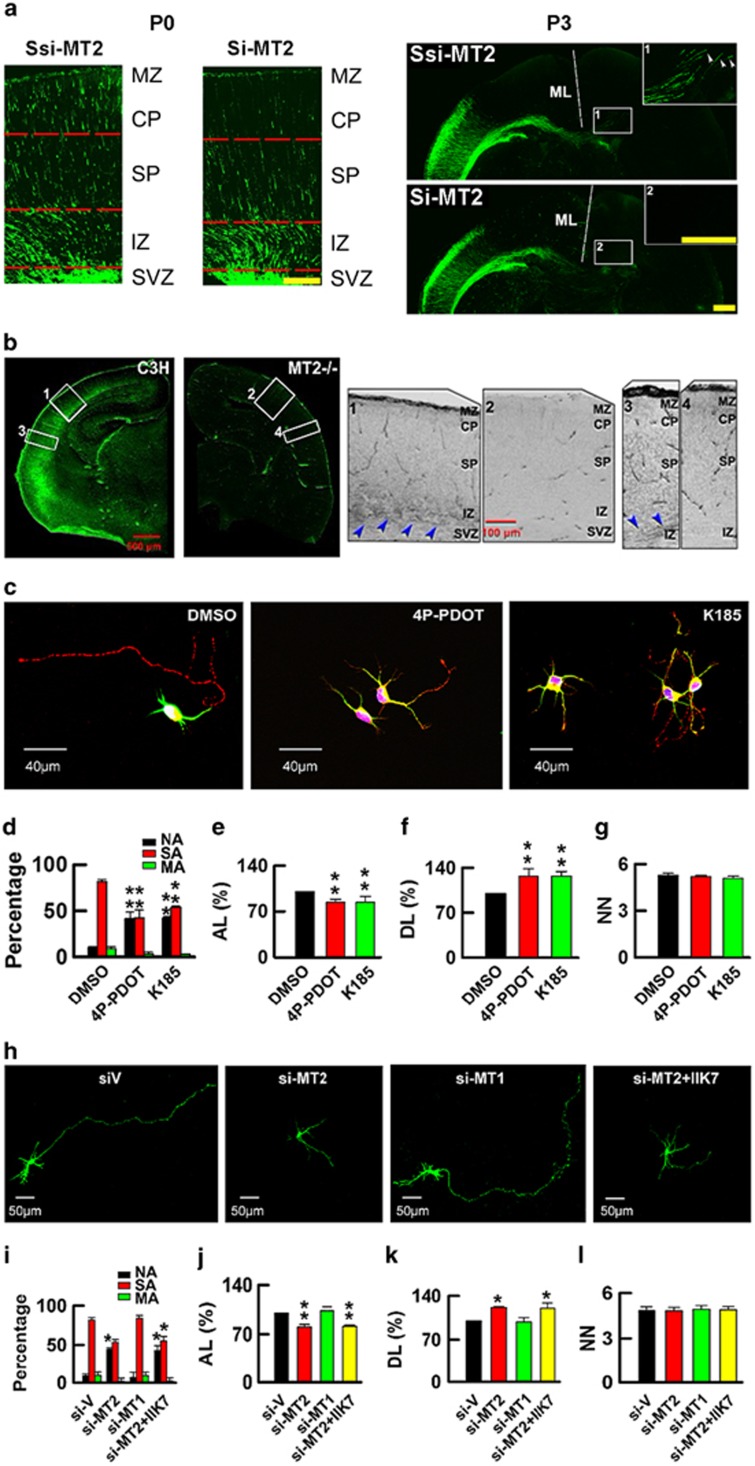
The MT2 receptor is a principal type of G protein-coupled receptor that mainly mediates the effects of melatonin. Deficits of melatonin/MT2 signaling have been found in many neurological disorders, including Alzheimer's disease, the most common cause of dementia in the elderly, suggesting that preservation of the MT2 receptor may be beneficial to these neurological disorders. However, direct evidence linking the MT2 receptor to cognition-related synaptic plasticity remains to be established. Here, we report that the MT2 receptor, but not the MT1 receptor, is essential for axonogenesis both in vitro and in vivo. We find that axon formation is retarded in MT2 receptor knockout mice, MT2-shRNA electroporated brain slices or primary neurons treated with an MT2 receptor selective antagonist. Activation of the MT2 receptor promotes axonogenesis that is associated with an enhancement in excitatory synaptic transmission in central neurons. The signaling components downstream of the MT2 receptor consist of the Akt/GSK-3β/CRMP-2 cascade. The MT2 receptor C-terminal motif binds to Akt directly. Either inhibition of the MT2 receptor or disruption of MT2 receptor-Akt binding reduces axonogenesis and synaptic transmission. Our data suggest that the MT2 receptor activates Akt/GSK-3β/CRMP-2 signaling and is necessary and sufficient to mediate functional axonogenesis and synaptic formation in central neurons.


Figures

Figure 1
Figure 1
MT2 accumulation in the polarized axon terminals. (ad) Distribution of MT2 and MT1 in stage 2 (12 h) and stage 3 (48 h) cultured rat hippocampal neurons. The neurons were co-stained with anti-MT2 (a) or anti-MT1 (c) (red) and anti-Tuj1 (green) antibodies, and profiles of MT2 (b) and MT1 (d) immunofluorescence intensity in different segments of the neuronal processes during stage 2 and stage 3. Arrow and arrowhead indicate, respectively, axon tip distribution of MT2 and MT1 in stage 3 neurons; AU means arbitrary unit. (e) Relative immunofluorescence intensity of MT2 and MT1 at the axon and dendrite tips of stage 3 neurons normalized to that of the cell body. Data are mean±S.E.M., n=11, **P<0.01 versus dendrite
Figure 2
Figure 2
MT2 receptor is essential for axon development. (a) Rats embryos were electroporated with mU6-MT2-shRNA-pUbi-EGFP (si-MT2) or scrambled one (Ssi-MT2) at E16 and the slices were prepared at postnatal day 0 (P0) or day 3 (P3). MZ, marginal zone; CP, corticalplate; SP, subplate; IZ, intermediate zone; SVZ, subventricular zone; ML, midline. Bar=200 μm for P0, 500 μm for P3. Arrowheads indicate the axonal terminals. (b) Coronary slices from C3H and MT2−/− mice at P0 were stained by SMI312, and high magnifications were from boxes 1 to 4 (n=4). (c) Primary neuronal cultures from E18 rat hippocampuswere treated with MT2 receptor antagonists, 4P-PDOT (10 μM) or K185 (10 μM), or vehicle control DMSO at 4 h after plating. Seventy-two hours after plating, the cultures were co-stained with Tau1 (red) and MAP2 (green) (n=87–115). (dg) Bar graphs show the percentage of no-axon (NA), single-axon (SA), and multiple-axon (MA) neurons, as well as axon length (AL), dendrite length (DL), and the neurite number (NN).Data are mean±S.E.M. **P<0.01 versus DMSO. (h) Primary neurons from E18 rat hippocampus were transfected with shRNA of MT2 (si-MT2) or MT1 (si-MT1) or the vector plasmid (siV) before plating. IIK7 (10 μM) was added at 4 h after plating. Images were captured at 72 h after plating (n=42–45). (il) Bar graphs show the percentage of no-axon (NA), single-axon (SA), and multiple-axon (MA) neurons, as well as axon length (AL), dendrite length (DL), and the neurite number (NN). *P<0.05, **P<0.01,versus siV
Figure 3
Figure 3
Activation of MT2 receptor promotes functional axon formation. (a) Dissociated rat hippocampal neurons (E18) were treated with MT2 receptor agonists, MEL or IIK7, or DMSO at 4 hrs after plating. 72hrs after the treatment the cultures were co-stained with Tau-1 (red) and MAP2 (green) (n=69–115). (be) Bar graphs show the percentages for different types of neurons in different treatments, NA means neurons with no axon, SA means neurons with singleaxon, and MA means neuron with multiple axons, as well as axon length (AL), dendrite length (DL), and the neurite number (NN). Data are mean±S.E.M. **P<0.01, versus DMSO. (f) Dissociated rat hippocampal neurons (E18) were treated with IIK7 plus antibodies against the MT1 receptor (Cat No. sc-13179, Santa Cruz Biotech.; n=46 cells) or the MT2 receptor (Cat No. sc-28456, Santa Cruz Biotech.; n=53 cells) or control non-specific IgG (n=55 cells) at 4 h after plating. Seventy-two hours after plating, the cultures were co-stained with Tau1 (red) and MAP2 (green). (gj) Bar graphs show the percentages of no-axon (NA), single-axon (SA), and multiple-axon (MA) neurons, and the axon length (AL), the dendrite length (DL), and the neurite number (NN). Data are mean±S.E.M., **P<0.01 versus IgG+IIK7. (k) Rat cultured neurons were transfected with rat MT2 (rMT2) or MT1 (rMT1) or vector (pcDNA) before plating and the images were captured at 72 h after plating (n=53–54). (lo) Bar graphs show the percentages of no-axon (NA), single-axon (SA), and multiple-axon (MA) neurons, and the axon length (AL), the dendrite length (DL), and the neurite number (NN). Data are mean±S.E.M., **P<0.01 versus pcDNA
Figure 4
Figure 4
Activation of MT2 receptor promotes axon formation during maintainance phase. (a and b) Rat neurons were transfected with DsRED (red) at 36 h and then treated with IIK7 (10 μM) or DMSO at 72 h after plating. Seventy-two hours after treatment, time lapse recording was performed. Arrows indicate the time-lapse differentiation of two neurites at 72 h (a) into neonatal axons at 144 h (b), as stained with Tau1 (green, boxes 1 and 3 in b), while the arrowhead shows the differentiated axon at 72 h (a) and its Tau1 staining at 144 h (green, box 2 in b) (n=75–100). (c and d) Rat primary hippocampal neurons were transfected with DsRed (red) at 36 h after plating and then treated with melatonin (MEL) at 72 h. At 144 h, the axon-dendrite differentiation in the individual neurons was traced by time-lapse recording. Arrow indicates the differentiation of a neurite at 72 h (c, high magnification in box 1) into axon at 144 h (d), as stained with Tau1 (green, box 2 in d). Arrowhead indicates the differentiated axon at 72 h (c, high magnification in box 1) and its Tau1 staining at 144 h (box 3 in d)
Figure 5
Figure 5
Activation of MT2 receptor induces functional axon formation. (a) Rat neurons were transfected with EGFP (green) at 36 h and then treated with IIK7 (10 μM) at 72 h for another 120 h, and a representative EGFP-expressing hippocampal neuron showing three axons at 8 div. Boxes 1–3, axon terminals as boxed were loaded with FM4-64 and imaged 100 s before (pre), and 300 s after (post) 90 mM KCl stimulation and subtraction (Sub) indicates the decrements of FM4-64 fluorescence. (b) Kinetics of FM4-64 fluorescence were expressed as relative intensity, in the three individual axons as boxed in (a). N: axon was from an untreated hippocampal neuron. (cf) Representative recordings of the mEPSCs from the 8 div cultured rat hippocampal neurons treated with DMSO, IIK7 (10 μM), 4P-PDOT (4P, 10 μM), or 4P-PDOT (10 μM) plus IIK7 (10 μM) (4P+IIK7) at 72 h after plating. The frequency and mean amplitude andrise/decay time of the mEPSCs were analyzed (n=13). Data are mean±S.E.M. **P<0.01 versus DMSO, #P<0.05 versus IIK7
Figure 6
Figure 6
MT2 receptor is linked with Akt/GSK-3β/CRMP2 pathway. (a and c) Rat neurons treated with DMSO, MEL (500 μM), IIK7 (10 μM), K185 (10 μM), TCN (400 nM), or TCN (400 nM) plus IIK7 (10 μM)(TCN+IIK7) for 2 h, then the protein extracts were examined by western blotting and β-actin was used as a loading control (n=3). Data are mean±S.E.M. *P<0.05 versus DMSO; ##P<0.01 versus IIK7. (b and d) HEK293 cells co-transfected with DsRED-labeled human MT2 (DsRED-HMT2) or DsRED vector, and treated with DMSO, IIK7 (10 μM), TCN (400 nM), or TCN (400 nM) plus IIK7 (10 μM) (TCN+IIK7) for 2 h. Then, the protein extracts were examined by western blotting (n=3). Data are mean±S.E.M. *P<0.05, **P<0.01 versus DsRED/DMSO; ##P<0.01 versus HMT2/IIK7. The two-way ANOVA followed by Tukey's test was performed. (e and f) Representative images and the quantitative analyses of the hippocampal neuron cultures treated with DMSO, IIK7 (10 μM), TCN (400 nM), or TCN (400 nM) plus IIK7 (10 μM) (TCN+IIK7), and then co-stained with Tau1 (red) and MAP2 (green) (n=62–74). Data are mean±S.E.M. **P<0.01 versus DMSO; ##P<0.01 versus IIK7. (g and h) Neurons cultured from MT2−/− mice were treated with DMSO, IIK7 (10 μM), or TCN (400 nM), or TCN (400 nM) plus IIK7 (10 μM) (TCN+IIK7) at 4 h after plating. The lyses were collected at 3 div for western blot (n=3). Data are mean±S.E.M. *P<0.05 versus DMSO; #P<0.05 versus IIK7
Figure 7
Figure 7
Disruption of MT2–Akt direct interaction inhibits axon differentiation and synaptic formation. (a and b) Hippocampal extracts from E18 rat embryos were immunoprecipitated with MT2 or Akt antibody, and probed by western blotting as labeled. (c) HEK293 cells were co-transfected with DsRED-HMT2 (red) and Akt PH domain (AktPH, green) or Akt PH R25C mutant (AktPHR25C, green), acceptor photobleaching FRET was performed to analyze the interaction of MT2 and Akt PH domain. (d) Illustration shows that application of 10 μM MT2 C-terminal peptide (MT2CT) disrupts MT2–Akt interaction. (e) The E18 rat hippocampal extracts were incubated with 10 μM control peptide (Ctr) or MT2CT peptides (P-1, P-2, and P-3) for 30 min at 37 °C, and then the extracts were immunoprecipitated with anti-Akt and blotted with MT2 and Akt. (f and g) Rat hippocampal neurons were incubated with DMSO, IIK7 (10 μM), MT2CT (P-3, 10 μM), or MT2CT (10 μM) plus IIK7 (10 μM) (MT2CT+IIK7) for 1 h, then t-Akt and p473-Akt were analyzed by quantitative western blotting. (n=3) Data are mean±S.E.M. *P<0.05 versus DMSO; ##P<0.01 versus IIK7. (h) Dissociated rat hippocampal neurons (E18) were treated with DMSO, IIK7 (10 μM), MT2CT (P-3, 10 μM), or MT2CT (10 μM) plus IIK7 (10 μM) (MT2CT+IIK7) at 4 h after plating. Seventy-two hours after plating, the cultures were co-stained with Tau1 (red) and MAP2 (green) (n=76–84). (il) Bar graphs show the percentage of no-axon (NA), single-axon (SA), and multiple-axon (MA) neurons, as well as axon length (AL), dendrite length (DL), and the neurite number (NN). Data are mean±S.E.M. *P<0.05, **P<0.01 versus DMSO; ##P<0.01 versus IIK7. (m) Representative recordings of the mEPSCs from the 8 div cultured rat hippocampal neurons treated with DMSO, IIK7 (10 μM), MT2CT (10 μM), or MT2CT (10 μM) plus IIK7 (10 μM) (MT2CT+IIK7) at 72 h after plating. (n and o) Bar graphs show the frequency and mean amplitude of the mEPSCs (n=11). Data are mean±S.E.M. **P<0.01 versus DMSO, ##P<0.01, versus IIK7
Figure 8
Figure 8
Schematics show the promoting role of MT2 in axonogenesis and synaptic potentiation. Activation of MT2 by melatonin (MEL), IIK7 or MT2 overexpression can stimulate a direct association of MT2 with Akt, which in turn initiate Akt/GSK-3β/CRMP-2 signaling pathway, promote formation of multiple functional axons and potentiate synaptic transmission. On the contrary, inhibition of MT2 signaling by specific inhibitors such as 4P-PDOT and K185, antibody blockage, genetic knockout, or membranous permeable peptide suppresses the axonogenesis and synaptic transmission

References

    1. Polleux F, Ince-Dunn G, Ghosh A. Transcriptional regulation of vertebrate axon guidance and synapse formation. Nat Rev Neurosci. 2007;8:331–340. - PubMed
    1. Bradke F, Dotti CG. The role of local actin instability in axon formation. Science. 1999;283:1931–1934. - PubMed
    1. Schwamborn JC, Muller M, Becker AH, Puschel AW. Ubiquitination of the GTPase Rap1B by the ubiquitin ligase Smurf2 is required for the establishment of neuronal polarity. EMBO J. 2007;26:1410–1422. - PMC - PubMed
    1. Song AH, Wang D, Chen G, Li Y, Luo J, Duan S, et al. A selective filter for cytoplasmic transport at the axon initial segment. Cell. 2009;136:1148–1160. - PubMed
    1. Ozdinler PH, Macklis JD. IGF-I specifically enhances axon outgrowth of corticospinal motor neurons. Nat Neurosci. 2006;9:1371–1381. - PubMed

Publication types

MeSH terms

LinkOut - more resources