. 2015 Feb;16(2):153-60.
doi: 10.1038/ni.3057. Epub 2014 Dec 15.

Identification and distribution of developing innate lymphoid cells in the fetal mouse intestine

Affiliations

Identification and distribution of developing innate lymphoid cells in the fetal mouse intestine

Jennifer K Bando et al. Nat Immunol. 2015 Feb.

Abstract

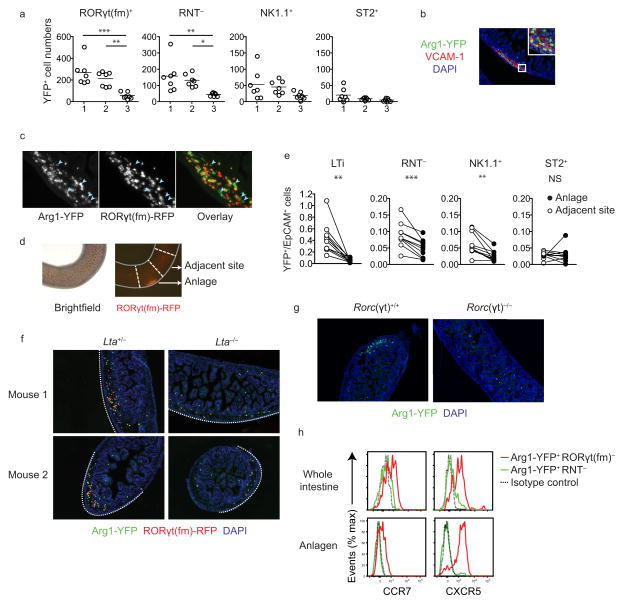
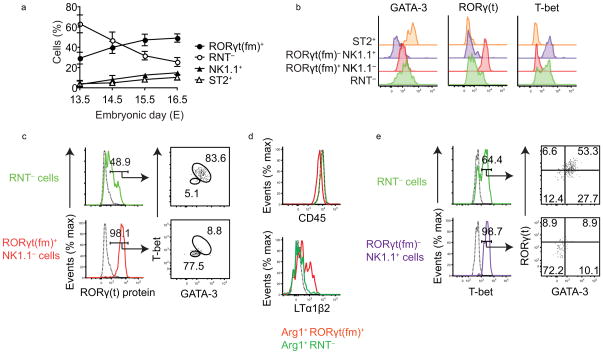
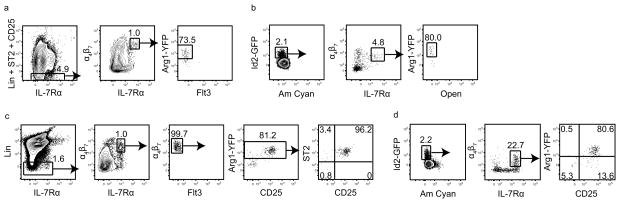
Fetal lymphoid tissue inducer (LTi) cells are required for lymph node and Peyer's patch (PP) organogenesis, but where these specialized group 3 innate lymphoid cells (ILC3s) develop remains unclear. Here, we identify extrahepatic arginase-1(+) Id2(+) fetal ILC precursors that express a transitional developmental phenotype (ftILCPs) and differentiate into ILC1s, ILC2s and ILC3s in vitro. These cells populate the intestine by embryonic day (E) 13.5 and, before PP organogenesis (E14.5-15), are broadly dispersed in the proximal gut, correlating with regions where PPs first develop. At E16.5, after PP development begins, ftILCPs accumulate at PP anlagen in a lymphotoxin-α-dependent manner. Thus, ftILCPs reside in the intestine during PP development, where they aggregate at PP anlagen after stromal cell activation and become a localized source of ILC populations.


Conflict of interest statement

COMPETING FINANCIAL INTERESTS

The authors have no competing financial interests.

Figures

Figure 1
Figure 1
Adult LTi-like cells express the enzyme Arginase-I. (a) YFP+ cells in the adult wild-type (WT) and Arg1YFP small intestine. Plots show live CD45+ cells. (b) Surface markers expressed by YFP+ cells in the adult small intestine. (c) Histological sections of WT and Arg1YFP cryptopatches. Sections are counterstained with DAPI. (d) RORγt antibody staining in an Arg1YFPRag2−/− cryptopatch. (e) Surface markers expressed by YFP+ cells isolated from dissected cryptopatches. Data are representative of three independent experiments (a–e).
Figure 2
Figure 2
Innate lymphoid cells express Arg1 in the fetal gut. (a) YFP expression in E15.5 WT and Arg1YFP intestines. (b) Surface markers expressed by YFP+ cells isolated from E15.5 intestines. (c) RORγt(fm), NK1.1, and ST2 expression in distinct Arg1YFP+ populations in E15.5 intestines. Arg1YFP+RORγt(fm)NK1.1ST2 (Arg1YFP+RNT) cells are also present. (d) Expression of T-bet, GATA-3, and RORγ(t) in Arg1YFP+ST2+ and Arg1YFP+NK1.1+ cells. Plots were previously gated on CD45+Arg1YFP+ cells. (e) Arg1YFP+RORγtGFP− populations from E15.5 Arg1YFPRorc(γt)GFP double-reporter intestines. (f) Arg1YFP+RORγtGFP−NK1.1ST2 cells isolated from E15-E15.5 Rorc(γt)−/− and Rorc(γt)+/− intestines (n = 4 mice per group). P>0.05 (unpaired Student’s t-test). (g) RFP expression in intestinal Arg1YFP+RORγtGFP+ LTi cells from E15.5 and E16.5 Arg1YFP Rorc(γt)GFPRorc(γt)creRosa26floxSTOP-RFP triple-reporter mice. (h) GFP expression in Arg1YFP+RNT cells (identified using fate mapping) isolated from an E15.5 Arg1YFPRorc(γt)GFPRorc(γt)creRosa26floxSTOP-RFP intestine (left). Right, GFP expression in all Arg1+ cells in an Arg1YFPRorc(γt)GFP littermate as a positive control. (i) Arg1YFP+NK1.1ST2CD4 counts in E15.5 Il2rg−/− and Ilr2g+/− intestines (n = 4–6 mice per group). ***P 0.0001 (unpaired Student’s t-test) (j) Left, Id2 (GFP) expression in Arg1YFP+NK1.1ST2CD4 cells isolated from E15.5 Arg1YFPId2GFP double-reporter intestines. Right, Arg1YFP+NK1.1ST2CD4 cells in E15.5 Id2+/− and Id2−/− intestines. Right plots were previously gated on CD45+NK1.1ST2CD4 cells. Data are representative of four (a,c,e) or three (b,d,j) or two (f–i) independent experiments.
Figure 3
Figure 3
Fetal Arg1YFP+RNT cells aggregate at the developing PP anlage. (a) YFP+ cell counts from upper (1), middle (2), and lower (3) sections of the E14.5-E15 small intestine (n = 7 mice per group) *P < 0.05, ** P ≤ 0.01, *** P ≤ 0.001 (one-way ANOVA followed by Tukey’s test). (b) YFP+ cells at the PP anlage in the E16.5 intestine. VCAM-1+ marks activated stromal cells, and sections were counterstained with DAPI. (c) Arg1 (YFP) and RORγt(fm) (RFP) expression at the anlage of E16.5 Arg1YFPRorc(γt)creRosa26floxSTOP-RFP double reporter mice. Light blue arrowheads point at examples of YFP+RFP cells. (c) Identification of the anlage in intact E16.5 Arg1YFPRorc(γt)creRosa26floxSTOP-RFP intestines. (e) Ratio of YFP+ populations to EpCAM+ cells in dissected anlagen and adjacent sites (n = 10 mice per group) ** P ≤ 0.01, *** P ≤ 0.001, NS P>0.05 (paired Student’s t-test). (f) Arg1 (YFP) and RORγt(fm) (RFP) expression in sections of E16.5 intestines from Lta+/− (left) and Lta−/− littermates (right). Lta+/− images are of PP anlagen, while Lta−/− images are representative of sections throughout the proximal half of the intestine (n = 3-4 mice per group). Dotted white lines indicate the anti-mesenteric side of each intestine. (g) Arg1 (YFP) expression in sections of E16.5 intestines from Rorc(γt)+/+ (left) and Rorc(γt)−/− (right) littermates (n = 3-4 mice per group). (h) Expression of CCR7 and CXCR5 in Arg1YFP+RNT cells and Arg1YFP+RORγt(fm)+ LTi cells from whole intestines (left) or dissected anlagen (right). Data are representative of three (b–d,f) or two (g–h) independent experiments, or are pooled from two independent experiments (a,e)
Figure 4
Figure 4
Characterization of Arg1YFP+RNT cells. (a) The frequency of each ILC population as a percent of total YFP+ cells (n = 5–7). Shown are the mean+/-s.d. P<0.001 for all comparisons with RNT cells at E13.5 (one-way ANOVA followed by Tukey’s test). (b) Transcription factor expression in Arg1YFP+RNT cells compared to other Arg1YFP+ ILC populations. (c) GATA-3 and T-bet expression in RORγt protein-expressing RNT cells compared to RORγt(fm)+ cells. (d) CD45 and LTα1β2 expression in Arg1YFP+RNT cells and Arg1YFP+RORγt(fm)+ LTi cells. The dotted black line represents ILC2s in the CD45 plot, and an Ig control in the LTα1β2 plot. (e) RORγt and GATA-3 protein expression in T-bet-expressing RNT cells compared to RORγt(fm)NK1.1+ cells. Data are representative of three independent (b–e) or two independent experiments (a).
Figure 5
Figure 5
Arg1YFP+RNT cells differentiate into mature ILCs. (a) Purity of sorted Arg1YFP+RNT cells (right) compared to unsorted cells (left). (b) Populations detected after culturing Arg1YFP+RNT cells for 20 h. Left, cultured YFP+ cells from Arg1YFP single-reporter animals; right, YFP+RNT cells from Arg1YFPRorc(γt)creRosa26floxSTOP-RFP double-reporter mice. (c) Expression of CD3 and NKp46 by RORγt(fm)+ cells after 6 days of culture. (d) Transcription factors expressed by RORγt(fm)+, NK1.1+ and RORγt(fm)NK1.1CD25+ cells after 6 days of culturing Arg1YFP+RNTCD25 cells with OP9 cells. (e) ICOS expression in NK1.1RORγt(fm)CD25+ cells (red) compared to NK1.1+ (green) and RORγt(fm)+ (blue) populations at day 6 of culture. (f) CD5, CD19, and CD11b expression at day 6 of culture. (g) Examples of gates used to identify populations in single cell cultures at day 6. Left plots are combined files of single wells from a 96-well plate. Right plots are examples of individual wells from single cell cultures. The top left, bottom left, and right plots show different ILC populations from 3 separate wells. (h) Cell populations isolated from wells from single cell cultures at day 6 (left) and breakdown of wells that contained 2 populations (right). Undetermined (UD) cells did not express markers used to identify other lineages. Data are representative of four (a–b), three (g), or two (c–f) independent experiments, or are pooled from three independent experiments of 96 wells each (h).
Figure 6
Figure 6
Arg1YFP expression by LinId2+IL-7Rα+α4β7+ Flt3 cells in fetal liver and adult bone marrow. (a) YFP expression in E14.5-E15 CD45+LinST2CD25IL-7Rα+α4β7+ Flt3 fetal liver cells from Arg1YFP reporter mice. Plots were previously gated on CD45+ cells. (b) Arg1 expression in CD45+LinST2CD25Id2GFP+IL-7Rα+α4β7+ fetal liver cells from Arg1YFPId2GFP double-reporter mice. Plots were previously gated on CD45+LinST2CD25 cells. (c) Expression of CD25 and ST2 in LinIL-7Rα+α4β7+ Flt3YFP+ cells from Arg1YFP adult bone marrow. (d) YFP expression in LinId2GFP+IL-7Rα+α4β7+ cells from Arg1YFPId2GFP adult bone marrow. Plots were previously gated on Lin cells. Data are representative of three (a,c) or two (b,d) independent experiments.

References

    1. Eberl G, et al. An essential function for the nuclear receptor RORgamma(t) in the generation of fetal lymphoid tissue inducer cells. Nat Immunol. 2004;5:64–73. - PubMed
    1. Yoshida H, et al. IL-7 receptor alpha+ CD3(−) cells in the embryonic intestine induces the organizing center of Peyer’s patches. Int Immunol. 1999;11:643–655. - PubMed
    1. De Togni P, et al. Abnormal development of peripheral lymphoid organs in mice deficient in lymphotoxin. Science. 1994;264:703–707. - PubMed
    1. Futterer A, Mink K, Luz A, Kosco-Vilbois MH, Pfeffer K. The lymphotoxin beta receptor controls organogenesis and affinity maturation in peripheral lymphoid tissues. Immunity. 1998;9:59–70. - PubMed
    1. Honda K, et al. Molecular basis for hematopoietic/mesenchymal interaction during initiation of Peyer’s patch organogenesis. J Exp Med. 2001;193:621–630. - PMC - PubMed

Publication types