. 2015 Feb;16(2):197-206.
doi: 10.1038/ni.3053. Epub 2014 Dec 15.

Dynamic expression of transcription factors T-bet and GATA-3 by regulatory T cells maintains immunotolerance

Affiliations

Dynamic expression of transcription factors T-bet and GATA-3 by regulatory T cells maintains immunotolerance

Fang Yu et al. Nat Immunol. 2015 Feb.

Abstract

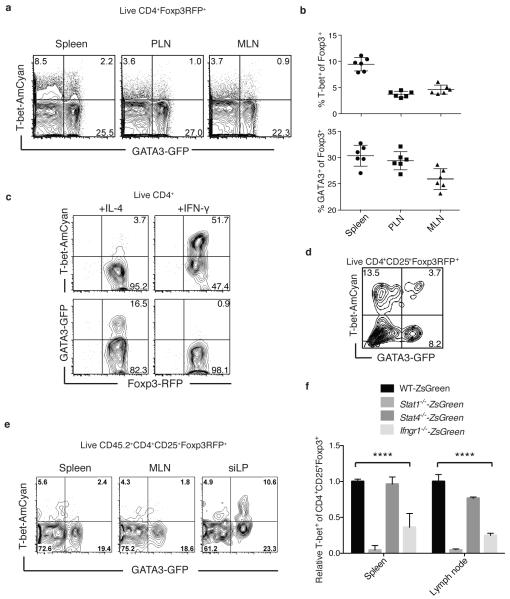
Regulatory T cells (Treg cells) can express the transcription factors T-bet and GATA-3, but the function of this expression and whether such cells represent stable subsets is still unknown. By using various reporter tools, we found that the expression of T-bet and GATA-3 in Treg cells was dynamically influenced by the cytokine environment. Treg cell-specific deletion of the gene encoding either T-bet (Tbx21) or GATA-3 (Gata3) alone did not result in loss of Treg cell function; however, mice with combined deficiency in both genes in Treg cells developed severe autoimmune-like diseases. Loss of Treg cell function correlated with upregulation of expression of the transcription factor RORγt and reduced expression of the transcription factor Foxp3. Thus, in the steady state, activated Treg cells transiently upregulated either T-bet or GATA-3 to maintain T cell homeostasis.


Figures

Figure 1
Figure 1
T-bet and GATA3 expression in Treg cells can be induced by cytokines. (a) Flow cytometric analysis of T-bet and GATA3 expressing Treg cells ex vivo isolated from spleen, peripheral (PLN) and mesenteric lymph node (MLN) of the T-bet-AmCyan:GATA3-GFP:Foxp3-RFP tri-color reporter mice. Plots were gated on the CD4+CD25+Foxp3RFP+ population. (b) Graphical summary of the data in (a) showing percentage of T-bet+GATA3 (top panel) and T-betGATA3+ (bottom panel) Treg cells in the spleen, PLN and MLN. Each dot represents an individual mouse. (c) Sorted Foxp3RFP+T-betAmCyanGATA3GFP Treg cells (harvested from 3 mice) were cultured with plate-bound anti-CD3+anti-CD28 and IL-2 in the presence of either IL-4 or IFN-γ for 4 days. Flow cytometric analysis of T-bet and GATA3 expressing Treg cells was carried out. Data are representative of three independent experiments with a single culture for each condition. (d) Flow sorted Foxp3RFP+T-betAmCyanGATA3GFP Treg cells (harvested from 3 mice) were transferred into Rag1−/− mice. T-bet and GATA3 expressing Treg cells from MLN were analyzed by flow cytometry 2 weeks later. Data are representative of two independent experiments with 2 mice each. (e) Sorted Foxp3RFP+T-betAmCyanGATA3GFP Treg cells (harvested from 3 mice) were cotransferred with congenic naive CD45.1+CD4+CD25CD45RBhi T cells into Rag1−/− mice. T-bet and GATA3 expressing Treg cells from spleen, MLN and small intestine lamina propria (siLP) were analyzed by flow cytometry 8 weeks later. Data are representative of two independent experiments with 4-5 mice each. (f) Graph depicts the relative proportion of T-bet-ZsGreen+CD25+Foxp3+ T among the CD25+ reg Foxp3+ cells in spleen and lymph nodes of wild type T-bet-ZsGreen, Stat1−/−-T-bet-ZsGreen, Stat4−/−-T-bet-ZsGreen and IFN-gr1−/−-T-bet-ZsGreen mice. Values from wild-type group are set as 1. Data are representative of two independent experiments. Error bars represent standard deviation of the mean (n=3 each group). Statistical significance was determined by an ordinary one-way ANOVA. ****p<0.0001.
Figure 2
Figure 2
Dynamic expression of T-bet or GATA3 in Treg cells in vitro and in vivo. (a) Flow sorted Foxp3RFP+T-betAmCyanGATA3GFP+ Treg cells (harvested from 3 mice) were cultured with plate-bound anti-CD3+anti-CD28 and IL-2, in the presence (right panel) or absence of exogenous TGF-β (left panel) for 4 days. IL-4 or IFN-γ was added into some culture as indicated. Flow cytometric analysis of T-bet and GATA3 expressing Treg cells are shown. Data are representative of three independent experiments with a single culture for each condition. (b) Flow sorted Foxp3RFP+T-betAmCyan+GATA3GFP Treg cells (harvested from 3 mice) were cultured in the medium with plate-bound anti-CD3+anti-CD28, and IL-2 in the presence of TGF-β for 4 days. IL-4 or IFN-γ was added in some culture as indicated. T-bet and GATA3 expression in Treg cells was analyzed by flow cytometry. Data are representative of three independent experiments with a single culture for each condition. (c) Sorted Foxp3RFP+T-betAmCyanGATA3GFP+ Treg cells (harvested from 3 mice) were transferred into Rag1−/− mice. T-bet and GATA3 expressing Treg cells from MLN were analyzed by flow cytometry two weeks later. Data are representative of two independent experiments with 2 mice each. (d) Sorted Foxp3RFP+T-betAmCyanGATA3GFP+ (three left panels) or Foxp3RFP+T-betAmCyan+GATA3GFP (three right panels) Treg cells (harvested from 3 mice) were cotransferred with congenic naive CD45.1+CD4+CD25CD45RBhi T cells into Rag1−/− mice. T-bet and GATA3 expressing Treg cells from spleen, MLN and siLP were nalyzed by flow cytometry 8 weeks later. Data are representative of two independent experiments with 4-5 mice each.
Figure 3
Figure 3
Dynamic expression of T-bet in Treg cells is confirmed by the T-bet fate-mapping tool. (a) Illustration of the tamoxifen-inducible T-bet fate-mapping mice (T-bet-ZsGreen-T2A-CreERT2 X Rosa26-loxP-STOP-loxP-tdTomato). (a-d) Tamoxifen was injected intraperitoneally (i.p.) into T-bet-fate-mapping mice on day 0, and then cells were analyzed on day 7. Flow cytometric analyses of ZsGreen and tdTomato expression in CD8+CD44hi cells isolated from spleen of tamoxifen-treated and untreated T-bet fate-mapping mice are shown (a). Flow cytometric analyses of ZsGreen and tdTomato expression in CD4+CD25+ Treg cells isolated from spleen, PLN and MLN of tamoxifen-treated T-bet fate-mapping mice (n=3) are shown (b). ZsGreen+tdTomato+ indicates T-bet-expressing cells, and ZsGreentdTomato+ indicates T-bet-expressed cells. The percentages of ZsGreen+ cells among the tdTomato+ cells within NK, CD8, conventional CD4 and Treg cells in the spleen were plotted (c). CXCR3 expression on each Treg population was assessed by surface staining (d). (e) Sorted CD4+CD25+ZsGreen+ Treg cells from three T-bet fate-mapping mice were cotransferred with congenic naive CD45.1+CD4+CD25CD45RBhi T cells into two Rag1−/−mice treated with tamoxifen. ZsGreen and tdTomato expression by the transferred Treg cells from spleen and MLN were analyzed by flow cytometry 2 weeks later. Data are representative of three (b-d) and two (e) independent experiments with 3-4 mice (b-d) or 2 mice (e) each. Error bars represent standard deviation of the mean (n=3 each group). Statistical significance was determined by a two-tailed unpaired Student’ s t test (c and d). *p<0.05, **p<0.01, ***p<0.001, and ****p<0.0001.
Figure 4
Figure 4
Treg cells singly devoid of either T-bet or GATA3 are functional in protecting against T cell-mediated colitis. (a) Flow cytometric analysis of percentage of CD4+ and CD8+ T cells (upper panel), and percentage of Foxp3+CD4+ Treg cells (bottom panel; plots are gated live CD4+) in the spleens of 8-week old Foxp3-Cre, Tbx21fl/flFoxp3-Cre and Gata3fl/flFoxp3-Cre mice (n=4 each group). (b,c) Rag1−/− mice received congenic CD45.1+CD4+CD25CD45RBhi (CD45.1-naive) cells alone or in combination with CD4+CD25+YFP+ T cells from 8 weeks-old Foxp3-Cre, Tbx21fl/fl reg Foxp3-Cre and Gata3fl/flFoxp3-Cre mice. Mice were weighed weekly (b). Photographs of representative colon thickening from Rag1−/− mice 8 weeks after transfer are shown (b). Graphical representation of absolute number of congenic CD45.1+CD4+ effector cells harvested from the siLP (c). (d) Sorted CD4+CD25+Foxp3-YFP+ Treg cells from Foxp3-Cre, Tbx21fl/flFoxp3-Cre, or Gata3fl/flFoxp3-Cre mice were cultured with plate-bound anti-CD3+anti-CD28 and IL-2 in the presence of either IL-4 or IFN-γ for 4 days. Flow cytometric analysis of T-bet and GATA3 expression was carried out. Data are representative of two (a-d) independent experiments. Error bars represent standard deviation of the mean (n=4 for a; n=5 for b and c). Statistical significance was determined by an ordinary one-way ANOVA. ns indicates p value has no significant difference.
Figure 5
Figure 5
Ablation of both T-bet and GATA3 in Treg cells results in autoimmune lymphoproliferative disease. (a) Splenomegaly and lymphoid hyperplasia in superficial cervical lymph nodes in an 8-week old Tbx21fl/flGata3fl/flFoxp3-Cre (DKO) mouse in comparison with its littermate (Tbx21fl/flGata3fl/+Foxp3-Cre). Every DKO mouse (more than 20 analyzed at 8-13 weeks of age) displayed splenomegaly and lymphadenopathy. (b) Spleen and lymph node cellularity in Foxp3-Cre and DKO mice (n=6). (c) Flow cytometric analysis of CD44 and CD62L expression on CD4+Foxp3 T cells from spleen and MLN of 8-week-old Foxp3-Cre and DKO mice (n=6). (d) Representative pictures with hematoxylin and eosin (H&E)-staining of the tissue sections (liver and small intestine) from an 8-week old littermate and DKO mouse are shown. Original magnification, 200X. (e) Flow cytometric analysis of IL-4, IL-17A and IFN-γ production by CD4+CD44hiFoxp3 T cells from spleen and lymph node of the Foxp3Cre and DKO mice (8-13 weeks old, n=6) stimulated with plate-bound anti-CD3 and anti-CD28. (f) Analysis of IgE concentration in the sera of 8-week old Foxp3-Cre, DKO, Tbx21fl/flFoxp3-Cre or Gata3fl/flFoxp3-Cre mice (n=4). Relative OD450 reads of IgG1 and IgG2a in the sera of DKO, Tbx21fl/flFoxp3-Cre or Gata3fl/flFoxp3-Cre mice compared to the Foxp3-Cre group are shown. (g) Histogram plots show the expression of Foxp3 in splenic CD4+ T cells from different mice. (h,i) Rag1−/− mice received splenocytes of the Foxp3-Cre or DKO mice. Mice were weighed weekly (h). Percentages of Foxp3+CD4+ cells among the total CD4+ cells (left panel) and percentages of RORγt+ cells among the Foxp3+CD4+ Treg cells (right panel) from the spleen and MLN 10 weeks after transfer were plotted (i). Data represent three (b, c, e) and two (f-i) independent experiments. Error bars represent standard deviation of the mean (n=6 for b, c, e; n=4 for f, h and i). Statistical significance was determined by a two-tailed unpaired Student’ s t test (b, c, e, h and i) or an ordinary one-way ANOVA (f). ns indicates p value has no significant difference, *p<0.05, **p<0.01, ***p<0.001, and ****p<0.0001.
Figure 6
Figure 6
T-bet and GATA3 double-deficient Treg cells do not suppress colitis. (a-f) Rag1−/− mice received congenic CD45.1+CD4+CD25CD45RBhi (CD45.1-naive) alone or in combination with CD4+CD25+YFP+ Treg cells from Foxp3-Cre or DKO mice. Mice were weighed weekly (a). Colon samples taken for H&E staining (b). Original magnification, 100X. Graphical representation of absolute number of congenic CD45.1+CD4+ T cells harvested from the siLP (c). Percentages of Foxp3+ cells among the CD4+CD45.2+ population (d) and percentages of RORγt+ cells among the Foxp3+CD4+CD45.2+ population (e) harvested from spleen and MLN of Rag1−/− mice are shown. Histogram plots show IL-17A expression in DKO and control Foxp3Cre Treg cells (f, left panels) harvested from spleen and MLN of Rag1−/− mice received CD45.1-naive in combination with Treg cells from Foxp3Cre, and with DKO Treg. Graphical representation of percentage of IL-17A+ cells among the Foxp3+ Treg cells in the spleen and MLN (f, right panels). Data are representative of three independent experiments (a-f). Error bars represent standard deviation of the mean (n=5). Statistical significance was determined by a two-tailed unpaired Student’ s t test (a, d, e and f) or an ordinary one-way ANOVA (b). *p<0.05, **p<0.01, ***p<0.001 and ****p<0.0001.
Figure 7
Figure 7
The dysfunction of DKO Treg cells is cell intrinsic. (a-c) Bone marrow cells from Foxp3-Cre, DKO, Tbx21fl/flFoxp3-Cre or Gata3fl/flFoxp3-Cre mice mixed with bone marrow cells from CD45.1 congenic mice were co-transferred into irradiated Rag1−/− mice. 8 weeks after reconstitution, cells were harvested from spleen and MLN of chimeric mice and stained with congenic markers CD45.1 and CD45.2 together with a cocktail of antibodies as indicated. Graphical representation of percentage of Foxp3+ Treg cells among the CD45.2+CD4+ cells in the spleen and MLN (a). Graphical representation of Foxp3 MFI (upper panel) and of percentage of RORγt+ cells (lower panel) among the Foxp3+CD45.2+CD4+ Treg cells in the spleen (b). Plots show co-expression of RORγt with Foxp3 or CD44 by the Foxp3+CD45.2+CD4+ Treg cells (c). Plots show intracellular IL-17A staining of the Foxp3+CD45.2+CD4+ Treg cells after plate-bound anti-CD3 and anti-CD28 stimulation (d, left panels). Graphical representation of percentage of IL-17A+ cells among the Foxp3+CD45.2+CD4+ Treg cells from the spleen of chimeric mice (d, right panel). Data are representative of three independent experiments (a-d). Error bars represent standard deviation of the mean (n=4). Statistical significance was determined by an ordinary one-way ANOVA. **p<0.01 and ****p<0.0001.

References

    1. Zhu J, Yamane H, Paul WE. Differentiation of effector CD4 T cell populations. Annual review of immunology. 2010;28:445–489. - PMC - PubMed
    1. Lazarevic V, Glimcher LH, Lord GM. T-bet: a bridge between innate and adaptive immunity. Nature reviews. 2013;13(11):777–789. - PMC - PubMed
    1. Yagi R, Zhu J, Paul WE. An updated view on transcription factor GATA3-mediated regulation of Th1 and Th2 cell differentiation. Int Immunol. 2011;23(7):415–420. - PMC - PubMed
    1. Ivanov II, McKenzie BS, Zhou L, Tadokoro CE, Lepelley A, Lafaille JJ, et al. The orphan nuclear receptor RORgammat directs the differentiation program of proinflammatory IL-17+ T helper cells. Cell. 2006;126(6):1121–1133. - PubMed
    1. Hwang ES, Szabo SJ, Schwartzberg PL, Glimcher LH. T helper cell fate specified by kinase-mediated interaction of T-bet with GATA-3. Science (New York, NY. 2005;307(5708):430–433. - PubMed

Publication types

Substances