. 2014 Dec 11;10(12):e1004868.
doi: 10.1371/journal.pgen.1004868. eCollection 2014 Dec.

Genome-wide analysis of DNA methylation dynamics during early human development

Affiliations

Genome-wide analysis of DNA methylation dynamics during early human development

Hiroaki Okae et al. PLoS Genet. .

Abstract

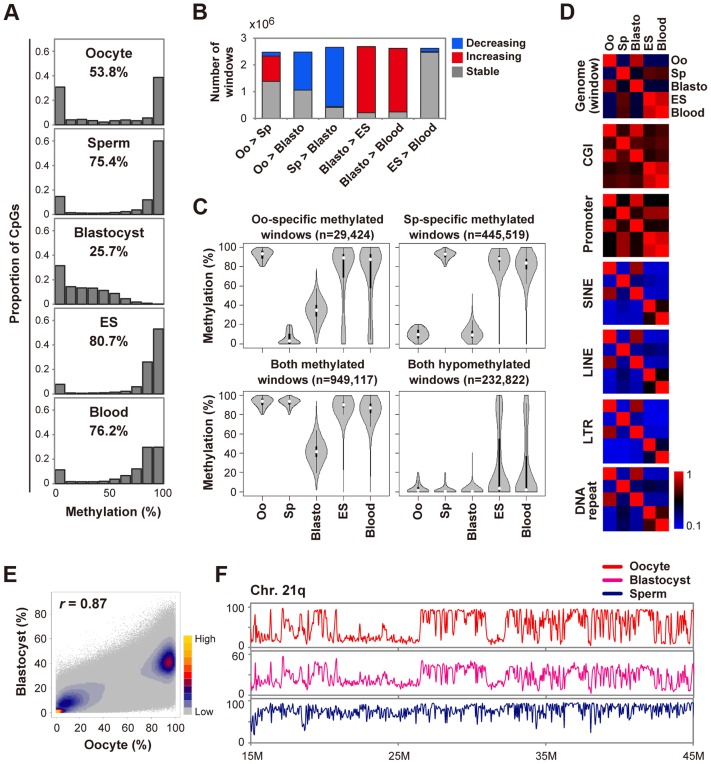
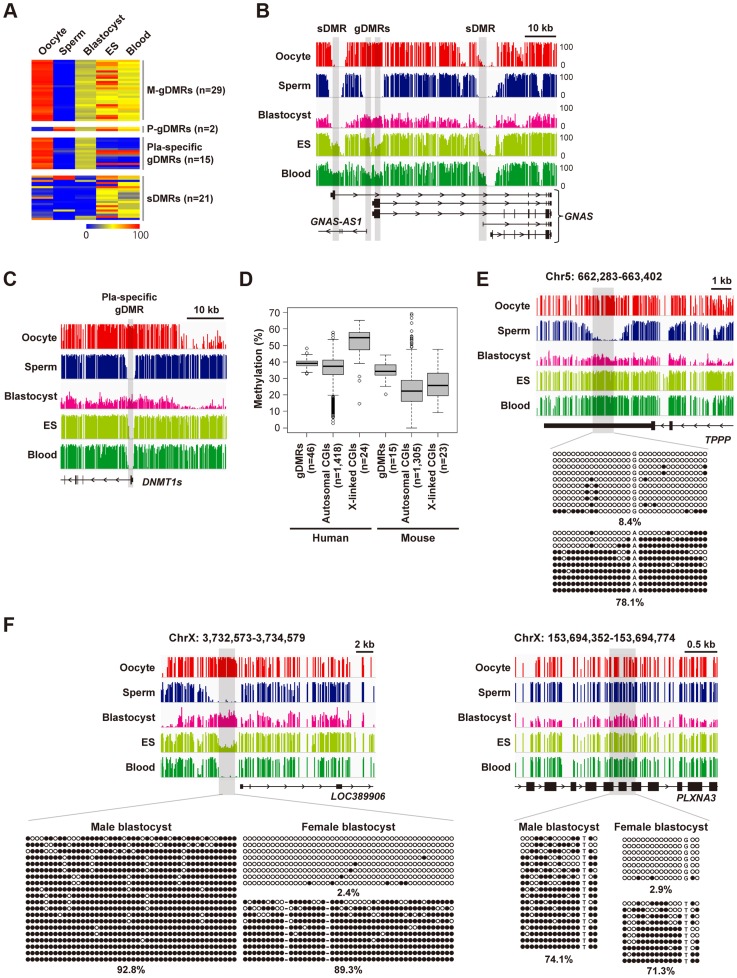
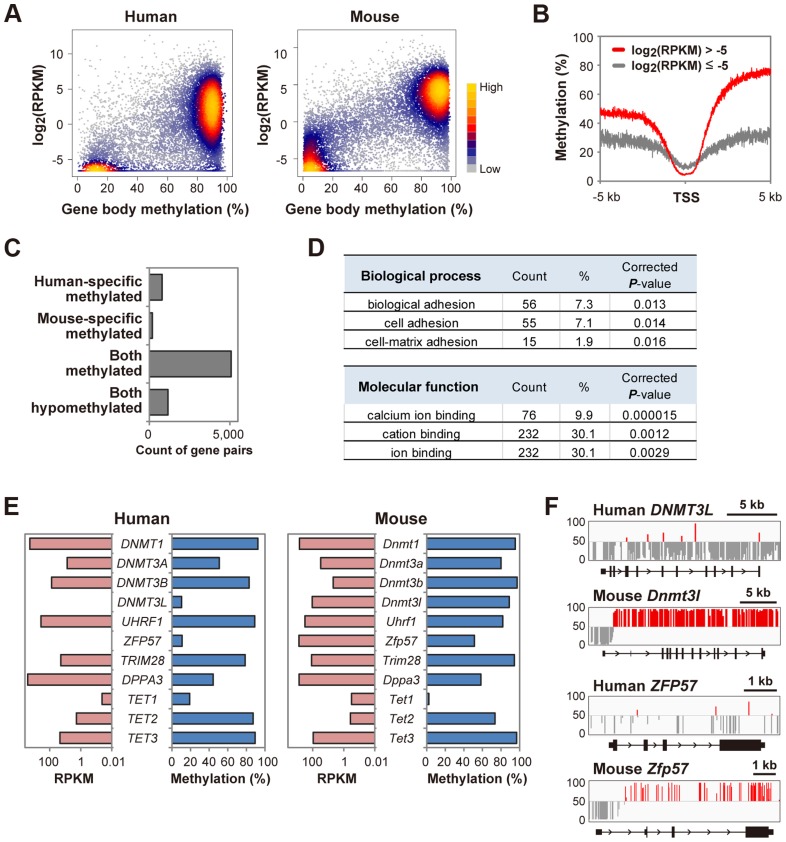
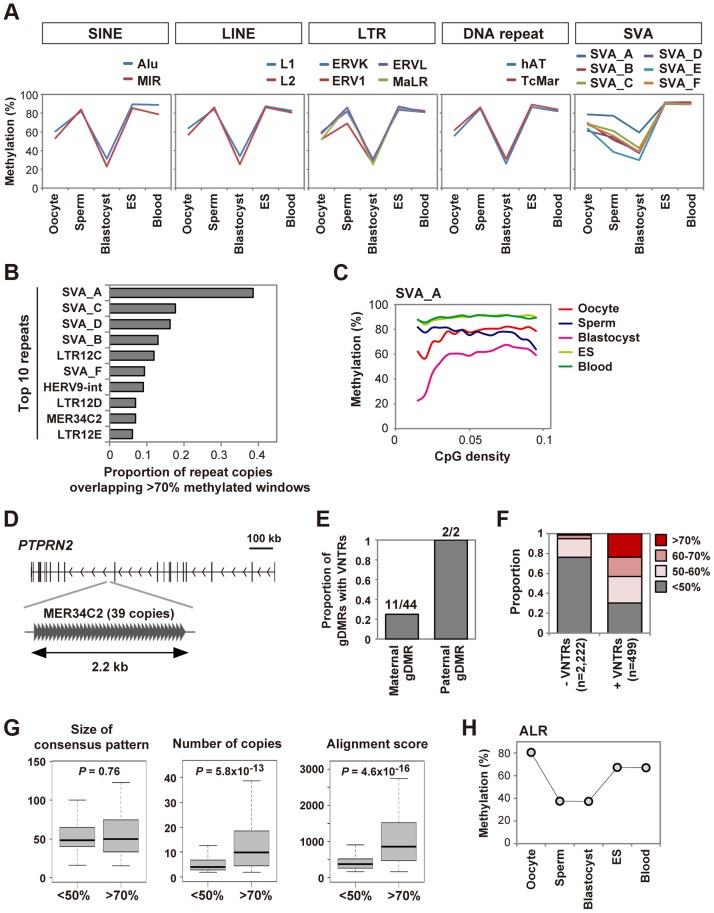
DNA methylation is globally reprogrammed during mammalian preimplantation development, which is critical for normal development. Recent reduced representation bisulfite sequencing (RRBS) studies suggest that the methylome dynamics are essentially conserved between human and mouse early embryos. RRBS is known to cover 5-10% of all genomic CpGs, favoring those contained within CpG-rich regions. To obtain an unbiased and more complete representation of the methylome during early human development, we performed whole genome bisulfite sequencing of human gametes and blastocysts that covered>70% of all genomic CpGs. We found that the maternal genome was demethylated to a much lesser extent in human blastocysts than in mouse blastocysts, which could contribute to an increased number of imprinted differentially methylated regions in the human genome. Global demethylation of the paternal genome was confirmed, but SINE-VNTR-Alu elements and some other tandem repeat-containing regions were found to be specifically protected from this global demethylation. Furthermore, centromeric satellite repeats were hypermethylated in human oocytes but not in mouse oocytes, which might be explained by differential expression of de novo DNA methyltransferases. These data highlight both conserved and species-specific regulation of DNA methylation during early mammalian development. Our work provides further information critical for understanding the epigenetic processes underlying differentiation and pluripotency during early human development.


Conflict of interest statement

The authors have declared that no competing interests exist.

Figures

Figure 1
Figure 1. Global changes of DNA methylation during early human development.
A, Distribution of methylation levels of individual CpGs. The mean methylation levels of CpGs are also indicated. We included human H9 ES cells (GEO accession number: GSM706059) for comparison. B, Detection of dynamic methylation changes using a sliding window (window size  = 20 CpGs, step size  = 10 CpGs). Windows were classified as increasing (or decreasing) if the methylation levels increased (or decreased) by>20% and the changes were significant (BH-corrected P<0.05). The other windows were classified as stable. Oo: Oocyte; Sp: Sperm; Blasto: Blastocyst. C, Violin plots of mean methylation levels of windows hypermethylated (≥80%) or hypomethylated (≤20%) in one or both gametes. Oo-specific (Sp-specific) methylated windows are defined as windows hypermethylated in oocytes (sperm) and hypomethylated in sperm (oocytes). Thin and thick lines are box plots and white dots indicate the median. D, Heatmaps of Pearson correlation coefficients. Correlation coefficients were calculated based on the mean methylation levels of individual windows, CGIs, promoters and repeat copies. Correlation coefficients are color-coded as shown. E, A density scatterplot of mean methylation levels of the sliding windows. The Pearson correlation coefficient between oocytes and blastocysts was high (r = 0.87). The density is color-coded as indicated. F, Methylation levels across the long arm of chromosome 21 (smoothed using 50 kb non-overlapping windows). Similar methylation patterns were observed for oocytes and blastocysts whereas the methylation levels of blastocysts were low (note that the vertical maximum scale is 60% for blastocysts).
Figure 2
Figure 2. Establishment and maintenance of imprinted DMRs.
A, A heatmap of mean methylation levels of imprinted DMRs. We classified the 67 known human imprinted DMRs , and found that 44 were maternal germline DMRs (M-gDMRs), 2 were paternal germline DMRs (P-gDMRs) and 21 were secondary DMRs (sDMRs). 15 M-gDMRs are reported to be maintained only in the placenta and shown as “Pla-specific gDMRs”. gDMRs other than placenta-specific ones showed 35–65% methylation levels in blood cells but the intermediate methylation levels were not well maintained in ES cells (11/31 showed>75% methylation). Methylation levels are color coded as indicated. The raw data are shown in S1 Table. B, Methylation patterns at the human GNAS locus. The vertical axis indicates the methylation level (%). In this locus, there were two gDMRs and two sDMRs. All DMRs overlap promoter regions. C, Methylation patterns at the human DNMT1 locus. The promoter region of the somatic isoform of DNMT1 (DNMT1s) is known to show maternal allele-specific methylation in the placenta . The DNMT1 DMR was hypomethylated in both ES and blood cells, suggesting placenta-specific protection of the maternal allele from demethylation. D, Box plots of mean methylation levels of gDMRs and oocyte-specific methylated CGIs in blastocysts. Boxes represent lower and upper quartiles and horizontal lines indicate the median. Whiskers extend to the most extreme data points within 1.5 times the interquartile range from the boxes. The open circles indicate the data points outside the whiskers. Methylation levels of mouse gDMRs and oocyte-specific methylated CGIs are shown for comparison. E, Methylation patterns of an oocyte-specific methylated CGI. A single blastocyst was used for the analysis. Black and white circles indicate methylated and unmethylated residues, respectively. The percentages of methylated CpG sites are indicated. F, Bisulfite sequencing analyses of X-linked CGIs hypermethylated in oocytes. A single blastocyst was used for each bisulfite sequencing analysis.
Figure 3
Figure 3. A bimodal gene body methylation pattern associated with transcription in human oocytes.
A, A density scatterplot of gene body methylation levels and transcription levels in human oocytes. The data of mouse oocytes , are also shown for comparison. Only genes longer than 5 kb were analyzed. For genes with RPKM less than 0.01, RPKM was set as 0.01. The density is color-coded as indicated. B, Mean methylation levels within 5 kb of transcription start sites (TSS) in human oocytes. Genes (>5 kb) were classified into two groups (log2(RPKM)>−5 and ≤−5). Methylation levels were smoothed using 5 bp non-overlapping sliding windows. C, Conservation of gene body methylation levels between human and mouse oocytes. 783 and 188 genes showed human-specific and mouse-specific gene body hypermethylation, respectively. 5076 and 1151 genes were hypermethylated and hypomethylated in both types of oocytes, respectively. The raw data are shown in S2 Table. D, GO analysis of 783 genes with human-specific gene body hypermethylation. The top three GO terms (biological process and molecular function) are indicated with gene counts, the proportion (%) and BH-corrected P-values. No GO term was enriched in genes with mouse-specific gene body hypermethylation. E, Gene body methylation levels and transcription levels of DNA methylation regulators in human and mouse oocytes. DNMT3L and ZFP57 showed gene body hypomethylation and were not expressed (RPKM<0.01) in human oocytes. DNMT3B (RPKM = 76.0) showed 10-fold higher expression than DNMT3A (RPKM = 7.6) in human oocytes. In contrast, Dnmt3b (RPKM = 4.9) showed ∼6-fold lower expression than Dnmt3a (RPKM = 30.6) in mouse oocytes. F, Methylation patterns at human DNMT3L and ZFP57 loci and mouse Dnmt3l and Zfp57 loci. The vertical line indicates the methylation level (%) and the baseline is set at 50% to highlight unmethylated CpGs. CpGs with>50% and <50% methylation are shown in red and grey, respectively.
Figure 4
Figure 4. Unique regulation of tandem repeat-containing regions.
A, DNA methylation dynamics of transposable elements. Mean methylation levels of CpGs in various classes of SINEs, LINEs, LTRs and DNA repeats and SVA subfamilies are shown. SVA_A showed an especially high methylation level in blastocysts (59.2%). B, Proportions of repeat copies overlapping>70% methylated windows in human blastocysts. We analyzed only SINEs, LINEs, LTRs, DNA repeats, SVAs and satellites with>100 copies in the human genome. The top ten repeat names with the highest proportions are shown. The raw data are shown in S4 Table. C, Relationships between methylation levels and CpG densities. Mean methylation levels of CpGs in SVA_A are plotted against CpG densities. D, MER34C2 copies overlapping>70% methylated windows in human blastocysts. 39 MER34C2 copies are all tandemly repeated within the PTPRN2 gene locus. E, Proportions of maternal and paternal gDMRs containing VNTRs. Counts of gDMRs with VNTRs and total gDMRs are indicated. F, Proportions of mean methylation levels of CGIs with and without VNTRs in human blastocysts. Only autosomal CGIs hypermethylated in both gametes were analyzed. 118 of 499 CGIs with VNTRs and 31 of 2,222 CGIs without VNTRs showed>70% methylation (P = 0, chi-square test). G, Characteristics of VNTRs highly methylated in blastocysts. Using Tandem Repeats Finder , the size of the consensus pattern, the number of tandemly aligned copies and the alignment score were compared between VNTRs of <50% methylated CGIs and>70% methylated CGIs shown in (F). The alignment score calculated by Tandem Repeat Finder reflects the degree of similarity between repeat copies. When several VNTRs were found in a CGI, the VNTR with the highest alignment score was analyzed. Boxes represent lower and upper quartiles and horizontal lines indicate the median. Whiskers extend to the most extreme data points within 1.5 times the interquartile range from the boxes. The Mann-Whitney U test was used to calculate P-values. No sequence motif was found among the consensus patterns of the>70% methylated CGIs using DREME . H, Mean methylation levels of CpGs in ALR. Oocytes showed the highest methylation level (80.6%).

References

    1. Messerschmidt DM, Knowles BB, Solter D (2014) DNA methylation dynamics during epigenetic reprogramming in the germline and preimplantation embryos. Genes Dev 28: 812–828. - PMC - PubMed
    1. Smith ZD, Meissner A (2013) DNA methylation: roles in mammalian development. Nat Rev Genet 14: 204–220. - PubMed
    1. Saitou M, Kagiwada S, Kurimoto K (2012) Epigenetic reprogramming in mouse pre-implantation development and primordial germ cells. Development 139: 15–31. - PubMed
    1. Smallwood SA, Tomizawa S, Krueger F, Ruf N, Carli N, et al. (2011) Dynamic CpG island methylation landscape in oocytes and preimplantation embryos. Nat Genet 43: 811–814. - PMC - PubMed
    1. Kobayashi H, Sakurai T, Imai M, Takahashi N, Fukuda A, et al. (2012) Contribution of intragenic DNA methylation in mouse gametic DNA methylomes to establish oocyte-specific heritable marks. PLoS Genet 8: e1002440. - PMC - PubMed

Publication types