. 2015 Jan;21(1):76-80.
doi: 10.1038/nm.3710. Epub 2014 Dec 15.

Inducible depletion of satellite cells in adult, sedentary mice impairs muscle regenerative capacity without affecting sarcopenia

Affiliations

Inducible depletion of satellite cells in adult, sedentary mice impairs muscle regenerative capacity without affecting sarcopenia

Christopher S Fry et al. Nat Med. 2015 Jan.

Abstract

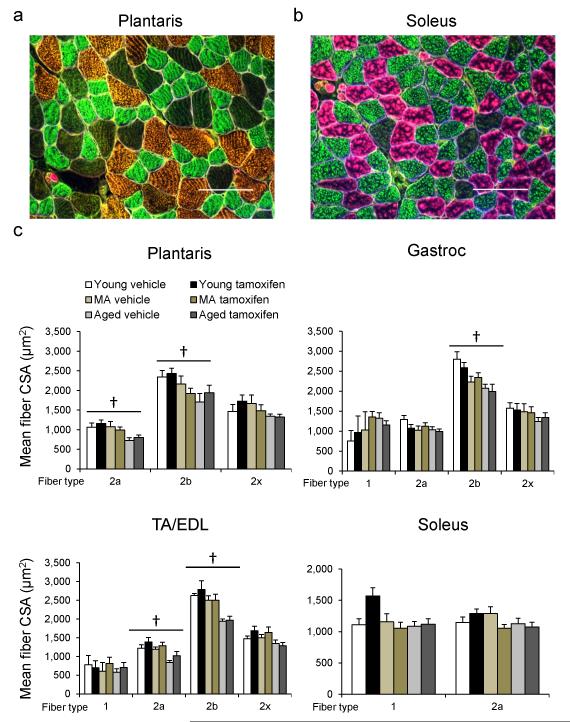
A key determinant of geriatric frailty is sarcopenia, the age-associated loss of skeletal muscle mass and strength. Although the etiology of sarcopenia is unknown, the correlation during aging between the loss of activity of satellite cells, which are endogenous muscle stem cells, and impaired muscle regenerative capacity has led to the hypothesis that the loss of satellite cell activity is also a cause of sarcopenia. We tested this hypothesis in male sedentary mice by experimentally depleting satellite cells in young adult animals to a degree sufficient to impair regeneration throughout the rest of their lives. A detailed analysis of multiple muscles harvested at various time points during aging in different cohorts of these mice showed that the muscles were of normal size, despite low regenerative capacity, but did have increased fibrosis. These results suggest that lifelong reduction of satellite cells neither accelerated nor exacerbated sarcopenia and that satellite cells did not contribute to the maintenance of muscle size or fiber type composition during aging, but that their loss may contribute to age-related muscle fibrosis.


Figures

Figure 1
Figure 1. Reduction in satellite cell content leads to impaired regenerative capacity but not accelerated or exacerbated sarcopenia
(a) Tibialis anterior muscles of vehicle- and tamoxifen-treated Pax7CreER-DTA middle aged (MA, 16-18 month) mice following barium chloride (BaCl2) or PBS injection. Hematoxylin and eosin stained cross-sections 7 days after injection. Scale bar = 100 μm. (b) Hind limb muscle (plantaris, gastrocnemius (gastroc), tibialis anterior/extensor digitorum longus (TA/EDL), soleus) wet weights. Data are presented as mean weight (mg) ± SEM. n = 4–8 mice/group. † Significantly different than young mice (P < 0.05), ‡ Significantly different than MA mice (P < 0.05) as measured by a two-way ANOVA (factors: young/aged and vehicle/tamoxifen).
Figure 2
Figure 2. Reduction in satellite cell content throughout the lifespan does not affect mean myofiber cross-sectional area (CSA)
(a) Satellite cell quantification of plantaris, gastrocnemius, TA/EDL and soleus muscles of vehicle- and tamoxifen-treated Pax7CreER-DTA young (5 month) and aged (24 month) mice. Representative images of Pax7+ cells (white arrowheads) co-stained with DAPI. Scale bar = 100 μm. (b) Left panel: Quantification of satellite cell content in hind limb muscles in vehicle-treated mice. Right panel: Quantification of satellite cell content in hind limb muscles in tamoxifen-treated mice. Data are presented as mean satellite cells/fiber/cross-section (CS) ± SEM. (c) Mean fiber CSA of the hind limb muscles. Data are presented as mean fiber CSA ± SEM. N.S. – not significant (P = 0.06). n = 4–8 mice/group. * Significant effect of tamoxifen (P < 0.05), † Significant effect of age (P < 0.05) as measured by a two-way ANOVA (factors: young/aged and vehicle/tamoxifen).
Figure 3
Figure 3. Age-associated fiber type-specific atrophy is unaffected by reduction in satellite cell content
Fiber-type specific cross-sectional area (CSA) of plantaris, gastrocnemius, TA/EDL and soleus muscles of vehicle- and tamoxifen-treated Pax7CreER-DTA young (5 month), middle aged (MA, 16–18 month) and aged (24 month) mice. Representative images from plantaris (a) and soleus (b) showing myosin heavy chain type 1 (pink), 2a (green), 2b (orange) and 2x (unstained) fibers, in addition to dystrophin (white) ringing each fiber. Scale bar = 100 μm. (c) Quantification of mean CSA by fiber type in the hind limb muscles. Mean fiber CSA is provided for fiber types which comprise ≥ 2% of total fibers in a given muscle (see Supplemental Figure 1b for fiber type frequencies). Data are presented as mean fiber CSA ± SEM. n = 3–8 mice/group, † Significant effect of age (P < 0.05) as measured by a two-way ANOVA (factors: young/aged and vehicle/tamoxifen).
Figure 4
Figure 4. Reduced satellite cell content does not affect plantaris myofiber number, myonuclear number or single fiber force production during aging, but contributes to extracellular matrix (ECM) accumulation
Plantaris muscles isolated from young (5 month) and aged (24 month) Pax7CReER-DTA vehicle- and tamoxifen-treated mice. (a) Number of myofibers in whole muscle cross-sections taken at mid-belly of the muscle. Data are presented as mean fiber number ± SEM. n = 5–7 mice/group. (b) Representative image of a single plantaris fiber with nuclei visualized with DAPI. (c) Myonuclear number normalized to myofiber length. Data are presented as mean number of myonuclei per 100 μm ± SEM. n = 40– 60 fibers/group. (d) Quantification of BrdU+/DAPI+ nuclei residing within the dystrophin antibody-labeled sarcolemma of myofibers. All fibers were counted in a cross section taken at mid-belly of the plantaris. Data are presented as % fibers BrdU+ ± SEM. n = 5–8 mice/group. (e) Maximum isometric force normalized to fiber cross-sectional area (specific force, KN/m2) of permeabilized single fibers. Data are presented as mean specific force ± SEM. n = 5 Young vehicle, n = 7 Young tamoxifen, n = 6 Aged vehicle and n = 8 Aged tamoxifen; eight fibers/mouse. Representative images of vehicle- (f) and tamoxifen-treated (g) muscle stained with Sirius Red which binds collagens in the ECM. Scale bar = 100 μm. (h) Quantification of collagen content. Data are presented as mean % of total area ± SEM. n = 3–4 mice/group. * Significant effect of tamoxifen (P < 0.05), † Significant effect of age (P < 0.05) as measured by a two-way ANOVA (factors: young/aged and vehicle/tamoxifen).

Similar articles

Cited by

References

    1. Bortz WM., 2nd A conceptual framework of frailty: a review. J Gerontol A Biol Sci Med Sci. 2002;57:M283–288. - PubMed
    1. Mitchell WK, et al. Sarcopenia, dynapenia, and the impact of advancing age on human skeletal muscle size and strength; a quantitative review. Front Physiol. 2012;3:260. - PMC - PubMed
    1. Garcia-Prat L, Sousa-Victor P, Munoz-Canoves P. Functional dysregulation of stem cells during aging: a focus on skeletal muscle stem cells. FEBS J. 2013;280:4051–4062. - PubMed
    1. Gopinath SD, Rando TA. Stem cell review series: aging of the skeletal muscle stem cell niche. Aging Cell. 2008;7:590–598. - PubMed
    1. Topinkova E. Aging, disability and frailty. Ann Nutr Metab. 2008;52(Suppl 1):6–11. - PubMed

Online Methods References

    1. Nishijo K, et al. Biomarker system for studying muscle, stem cells, and cancer in vivo. FASEB J. 2009;23:2681–2690. - PMC - PubMed
    1. Mula J, Lee JD, Liu F, Yang L, Peterson CA. Automated image analysis of skeletal muscle fiber cross-sectional area. J Appl Physiol. 2013;114:148–155. - PMC - PubMed
    1. Liu F, et al. Automated fiber-type-specific cross-sectional area assessment and myonuclei counting in skeletal muscle. J Appl Physiol. 2013;115:1714–1724. - PMC - PubMed
    1. Mendias CL, Kayupov E, Bradley JR, Brooks SV, Claflin DR. Decreased specific force and power production of muscle fibers from myostatin-deficient mice are associated with a suppression of protein degradation. J Appl Physiol. 2011;111:185–191. - PMC - PubMed

Publication types