. 2014 Dec 12:4:7405.
doi: 10.1038/srep07405.

p38α (MAPK14) critically regulates the immunological response and the production of specific cytokines and chemokines in astrocytes

Affiliations

p38α (MAPK14) critically regulates the immunological response and the production of specific cytokines and chemokines in astrocytes

U Lo et al. Sci Rep. .

Abstract

In CNS lesions, "reactive astrocytes" form a prominent cellular response. However, the nature of this astrocyte immune activity is not well understood. In order to study astrocytic immune responses to inflammation and injury, we generated mice with conditional deletion of p38α (MAPK14) in GFAP+ astrocytes. We studied the role of p38α signaling in astrocyte immune activation both in vitro and in vivo, and simultaneously examined the effects of astrocyte activation in CNS inflammation. Our results showed that specific subsets of cytokines (TNFα, IL-6) and chemokines (CCL2, CCL4, CXCL1, CXCL2, CXCL10) are critically regulated by p38α signaling in astrocytes. In an in vivo CNS inflammation model of intracerebral injection of LPS, we observed markedly attenuated astrogliosis in conditional GFAPcre p38α(-/-) mice. However, GFAPcre p38α(-/-) mice showed marked upregulation of CCL2, CCL3, CCL4, CXCL2, CXCL10, TNFα, and IL-1β compared to p38αfl/fl cohorts, suggesting that in vivo responses to LPS after GFAPcre p38α deletion are complex and involve interactions between multiple cell types. This finding was supported by a prominent increase in macrophage/microglia and neutrophil recruitment in GFAPcre p38α(-/-) mice compared to p38αfl/fl controls. Together, these studies provide important insights into the critical role of p38α signaling in astrocyte immune activation.


Figures

Figure 1
Figure 1. Generation of GFAPCrep38α−/− mice and establishment of highly purified p38α−/− astrocyte cultures.
(A) GFAPCrep38α−/− mice were generated by crossing hGFAP-Cre mice and mice with p38α-floxed alleles. Schematic shows the targeted genetic locus of p38α gene flanked by two loxP sites. Deletion of p38α gene is driven by Cre-loxP recombination that is under the control of hGFAP promoter activity in cells. (B) Genotyping of GFAPcrep38α−/− mice demonstrating homozygosity of p38α-floxed allele and positive expression of hGFAP-Cre transgene. (C) Schematic showing the ROSA26tdTomato reporter system. Under the control of hGFAP promoter, Cre recombination occurs leads to excision of tdTomato(mT) and expression of EGFP(mG) in GFAP-positive cells. This results in the change of membrane-bound red fluorescence (tdTomato) to a membrane-bound green fluorescence (EGFP) in cells. (D) Pure astrocyte cultures established from pups from cross breeds of ROSA26-tdTomato(mT)/EGFP(mG) reporter line and hGFAP-Cre mice. The purity of these astrocyte cultures was verified by the predominance of EGFP-positive astrocytes, with rare occurrence of tdTomato-positive cells (hGFAP-Cre negative; scale bar = 100 μm). (F) In comparison to astrocyte cultures derived from p38αfl/fl mice, western blot analysis confirmed that the p38α protein is absent in p38α−/− astrocyte cultures.
Figure 2
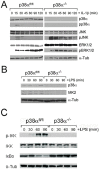
Figure 2. Western blot analysis of p38, JNK, ERK1/2 MAPK, MK2 and NF-κB signaling in p38α−/− and p38αfl/fl astrocytes.
(A) MAPK signaling in p38α−/− astrocytes was examined with western blot analysis after IL-1β treatment. Exposure to IL-1β led to an acute and enhanced activation of JNK phosphorylation in p38α−/− compared to p38αfl/fl astrocytes. Although phosphorylated ERK1/2 was not found in resting p38α−/− astrocytes, IL-1β stimulation resulted in ERK1/2 phosphorylation over time but this phosphorylation remained at lower levels compared to p38αfl/fl controls. (B) The MK2 activation in p38α−/− astrocytes was examined with western blot analysis after LPS treatment. Exposure to LPS stimulation showed reduced expression of MK2 in p38α−/− astrocytes compared to p38αfl/fl astrocytes. (C) The NF-κB activity was examined in p38α−/− astrocytes compared to p38αfl/fl controls in response to LPS stimulation. Immunoblot analysis showed that immune activation by LPS treatment did not induce phosphorylated IκB kinase (p-IKK) protein in p38α−/− astrocytes compared to p38αfl/fl astrocytes and did not induce degradation of IκBα protein in p38α−/− astrocytes compared to p38αfl/fl controls. The gels have been run under the same experimental conditions.
Figure 3
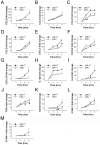
Figure 3. Cytokine, chemokine and cell adhesion molecule expression in p38α−/− astrocytes as compared to p38αfl/fl astrocytes with LPS treatment.
(A) CCL2. (B) CCL3. (C) CCL4. (D) CCL5. (E) CXCL1. (F) CXCL2. (G) CXCL10. (H) IL-1β. (I) IL-6. (J) TNFα. (K) COX-2. (L) ICAM-1. (M) VCAM-1. *p < 0.05 and **p < 0.01; data represent mean ± SEM.
Figure 4
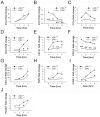
Figure 4. Cytokine, chemokine and cell adhesion molecule expression in p38α−/− astrocytes as compared to p38αfl/fl astrocytes with IL-1β treatment.
(A) CCL2. (B) CCL3. (C) CCL4. (D) CCL5. (E) CXCL1. (F) CXCL2. (G) CXCL10. (H) COX-2. (I) TNFα. (J) IL-6. (K) ICAM-1. (L) VCAM-1. *p < 0.05; data represent mean ± SEM.
Figure 5
Figure 5. Cytokine, chemokine and cell adhesion molecule expression in p38α−/− astrocytes as compared to p38αfl/fl astrocytes with IFNγ treatment.
(A) CCL2. (B) CCL3. (C) CCL4. (D) CCL5. (E) CXCL1. (F) CXCL2. (G) CXCL10. (H) TNFα. (I) ICAM-1. (J) VCAM-1. *p < 0.05; data represent mean ± SEM.
Figure 6
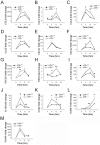
Figure 6. Chemokine, cytokine and cell adhesion molecule expression in the brain of GFAPCre p38α−/− mice as compared to p38αfl/fl mice after intracerebral LPS injection.
(A) CCL2. (B) CCL3. (C) CCL4. (D) CCL5. (E) CXCL1. (F) CXCL2. (G) CXCL10. (H) TNFα. (I) IL-6. (J) IL-1β. (K) COX-2. (L) ICAM-1. (M) VCAM-1. *p < 0.05 and **p < 0.01; data represent mean ± SEM.
Figure 7
Figure 7. Immunostaining and quantification of chemokine and cytokine protein expression in the brain of GFAPCre p38α−/− and p38αfl/fl mice after intracerebral LPS injection.
(A) The immunoreactivity of CCL2, CXCL10 and IL-6 was observed in the increased population of CD68+ cells in the brain of GFAPcre p38α−/− mice compared to p38αfl/fl mice at 6 hours after LPS stimulation. (B) Quantification of immunoreactive cells expressing CCL2, CXCL10 and IL-6 and the expression of CCL2, CXCL10 and IL-6 in the population of CD68+ cells in the brain of GFAPcre p38α−/− mice compared to p38αfl/fl mice at 6 hours after LPS stimulation.
Figure 8
Figure 8. Detection of GFAP expression at the CNS site of injury in GFAPCre p38α−/− mice after intracerebral LPS injection.
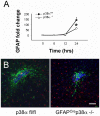
(A) After intracerebral LPS injection, GFAP mRNA was significantly upregulated in both GFAPcre p38α−/− mice and p38αfl/fl cohorts at 24 hours after LPS injection (p<0.05). But comparison between genotypes showed that this increase was significantly lower in GFAPcre p38α−/− mice compared to p38αfl/fl cohorts (p < 0.05). (B) Strongly GFAP-immunoreactive astrocytes (green) characteristic of activation or “astrogliosis” were detected at the LPS injection site. Diffuse activation of Iba1 positive microglia/macrophage (red) was also observed in the proximity of the lesions. In GFAPcrep38α−/− mice, astrocyte activation was markedly attenuated compared to p38αfl/fl cohorts at 24 hours after intracerebral LPS injection. Iba1 positive cells did not show clustering at the site of injury, but rather distributed in the CNS parenchyma. Distribution of Iba1 positive microglia/macrophages was also found prominent in GFAPcrep38α−/− compared to p38αfl/fl mice (scale bar = 100 μm). Representative images from the two genotypes are shown. *p < 0.05; data represent mean ± SEM.
Figure 9
Figure 9. Neutrophil infiltration at the CNS site of injury in GFAPCre p38α−/− mice after intracerebral LPS injection.
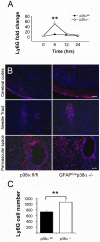
(A) After intracerebral LPS injection, Ly6G mRNA showed significant upregulation in GFAPcre p38α−/− mice at 6 hours (p < 0.05); this upregulation was relatively mild and not significant in p38αfl/fl cohort. A significantly higher Ly6G expression was occurred in GFAPcrep38α−/− mice at 6 hours compared to p38αfl/fl cohorts (p < 0.05). (B) Ly6G positive neutrophils were detected in the cortical region, LPS injection site (scale bar = 100 μm) and perivascular region (scale bar = 50 μm) in the brain parenchyma after intracerebral LPS injection. GFAPcrep38α−/− mice showed marked increases in infiltrating neutrophils in all the three regions examined compared to p38αfl/fl mice. (C) Quantification of Ly6G positive cells showed significantly increased numbers in the brains of GFAPcre p38α−/− mice compared to p38αfl/fl mice. Representative images from the two genotypes are shown. **p < 0.001; data represent mean ± SEM.
Figure 10
Figure 10
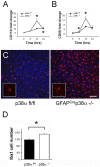
Microglia/macrophages at the CNS site of injury in GFAPCrep38α−/− mice after intracerebral LPS injection (A) After intracerebral LPS injection, CD11b mRNA showed significant upregulation in GFAPcre p38α−/− mice at 12 hours (p < 0.05); this upregulation was relatively moderate and not significant in p38αfl/fl cohorts. Comparison between genotypes showed a significantly higher CD11b expression in GFAPcrep38α−/− mice p38αfl/fl cohorts at 12 hours (p < 0.05). (B) Similarly, CD68 mRNA showed significant upregulation in GFAPcre p38α−/− mice at 12 hours after LPS injection (p < 0.05); this upregulation was relatively moderate and not significant in p38αfl/fl cohorts. Comparison between genotypes showed a significantly higher CD68 expression in GFAPcrep38α−/− mice compared to p38αfl/fl cohorts at 6 and 12 hours (p < 0.05). (C) Iba1 positive cells were distributed in the brain parenchyma and were not particularly clustered at the site of injury. A more prominent distribution of Iba1 positive microglia/macrophages were observed in GFAPcre p38α−/− mice compared to p38αfl/fl cohorts at 24 hours after intracerebral LPS injection (scale bar = 100 μm). (D) Numerical quantification of Iba1 positive cells showed a significant increase in their numbers in GFAPcre p38α−/− mice compared to p38αfl/fl control mice. *p < 0.05; data represent mean ± SEM.

Similar articles

Cited by

References

    1. Bergles D. E., Diamond J. S. & Jahr C. E. Clearance of glutamate inside the synapse and beyond. Curr Opin Neurobiol 9, 293–298 (1999). - PubMed
    1. Nagelhus E. A. et al. Immunogold evidence suggests that coupling of K+ siphoning and water transport in rat retinal Muller cells is mediated by a coenrichment of Kir4.1 and AQP4 in specific membrane domains. Glia 26, 47–54 (1999). - PubMed
    1. Brown A. M. & Ransom B. R. Astrocyte glycogen and brain energy metabolism. Glia 55, 1263–1271 (2007). - PubMed
    1. Piet R., Poulain D. A. & Oliet S. H. Contribution of astrocytes to synaptic transmission in the rat supraoptic nucleus. Neurochem Int 45, 251–257 (2004). - PubMed
    1. Abbott N. J., Ronnback L. & Hansson E. Astrocyte-endothelial interactions at the blood-brain barrier. Nat Rev Neurosci 7, 41–53 (2006). - PubMed

Publication types

MeSH terms