. 2015 Nov;12(6):669-80.
doi: 10.1038/cmi.2014.116. Epub 2014 Dec 15.

Differential expression of the fractalkine chemokine receptor (CX3CR1) in human monocytes during differentiation

Affiliations

Differential expression of the fractalkine chemokine receptor (CX3CR1) in human monocytes during differentiation

Cecilia Analia Panek et al. Cell Mol Immunol. 2015 Nov.

Abstract

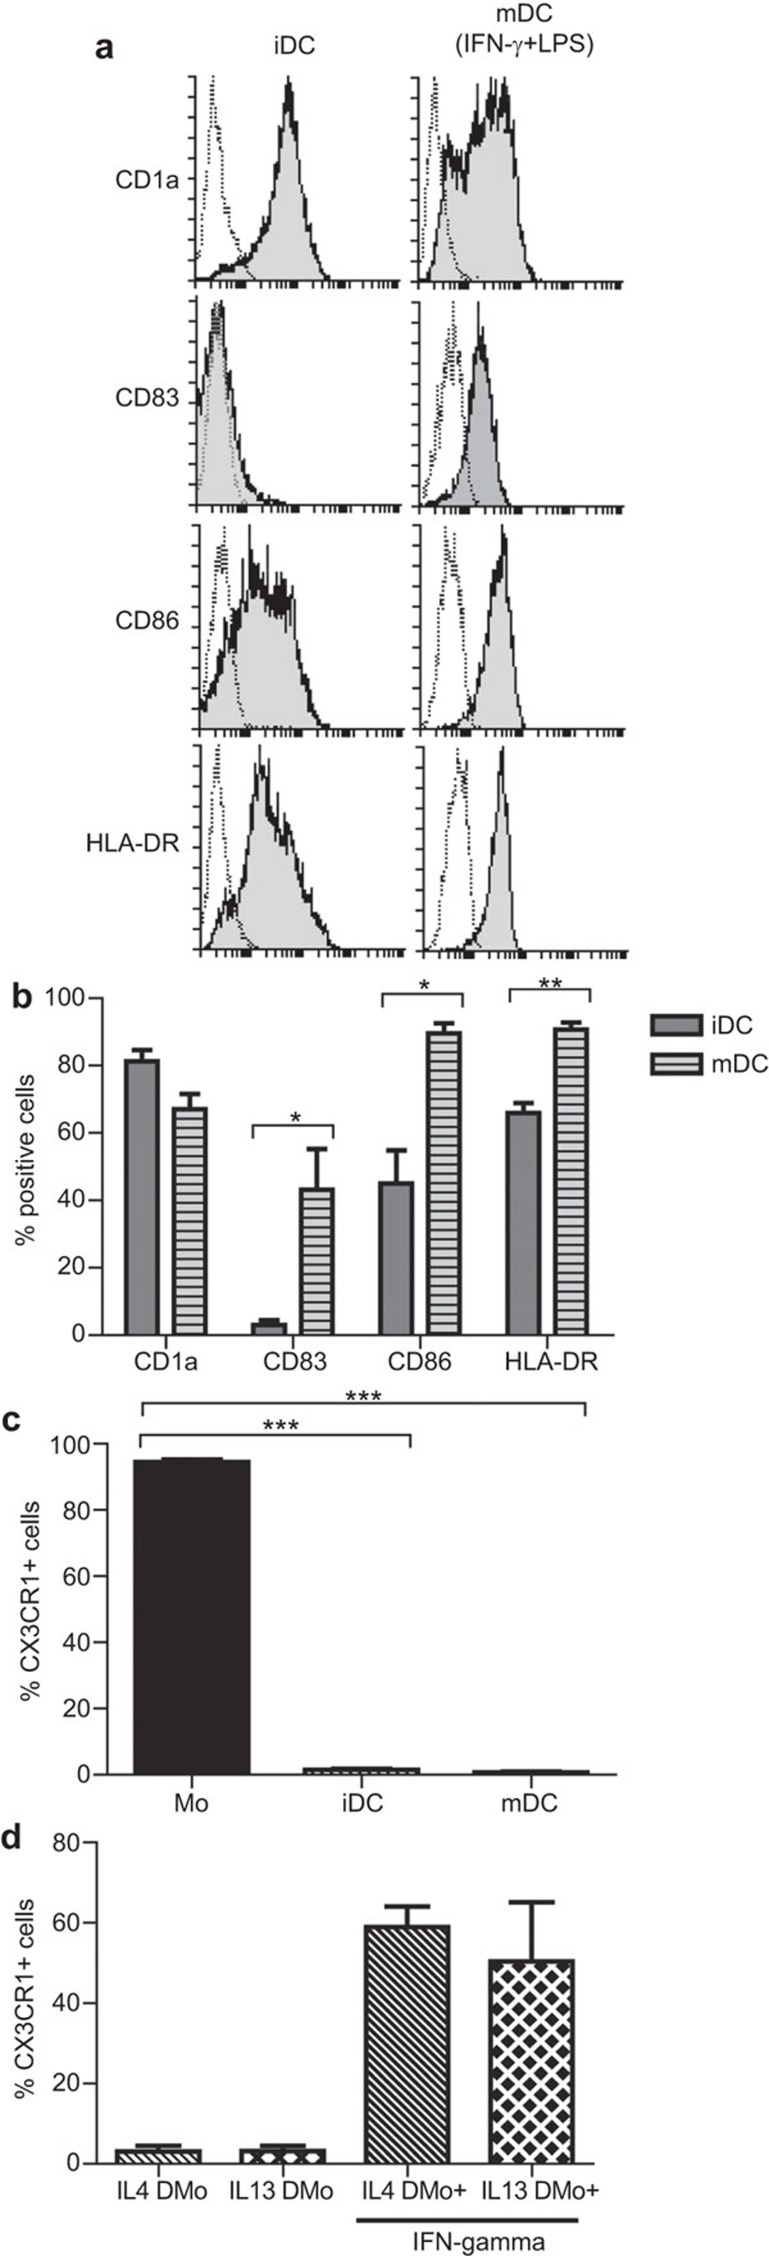
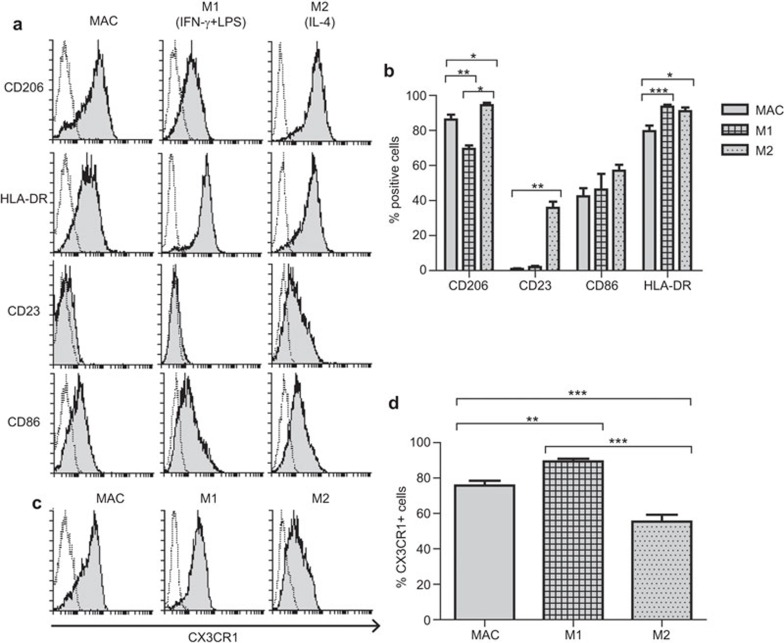
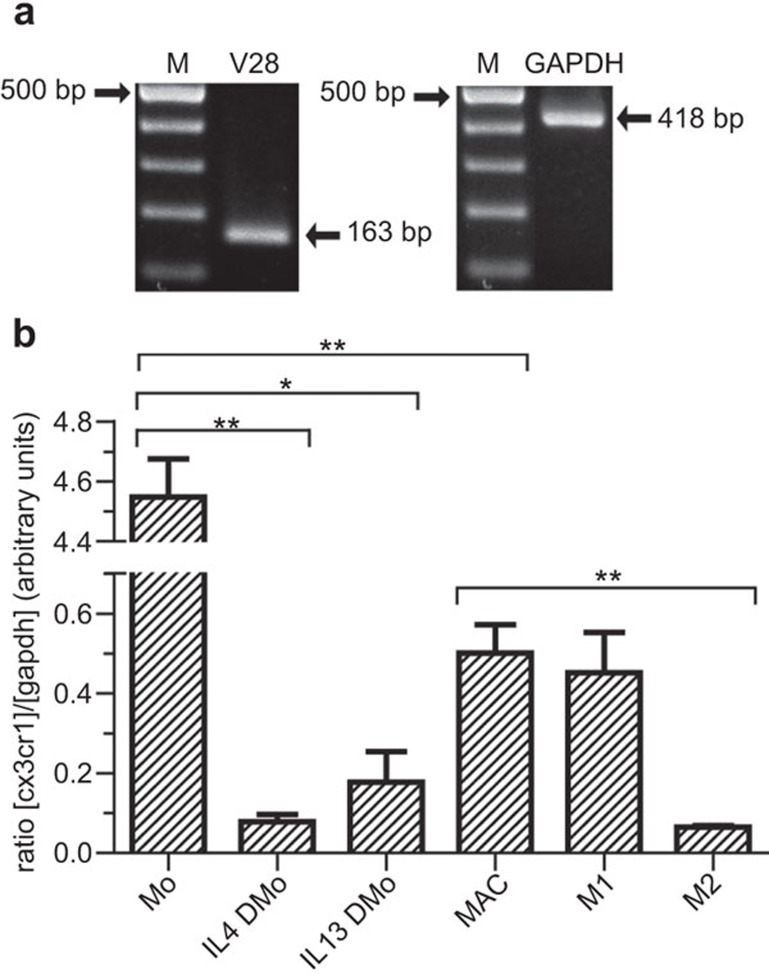
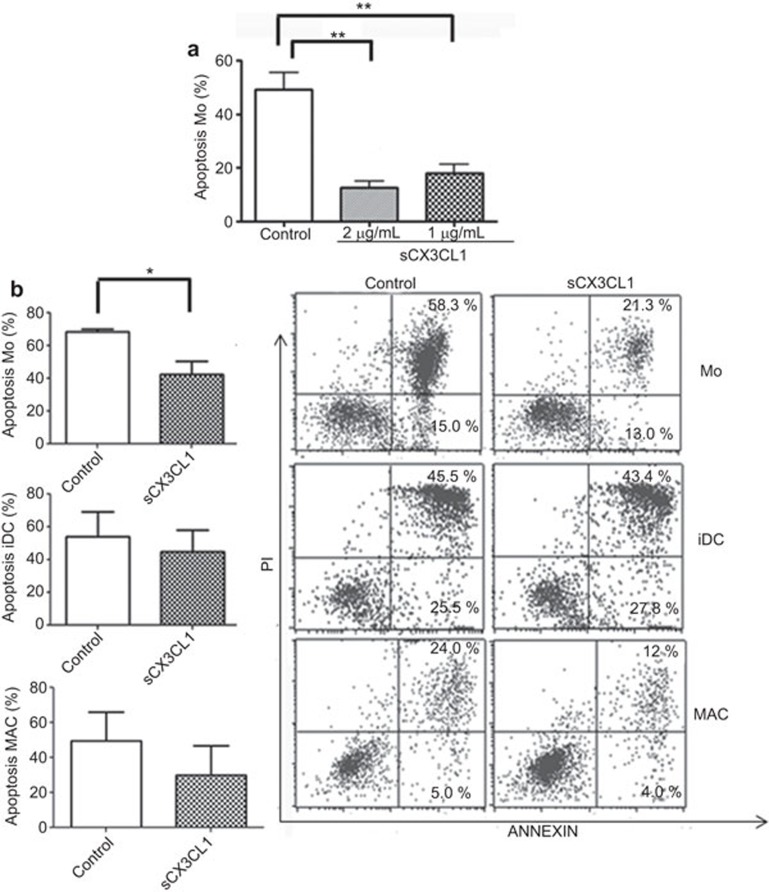
Circulating monocytes (Mos) may continuously repopulate macrophage (MAC) or dendritic cell (DC) populations to maintain homeostasis. MACs and DCs are specialized cells that play different and complementary immunological functions. Accordingly, they present distinct migratory properties. Specifically, whereas MACs largely remain in tissues, DCs are capable of migrating from peripheral tissues to lymphoid organs. The aim of this work was to analyze the expression of the fractalkine receptor (CX3CR1) during the monocytic differentiation process. Freshly isolated Mos express high levels of both CX3CR1 mRNA and protein. During the Mo differentiation process, CX3CR1 is downregulated in both DCs and MACs. However, MACs showed significantly higher CX3CR1 expression levels than did DC. We also observed an antagonistic CX3CR1 regulation by interferon (IFN)-γ and interleukin (IL)-4 during MAC activation through the classical and alternative MAC pathways, respectively. IFN-γ inhibited the loss of CX3CR1, but IL-4 induced it. Additionally, we demonstrated an association between CX3CR1 expression and apoptosis prevention by soluble fractalkine (sCX3CL1) in Mos, DCs and MACs. This is the first report demonstrating sequential and differential CX3CR1 modulation during Mo differentiation. Most importantly, we demonstrated a functional link between CX3CR1 expression and cell survival in the presence of sCX3CL1.


Figures

Figure 1
Figure 1
CX3CR1 expression changes in different Mo-derived populations. Freshly isolated Mos were either immediately stained or after culturing for 7 days with GM-CSF (30 ng/ml) or GM-CSF (50 ng/ml)+IL-4 (20 ng/ml) to differentiate Mos into MACs or iDCs, respectively. Cells were stained with PC5-conjugated anti-CD14 mAb, PE-conjugated anti-CD16 mAb and FITC-conjugated anti-CD1a mAb. (a) Morphology changes between freshly isolated Mos, iDCs and MACs were determined by flow cytometric analysis of scatter (SSC) vs. forward (FSC). A representative dot plot of each cellular population according to the culture condition is shown. Flow cytometric analysis of the cell surface expression of CD14, CD16 and CD1a was performed by gating the monocytic, iDC or MAC populations according to size and granularity in the SSC vs. FSC dot plot. Representative histograms of membrane expression of each antigen marker in the Mo, iDC and MAC populations are shown. Dotted histograms represent the isotype controls. (b) The percentage of CD14-, CD16- and CD1a-positive cells in the freshly isolated Mos, iDCs and MACs are shown. Each bar represents the mean±s.e.m. from 5–10 different donors. **P<0.01 and ***P<0.001, by the Kruskal–Wallis test (P<0.001) followed by the Mann–Whitney U test were calculated for each marker individually. (c) Mos, iDCs or MACs were also stained with a FITC-conjugated anti-CX3CR1 mAb. Cells were analyzed for CX3CR1 expression changes by flow cytometry. Representative histograms of membrane CX3CR1 expression in Mos, iDCs and MACs are shown. Dotted histograms represent the isotype controls. (d) The percentages of CX3CR1 positive cells in Mo, iDC and MAC populations are shown. Each bar represents the mean±s.e.m. from 7–10 different donors. ***P<0.001, according to the Kruskal–Wallis test followed by the Mann–Whitney U test. (e) Changes in CX3CR1 expression at different culture times. Each bar represents the mean±s.e.m. from 4–10 different donors. **P<0.01, by the Kruskal–Wallis test (P<0.001) followed by the Mann–Whitney U test. iDC, immature dendritic cell; MAC, macrophage; Mo, monocyte; PC5, phycoerythrin–cyanin 5.1; PE, phycoerythrin.
Figure 2
Figure 2
CX3CR1 expression in DC after maturation. Mo-derived iDC were further cultured in presence of LPS (500 ng/ml)+1000 U/ml IFN-γ for 48 h to obtain mDC. Subsequently, the cells were stained with FITC-conjugated anti-CD1a mAb, PE-conjugated anti-CD83 mAb, PC5-conjugated anti-CD86 mAb and FITC-conjugated anti-HLA-DR mAb and then analyzed by flow cytometry. (a) Representative histograms for CD1a, CD83, CD86 and HLA-DR membrane expression in iDC or mDC are shown. Dotted histograms represent the isotype controls. (b) The percentages of positive cells for CD1a, CD83, CD86 and HLA-DR in iDC or mDC are shown. Each bar represents the mean±s.e.m. from 4–6 different donors. *P<0.05 and **P<0.01, by Mann–Whitney U test calculated for each marker individually. (c) CX3CR1 expression in Mo, iDC or mDC. The results are expressed as percentage of positive cells. Each bar represents the mean±s.e.m. from 7–10 different donors. ***P<0.001, according to Kruskal–Wallis test (P<0.001) followed by the Mann–Whitney U test. (d) Mo were cultured up to 3 days in the presence of GM-CSF (50 ng/ml)+IL-4 (IL4DMo) or IL-13 (20 ng/ml) (IL13DMo) with or without IFN-γ (1000 U/ml). Subsequently, the cells were stained with FITC-conjugated anti-CX3CR1 mAb and then analyzed by flow cytometry. The percentages of CX3CR1 positive cells in every cell population are shown. Each bar represents the mean±s.e.m. from 2–4 different donors. DC, dendritic cell; GM-CSF, granulocyte-macrophage colony stimulating factor; HLA, human leukocyte antigen; IFN, interferon; LPS, lipopolysaccharide; mDC, mature dendritic cell; PE, phycoerythrin.
Figure 3
Figure 3
CX3CR1 membrane expression in MACs before and after activation. MACs were further cultured for 72 h either in presence of LPS (100 ng/ml)+IFN-γ (400 U/ml) to obtain classically activated MACs (M1) or IL-4 (25 ng/ml) to obtain alternative-differentiated MACs (M2). Subsequently, the cells were stained with FITC-conjugated anti-CD206 mAb, PE-conjugated anti-CD23 mAb, PC5-conjugated anti-CD86 mAb and FITC-conjugated anti-HLA-DR mAb and then analyzed by flow cytometry. (a) Representative histograms of membrane surface marker expression in MAC, M1 and M2 cell populations are shown. Dotted histograms represent the isotype controls. (b) The percentage of positive cells for CD206, CD23, CD86 and HLA-DR in MAC, M1 and M2 cell populations are shown. Each bar represents the mean±s.e.m. from 4–9 different donors. *P<0.05, **P<0.01 and ***P<0.001, by the Kruskal–Wallis test (P<0.05) followed by the Mann–Whitney U test. (c) In another set of experiments, MAC, M1 and M2 populations were stained with FITC-conjugated anti-CX3CR1 mAb. Representative histograms for CX3CR1 membrane expression in the MAC, M1 and M2 cell populations are shown. Dotted histograms represent the isotype controls. (d) The percentage of CX3CR1-positive cells in the MAC, M1 and M2 cell populations are shown. Each bar represents the mean±s.e.m. from 9–12 different donors. **P<0.01 and ***P<0.001, by the Kruskal–Wallis test (P<0.0001) followed by the Mann–Whitney U test. HLA, human leukocyte antigen; IFN, interferon; LPS, lipopolysaccharide; MAC, macrophage; PE, phycoerythrin.
Figure 4
Figure 4
CX3CR1 gene expression in Mos and Mo-derived DCs and MACs. Total RNA was prepared from freshly isolated Mo and cells that had been cultured for three days with GM-CSF (50 ng/ml)+IL-4 or IL-13 (20 ng/ml) to differentiate Mo into iDCs (IL-4 DMo or IL-13 DMo), or for 7 days with GM-CSF (30 ng/ml) to differentiate Mo into MACs. MACs were further cultured for 72 h either in presence of LPS (100 ng/ml) and IFN-γ (400 U/ml) to obtain classically activated MACs (M1), or IL-4 (25 ng/ml) to obtain alternative-differentiated MACs (M2). Subsequently, cDNA was prepared and real-time PCR was performed using specific primers for V28 variant of CX3CR1 and GAPDH. (a) The specificity of the primers is shown. PCR products obtained in the Mo were electrophoresed on 2% agarose gel and visualized with ethidium bromide staining. M is a 100 bp DNA ladder. (b) CX3CR1 mRNA expression in the different cell populations was analyzed by real-time RT-PCR. Data were normalized against GAPDH gene expression. The results are expressed in arbitrary units. Each bar represents mean±s.e.m. of 3–5 different donors, each one assessed in quadruplicate. *P<0.05, **P<0.01, by the Kruskal–Wallis test (P<0.001) followed by the Mann–Whitney U test. DC, dendritic cell; GAPDH, glyceraldehyde-3-phosphate dehydrogenase; iDC, immature dendritic cell; GM-CSF, granulocyte-macrophage colony stimulating factor; IFN, interferon; MAC, macrophage; Mo, monocyte; RT-PCR, reverse transcriptase-polymerase chain reaction.
Figure 5
Figure 5
Effect of soluble CX3CL1 (sCX3CL1) on the Mo, DC and MAC apoptotic rate. (a) Mos were cultured in medium with or without (control) sCX3CL1, at the indicated concentration for 24 h at 37 °C. Apoptosis was measured by fluorescence microscopy, as indicated in the section on ‘Materials and methods'. Each bar represents the mean±s.e.m. from 3–5 different donors. **P<0.005, according to the Kruskal–Wallis test (P<0.005) followed by the Mann–Whitney U test. (b) Apoptosis from Mos, iDCs or MACs was measured in parallel by flow cytometry as detailed in the Materials and Methods. Representative PI vs. annexin V double dot plots of Mos, iDCs and MACs incubated in medium with or without (control) sCX3CL1 (1 µg/ml), 24 h at 37 °C. Each bar represents the mean±s.e.m. of annexin V-positive cells for each population from 3–5 different donors. *P<0.05, according to the Mann–Whitney U test. DC, dendritic cell; iDC, immature dendritic cell; MAC, macrophage; Mo, monocyte; PI, propidium iodide.

References

    1. 1Fogg DK, Sibon C, Miled C, Jung S, Aucouturier P, Littman DR et al. A clonogenic bone marrow progenitor specific for macrophages and dendritic cells. Science 2006; 311: 83–87. - PubMed
    1. 2Whitelaw DM. Observations on human monocyte kinetics after pulse labeling. Cell Tissue Kinet 1972; 5: 311–317. - PubMed
    1. 3Ziegler-Heitbrock HW. Definition of human blood monocytes. J Leukoc Biol 2000; 67: 603–606. - PubMed
    1. 4Tacke F, Randolph GJ. Migratory fate and differentiation of blood monocyte subsets. Immunobiology 2006; 211: 609–618. - PubMed
    1. 5Leon B, Lopez-Bravo M, Ardavin C. Monocyte-derived dendritic cells. Semin Immunol 2005; 17: 313–318. - PubMed

Publication types

MeSH terms