. 2015 Jan 23;347(6220):431-5.
doi: 10.1126/science.1260403. Epub 2014 Dec 11.

Drug resistance. Population transcriptomics of human malaria parasites reveals the mechanism of artemisinin resistance

Affiliations

Drug resistance. Population transcriptomics of human malaria parasites reveals the mechanism of artemisinin resistance

Sachel Mok et al. Science. .

Abstract

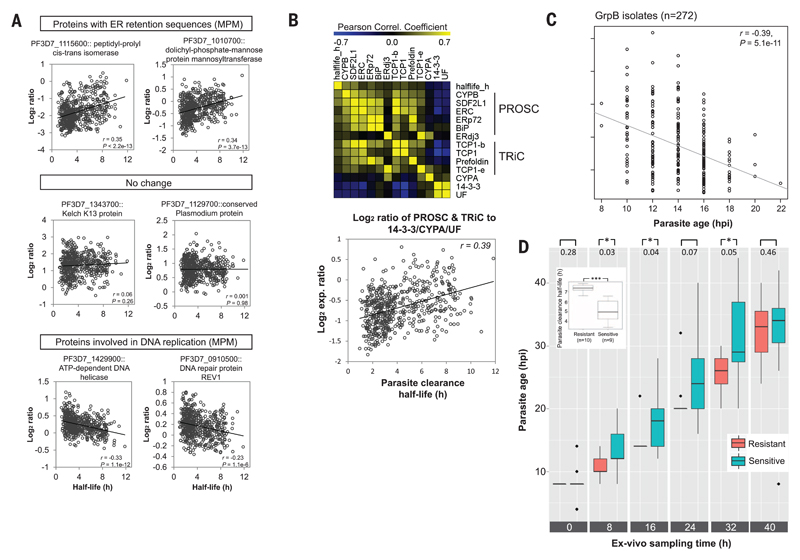
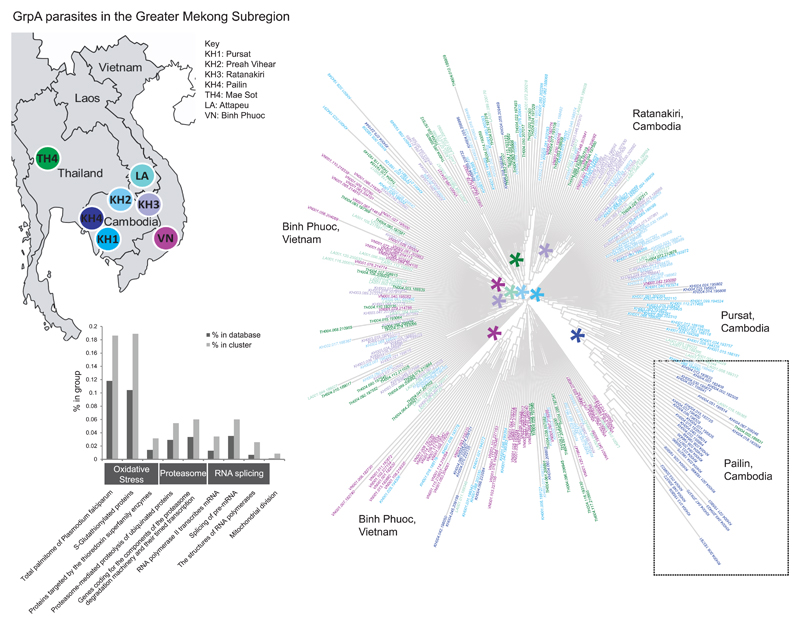
Artemisinin resistance in Plasmodium falciparum threatens global efforts to control and eliminate malaria. Polymorphisms in the kelch domain-carrying protein K13 are associated with artemisinin resistance, but the underlying molecular mechanisms are unknown. We analyzed the in vivo transcriptomes of 1043 P. falciparum isolates from patients with acute malaria and found that artemisinin resistance is associated with increased expression of unfolded protein response (UPR) pathways involving the major PROSC and TRiC chaperone complexes. Artemisinin-resistant parasites also exhibit decelerated progression through the first part of the asexual intraerythrocytic development cycle. These findings suggest that artemisinin-resistant parasites remain in a state of decelerated development at the young ring stage, whereas their up-regulated UPR pathways mitigate protein damage caused by artemisinin. The expression profiles of UPR-related genes also associate with the geographical origin of parasite isolates, further suggesting their role in emerging artemisinin resistance in the Greater Mekong Subregion.


Figures

Fig. 1
Fig. 1. Artemisinin response and transcription profiles of P. falciparum isolates from patients with acute malaria.
(A) The pie chart and boxplots show the distribution of parasite isolates and parasite clearance half-lives, respectively, according to field site. (B) The heat map shows mean-centered relative expression levels (log2 ratios) grouped by k-means clustering: GrpA (n = 549), GrpB (n = 272), and GrpC (n = 222). Corresponding gametocyte densities per microliter (pink squares) (4), relative expression levels of gametocyte-specific genes (blue bars), and parasite age (hpi) are shown above; distributions of geographical origins according to parasite group (colored bars) are shown below. *P < 0.05, **P < 0.01, ***P < 0.001.
Fig. 2
Fig. 2. Transcriptional features associated with artemisinin resistance.
(A) Scatterplots depict examples of the linear regression analysis between mRNA levels and parasite clearance half-life for two genes with positive, negative, or no correlation. The middle left panel shows the correlation for the K13 artemisinin resistance marker. (B) The heat map shows the Pearson correlation coefficients of pairwise comparisons of the 13 differentially expressed genes within the chaperone network. The scatterplot shows the ratio of the average expression of Plasmodium PROSC and TRiC to that of the three down-regulated genes (14-3-3, Cyp19A, and UF). (C) Distribution of parasite age (hpi) and clearance half-life for 272 GrpB isolates. (D) Boxplots show the age (hpi) of parasites over 40 hours in ex vivo culture, stratified by their artemisinin resistance status (*P < 0.05).
Fig. 3
Fig. 3. Population transcriptomics analysis of P. falciparum isolates.
Cladogram of the 348 GrpA isolates from the Greater Mekong Subregion, clustered by the Euclidean distance metric of 659 marker genes. The geographic origin of each isolate is indicated by the color key in the map. Stars indicate significant overrepresentation of isolates from a particular field site within the corresponding node (P < 0.05, hypergeometric test). Histograms of functional enrichment analysis show overrepresented and differentially expressed pathways in the demarcated Pailin clade (P < 0.05, hypergeometric test). Bars represent the proportion of Pailin clade-specific genes (light gray) relative to the total number of genes (dark gray).

Comment in

Similar articles

Cited by

References

    1. Dondorp AM, et al. N Engl J Med. 2009;361:455–467. - PMC - PubMed
    1. Amaratunga C, et al. Lancet Infect Dis. 2012;12:851–858. - PMC - PubMed
    1. Ariey F, et al. Nature. 2014;505:50–55. - PMC - PubMed
    1. Ashley EA, et al. N Engl J Med. 2014;371:411–423. - PMC - PubMed
    1. Phyo AP, et al. Lancet. 2012;379:1960–1966. - PMC - PubMed

Publication types

MeSH terms

Supplementary concepts

Associated data