

A comparison of structural and functional changes in patients screened for hydroxychloroquine retinopathy
- PMID: 25502494
- PMCID: PMC4303510
- DOI: 10.1007/s10633-014-9474-6
A comparison of structural and functional changes in patients screened for hydroxychloroquine retinopathy
Abstract
Purpose: The aims of this retrospective study were to compare the results of recommended screening tests for hydroxychloroquine-related retinal toxicity and analyze disparities between the structural and functional findings.
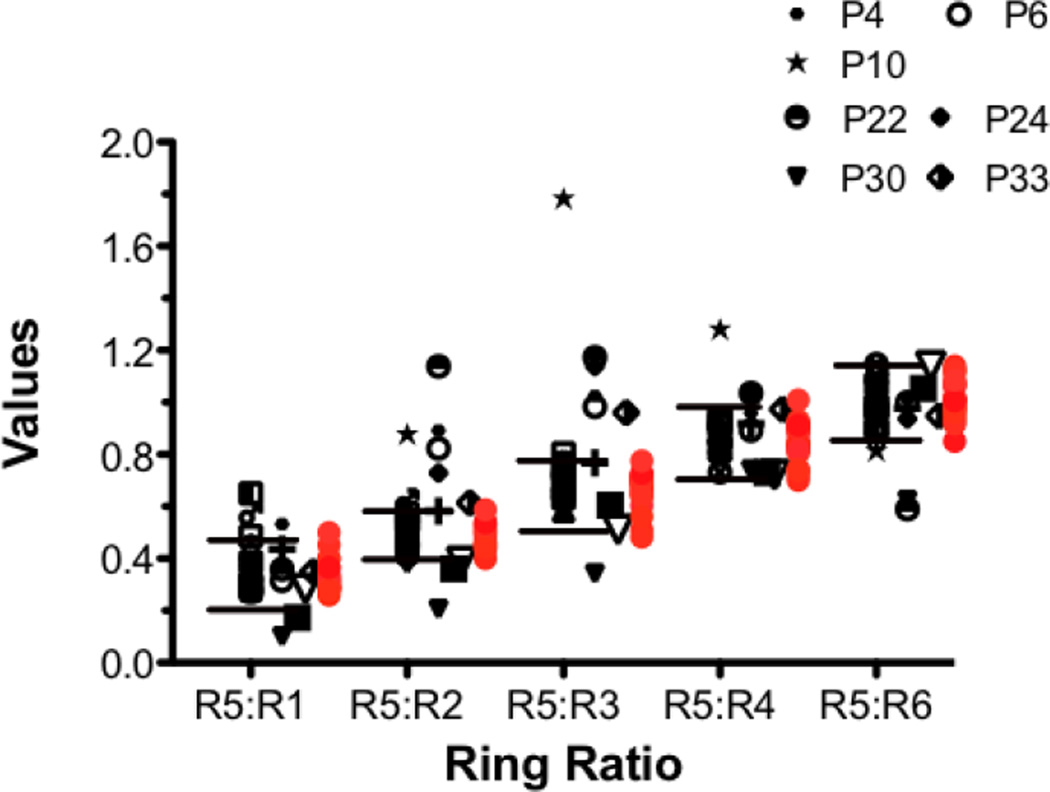
Methods: Thirty-four patients (31 women and 3 men) were included in the study. All were evaluated with standard automated perimetry using the 10-2 and/or 24-2 visual field program (Zeiss, Meditec), multifocal electroretinography (mfERG), spectral-domain optical coherence tomography (SD-OCT), and short-wavelength fundus autofluorescent imaging (SW-FAF). The results for the right eye from each patient were analyzed. Visual fields were classified as normal or abnormal based on pattern deviation plots, and mfERGs based on a comparison of R5 ring ratios to values from 20 controls. The SW-FAF images were examined for areas/rings of abnormal hypo- and/or hyperautofluorescence, and the SD-OCT line scans were classified as abnormal based on visual inspection and thickness measurements of the outer segment plus retinal pigment epithelial layer and total receptor layers compared to mean thicknesses from 35 controls.
Results: Fifteen patients had abnormal results on at least one test; however, only two patients had abnormal results on all four tests. Excluding SW-FAF, seven of the 15 had abnormal visual fields, mfERG ring ratios, and SD-OCTs. The remaining eight had either abnormal mfERGs and/or visual fields and normal SD-OCTs. We found no evidence of abnormal SD-OCTs in the presence of normal mfERG and visual field results.
Conclusions: The findings suggest that functional deficits precede structural changes seen on SD-OCT in these patients.
Conflict of interest statement
Figures


Similar articles
-
Progression of hydroxychloroquine toxic effects after drug therapy cessation: new evidence from multimodal imaging.JAMA Ophthalmol. 2013 Sep;131(9):1187-97. doi: 10.1001/jamaophthalmol.2013.4244. JAMA Ophthalmol. 2013. PMID: 23887202
-
Comparison between multifocal ERG and C-Scan SD-OCT ("en face" OCT) in patients with a suspicion of antimalarial retinal toxicity: preliminary results.Doc Ophthalmol. 2018 Apr;136(2):97-111. doi: 10.1007/s10633-018-9625-2. Epub 2018 Mar 13. Doc Ophthalmol. 2018. PMID: 29536324
-
The Relationship of Hydroxychloroquine Retinopathy Progression to Stage at Cessation of Therapy.Am J Ophthalmol. 2025 Sep;277:335-348. doi: 10.1016/j.ajo.2025.05.030. Epub 2025 May 28. Am J Ophthalmol. 2025. PMID: 40447243
-
Current opinion on hydroxychloroquine-related retinal toxicity screening: where do we stand now?Lupus. 2020 Jun;29(7):671-675. doi: 10.1177/0961203320919499. Epub 2020 Apr 21. Lupus. 2020. PMID: 32316844 Review.
-
Hydroxychloroquine retinopathy: A review of imaging.Indian J Ophthalmol. 2015 Jul;63(7):570-4. doi: 10.4103/0301-4738.167120. Indian J Ophthalmol. 2015. PMID: 26458473 Free PMC article. Review.
Cited by
-
Automated Evaluation of Ellipsoid Zone At-Risk Burden for Detection of Hydroxychloroquine Retinopathy.J Pers Med. 2024 Apr 25;14(5):448. doi: 10.3390/jpm14050448. J Pers Med. 2024. PMID: 38793030 Free PMC article.
-
A novel 5-ring multifocal electroretinography stimulus for detecting hydroxychloroquine retinal toxicity.Doc Ophthalmol. 2022 Apr;144(2):117-124. doi: 10.1007/s10633-021-09858-4. Epub 2021 Nov 11. Doc Ophthalmol. 2022. PMID: 34762206 Free PMC article.
-
Spectral-Domain Optical Coherence Tomography Is More Sensitive for Hydroxychloroquine-Related Structural Abnormalities Than Short-Wavelength and Near-Infrared Autofluorescence.Transl Vis Sci Technol. 2020 Aug 5;9(9):8. doi: 10.1167/tvst.9.9.8. eCollection 2020 Aug. Transl Vis Sci Technol. 2020. PMID: 32879764 Free PMC article.
-
Hydroxychloroquine-induced Retinal Toxicity.Front Pharmacol. 2023 May 30;14:1196783. doi: 10.3389/fphar.2023.1196783. eCollection 2023. Front Pharmacol. 2023. PMID: 37324471 Free PMC article. Review.
-
Unusual Fundus Autofluorescence Appearance in a Patient with Hydroxychloroquine Retinal Toxicity.Case Rep Ophthalmol. 2015 Jun 6;6(2):186-90. doi: 10.1159/000433417. eCollection 2015 May-Aug. Case Rep Ophthalmol. 2015. PMID: 26120318 Free PMC article.
References
-
- Easterbrook M. Long-term course of antimalarial maculopathy after cessation of treatment. Can J Ophthalmol. 1992;27(5):237–239. - PubMed
-
- Michaelides M, Stover NB, Francis PJ, Weleber RG. Retinal toxicity associated with hydroxychloroquine and chloroquine: risk factors, screening, and progression despite cessation of therapy. Arch Ophthalmol. 2011;129(1):30–39. - PubMed
-
- Mititelu M, Wong BJ, Brenner M, Bryar PJ, Jampol LM, Fawzi AA. Progression of hydroxychloroquine toxic effects after drug therapy cessation: new evidence from multimodal imaging. JAMA Ophthalmol. 2013;131(9):1187–1197. - PubMed
-
- Easterbrook E. Ocular effects and safety of antimalarial agents. Am J Med. 1988;85:23–29. - PubMed
-
- Marmor MF, Kellner U, Lai TY, Lyons JS, Mieler WF. American Academy of Ophthalmology Revised recommendations on screening for chloroquine and hydroxychloroquine retinopathy. Ophthalmology. 2011;118(2):415–422. - PubMed
Publication types
MeSH terms
Substances
Grants and funding
LinkOut - more resources
Full Text Sources
Other Literature Sources
Medical
