. 2015 Feb;56(2):342-57.
doi: 10.1194/jlr.M054718. Epub 2014 Dec 11.

Importance of ALDH1A enzymes in determining human testicular retinoic acid concentrations

Affiliations

Importance of ALDH1A enzymes in determining human testicular retinoic acid concentrations

Samuel L Arnold et al. J Lipid Res. 2015 Feb.

Abstract

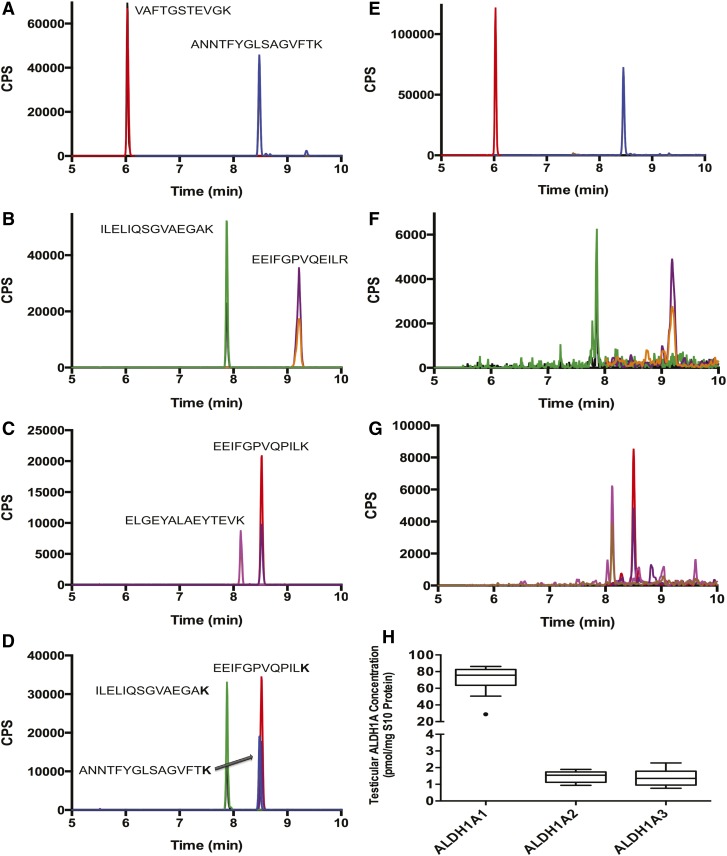
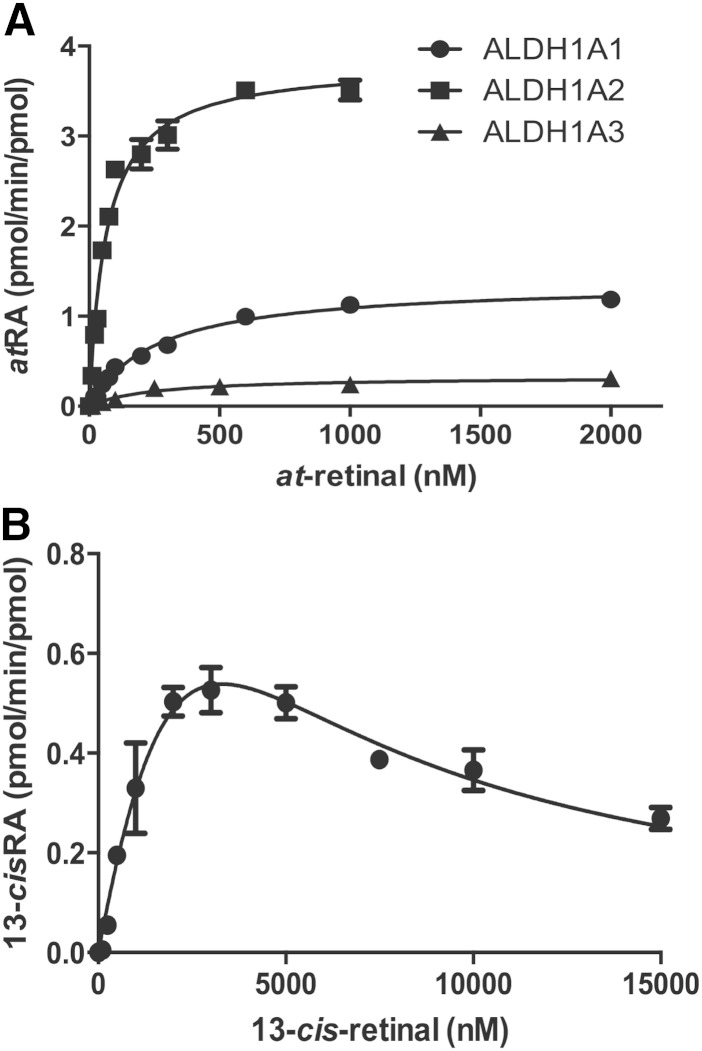
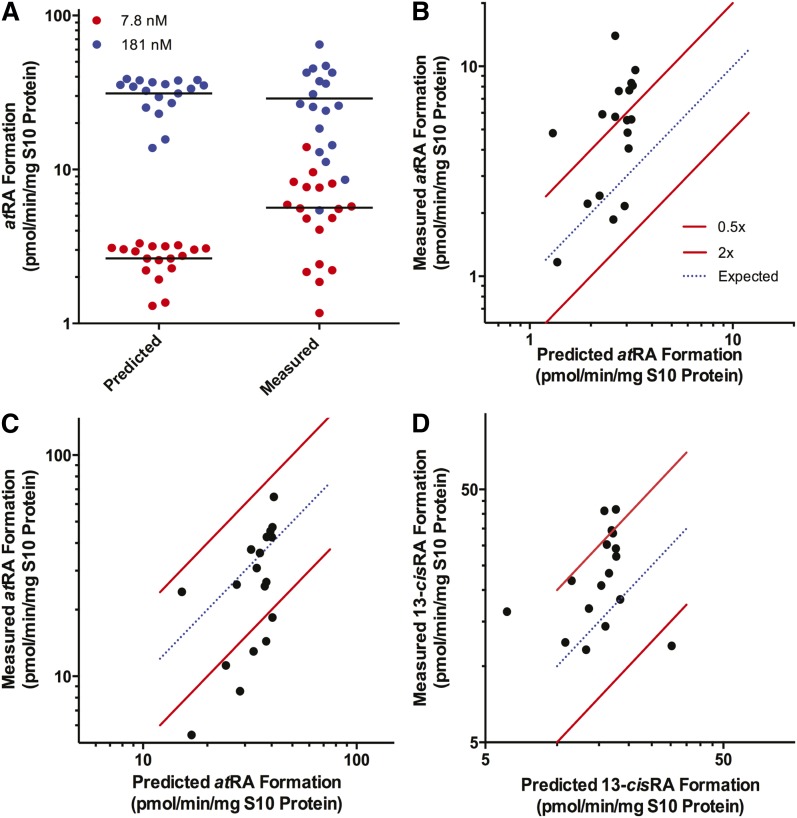
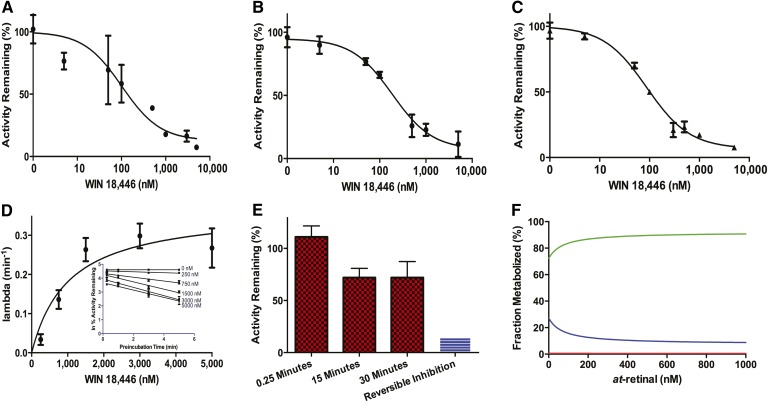
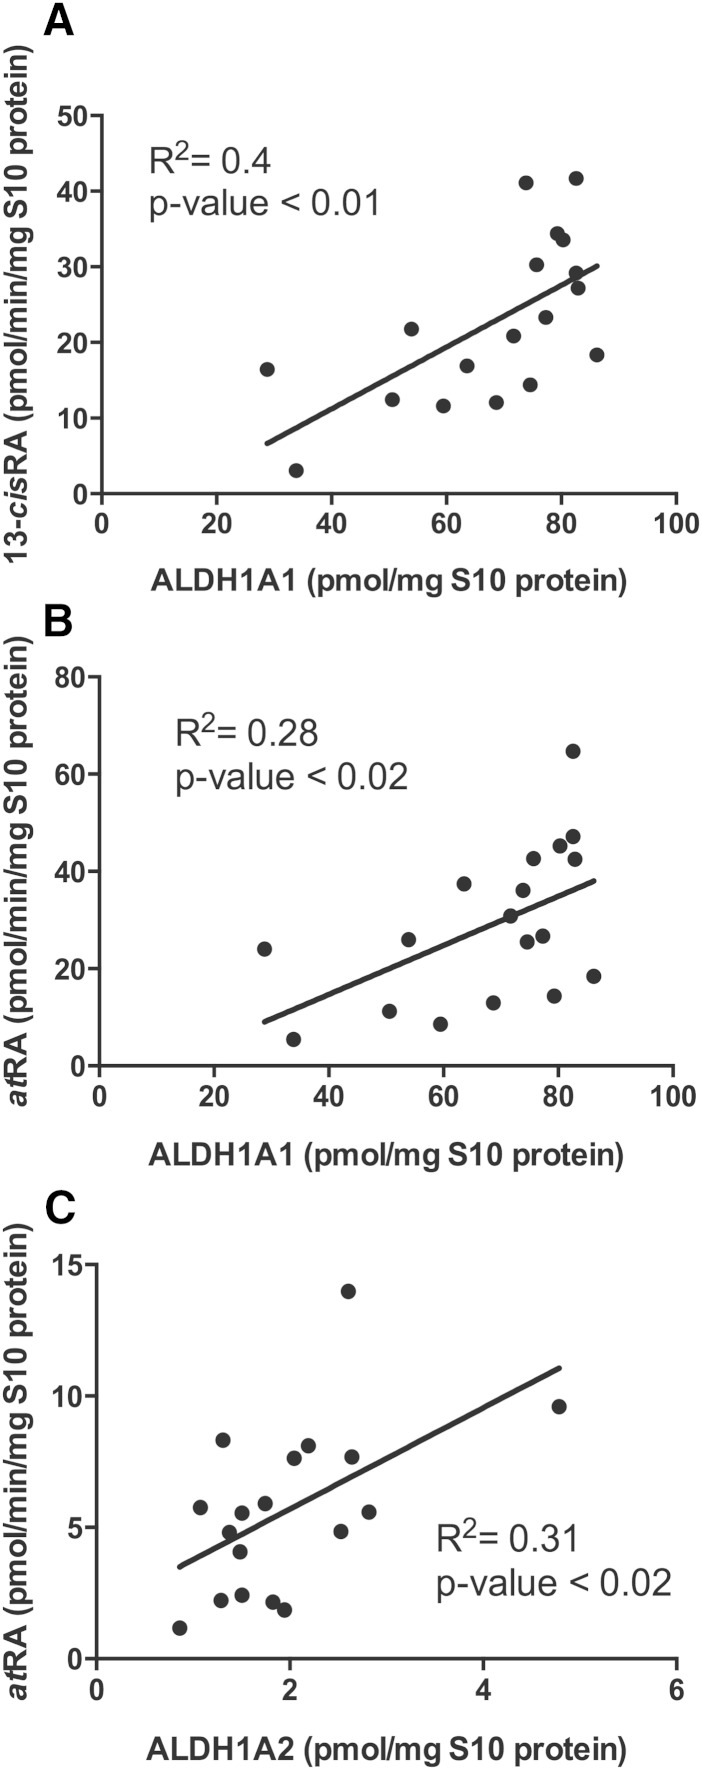
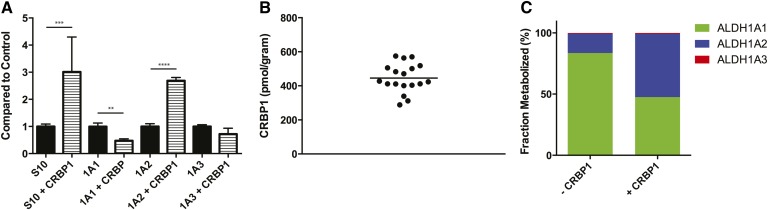
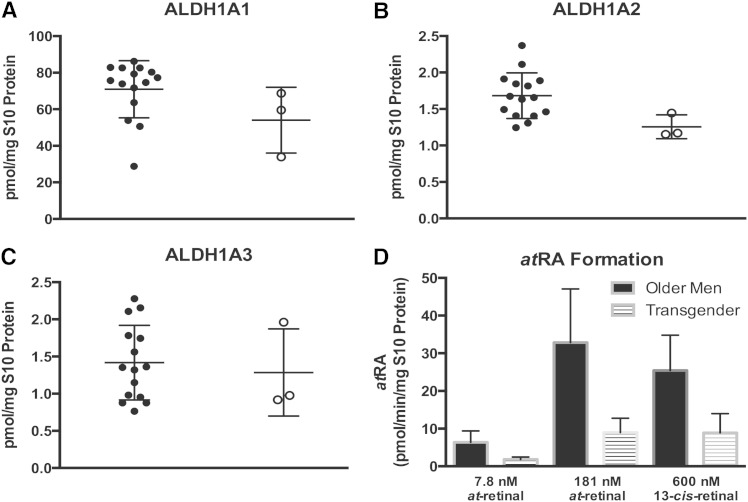
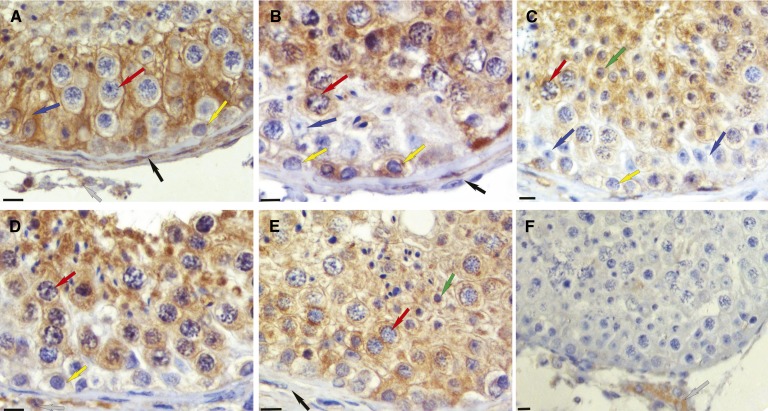
Retinoic acid (RA), the active metabolite of vitamin A, is required for spermatogenesis and many other biological processes. RA formation requires irreversible oxidation of retinal to RA by aldehyde dehydrogenase enzymes of the 1A family (ALDH1A). While ALDH1A1, ALDH1A2, and ALDH1A3 all form RA, the expression pattern and relative contribution of these enzymes to RA formation in the testis is unknown. In this study, novel methods to measure ALDH1A protein levels and intrinsic RA formation were used to accurately predict RA formation velocities in individual human testis samples and an association between RA formation and intratesticular RA concentrations was observed. The distinct localization of ALDH1A in the testis suggests a specific role for each enzyme in controlling RA formation. ALDH1A1 was found in Sertoli cells, while only ALDH1A2 was found in spermatogonia, spermatids, and spermatocytes. In the absence of cellular retinol binding protein (CRBP)1, ALDH1A1 was predicted to be the main contributor to intratesticular RA formation, but when CRBP1 was present, ALDH1A2 was predicted to be equally important in RA formation as ALDH1A1. This study provides a comprehensive novel methodology to evaluate RA homeostasis in human tissues and provides insight to how the individual ALDH1A enzymes mediate RA concentrations in specific cell types.

Keywords: aldehyde dehydrogenase 1A; mass spectrometry; testes.


Figures

Fig. 1.
Fig. 1.
Quantification of ALDH1A1, ALDH1A2, and ALDH1A3 from testicular tissue S10 fractions. ALDH1A concentrations were measured using a novel LC-MS/MS-based peptide quantification method. Recombinant protein was digested and two peptides (each with two m/z transitions) were chosen for each protein to measure ALDH1A1 (A), ALDH1A2 (B), and ALDH1A3 (C) using LC-MS/MS. The peptide used for quantification was normalized to a corresponding stable isotope-labeled peptide with a [13C615N2]lysine or [13C615N2]arginine (D). Each peptide was observed in all 18 men and representative chromatograms of detection of ALDH1A1 (E), ALDH1A2 (F), and ALDH1A3 (G) in human testis are shown. The expression levels of the three proteins in the human testes of nontransgendered men are shown in (H). All peaks displayed in the chromatograms are scaled to counts per second (CPS).
Fig. 2.
Fig. 2.
Kinetics of RA formation by recombinant ALDH1A proteins. Recombinant purified human ALDH1A was used to determine the kinetics of atRA formation by each ALDH1A enzyme (A). Because only ALDH1A1 formed 13-cisRA from 13-cis-retinal, only 13-cisRA formation by ALDH1A1 was characterized (B). The kinetic constants obtained are shown in Table 2.
Fig. 3.
Fig. 3.
Comparison of the predicted and measured ALDH1A activity in human testis. atRA formation was measured and predicted for the 18 subjects with at-retinal as the substrate at free concentrations of 8 nM (red circles) and 181 nM (blue circles) (A). Each dot represents an individual in the study. The measured activity was plotted as a function of predicted activity in each subject with 7.8 nM free at-retinal (B), 181 nM free at-retinal (C), and 600 nM free 13-cis-retinal (D). The blue dotted line represents an exact correlation between predicted and measured RA formation (ALDH1A activity). The red lines represent the range between 2-fold overprediction and 0.5-fold underprediction.
Fig. 4.
Fig. 4.
Inhibition of ALDH1A and RA formation by WIN 18,446. The inhibition kinetics of WIN 18,446 were characterized and used to determine the fraction of atRA formation by ALDH1A2 in the human testis. The reversible inhibition kinetics of WIN 18,446 with recombinant ALDH1A1 (A) (IC50 = 102 nM) and ALDH1A3 (B) (IC50 = 187 nM) were determined together with the effect of WIN 18,446 on atRA formation in testicular S10 fractions (C) (IC50 = 88 nM). Due to the time-dependent inhibition of ALDH1A2 by WIN 18,446, the rate of inactivation was determined with increasing concentrations of inhibitor (D, inset) and plotted as a function of inhibitor concentration (D) to determine the KI and kinact. In order to measure the fm for ALDH1A2 in the testis, S10 protein was preincubated with inhibitor for 0.25, 10, and 30 min to inactivate any ALDH1A2 protein (E). The preincubation was diluted out to remove reversible inhibition, and the ALDH1A activity was determined. The 25% decrease in ALDH1A activity (E) can be attributed to the contribution by ALDH1A2. The predicted relative contribution of each ALDH1A enzyme (green, ALDH1A1; blue, ALDH1A2; red, ALDH1A3) to atRA formation as a function of at-retinal concentration is shown in (F).
Fig. 5.
Fig. 5.
The correlation between ALDH1A protein expression and RA formation velocity measured in S10 fraction from testes from each individual in the study. The correlations between 13-cisRA (A) and atRA (B) formation with ALDH1A1 expression are shown with nominal 1,000 nM substrate. The correlation between atRA formation and ALDH1A2 expression at 100 nM nominal substrate concentration is shown in (C).
Fig. 6.
Fig. 6.
The effect of CRBP1 on atRA formation and CRBP expression level in the human testis. The effect of CRBP1 on atRA formation by testicular S10 protein and by recombinant ALDH1A1, ALDH1A2, and ALDH1A3 was determined and the formation of atRA from 300 nM holo-CRBP compared with free at-retinal (300 nM) is shown (A). The concentration of 300 nM was chosen to mimic expected in vivo concentrations as closely as possible. CRBP1 expression in the testis S10 fractions was quantified in all subjects by ELISA and the expression levels are shown (B). The relative contribution of each ALDH1A enzyme to atRA formation in the presence or absence of CRBP1 was predicted from a substrate (at-retinal or holo-CRBP) at 100 nM as described in the Materials and Methods and the predicted percent contribution by each ALDH1A is shown in (C).
Fig. 7.
Fig. 7.
Comparison of the ALDH1A protein expression and activity between men and transgender individuals. There was a significant decrease in the ALDH1A2 protein concentration in the three transgender individuals compared with the men (B). However, there was no observed difference in the testicular protein concentration of ALDH1A1 (A) or ALDH1A3 (C). Testicular ALDH1A activity was significantly lower in the transgender individuals at both 7.8 and 181 nM at-retinal (P < 0.02) and 600 nM 13-cis-retinal (P < 0.01) (D).
Fig. 8.
Fig. 8.
Localization of ALDH1A enzymes in the human testis. ALDH1A1, ALDH1A2, and ALDH1A3 have distinct localization patterns in the human testis. Each panel is representative of immunohistochemical results from three different human testes. All were fixed in Bouin’s fluid and embedded in paraffin. Brown stain indicates immunopositive reaction for ALDH1A1 (A), ALDH1A2 (B–D), and ALDH1A3 (E). A negative control (F) used rabbit IgG instead of primary rabbit antibody. The original magnification was 225× for each. The bar at lower left of each panel represents 10 microns. Cell types are indicated by arrows as follows: blue, Sertoli cells; yellow, spermatogonia; red, primary spermatocytes; green, round spermatids; black, peritubular cells; gray, interstitial cells.
Fig. 9.
Fig. 9.
Quantification of intratesticular RA and correlation of RA concentration and measured RA formation in human testes. Intratesticular atRA and 13-cisRA were measured using LC-MS/MS and a representative chromatogram is shown (A). To confirm peak identity, a MS/MS/MS experiment was conducted and full MS/MS/MS spectra were collected from ion transition m/z 301.2+ > 205.3+ (B). The spectra shown in (B) are of RA standard and of the three main peaks labeled in (A), 13-cisRA, unknown, and atRA. C: Shows the extracted MS/MS/MS chromatogram of the m/z 301.2+ > 205.3+ > 159.1+ transition. The correlation between formation and atRA or 13-cisRA concentrations in human testis is shown in (D). In addition, total RA had a significant positive correlation with atRA formation.

References

    1. Ross A. C. 2007. Vitamin A supplementation and retinoic acid treatment in the regulation of antibody responses in vivo. Vitam. Horm. 75: 197–222. - PMC - PubMed
    1. Chung S. S., Wang X., Wolgemuth D. J. 2009. Expression of retinoic acid receptor alpha in the germline is essential for proper cellular association and spermiogenesis during spermatogenesis. Development. 136: 2091–2100. - PMC - PubMed
    1. Noy N. 2010. Between death and survival: retinoic acid in regulation of apoptosis. Annu. Rev. Nutr. 30: 201–217. - PubMed
    1. Clagett-Dame M., Knutson D. 2011. Vitamin A in reproduction and development. Nutrients. 3: 385–428. - PMC - PubMed
    1. Chapellier B., Mark M., Messaddeq N., Calleja C., Warot X., Brocard J., Gerard C., Li M., Metzger D., Ghyselinck N. B., et al. 2002. Physiological and retinoid-induced proliferations of epidermis basal keratinocytes are differently controlled. EMBO J. 21: 3402–3413. - PMC - PubMed

Publication types