. 2014 Dec 11;9(12):e114912.
doi: 10.1371/journal.pone.0114912. eCollection 2014.

A peculiar mutation spectrum emerging from young peruvian patients with hepatocellular carcinoma

Affiliations

A peculiar mutation spectrum emerging from young peruvian patients with hepatocellular carcinoma

Agnès Marchio et al. PLoS One. .

Abstract

Hepatocellular carcinoma usually afflicts individuals in their later years following longstanding liver disease. In Peru, hepatocellular carcinoma exists in a unique clinical presentation, which affects patients around age 25 with a normal, healthy liver. In order to deepen our understanding of the molecular processes ongoing in Peruvian liver tumors, mutation spectrum analysis was carried out on hepatocellular carcinomas from 80 Peruvian patients. Sequencing analysis focused on nine genes typically altered during liver carcinogenesis, i.e. ARID2, AXIN1, BRAF, CTNNB1, NFE2L2, H/K/N-RAS, and TP53. We also assessed the transcription level of factors involved in the control of the alpha-fetoprotein expression and the Hippo signaling pathway that controls contact inhibition in metazoans. The mutation spectrum of Peruvian patients was unique with a major class of alterations represented by Insertions/Deletions. There were no changes at hepatocellular carcinoma-associated mutation hotspots in more than half of the specimens analyzed. Furthermore, our findings support the theory of a consistent collapse in the Hippo axis, as well as an expression of the stemness factor NANOG in high alpha-fetoprotein-expressing hepatocellular carcinomas. These results confirm the specificity of Peruvian hepatocellular carcinoma at the molecular genetic level. The present study emphasizes the necessity to widen cancer research to include historically neglected patients from South America, and more broadly the Global South, where cancer genetics and tumor presentation are divergent from canonical neoplasms.


Conflict of interest statement

Competing Interests: The authors have declared that no competing interests exist.

Figures

Figure 1
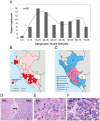
Figure 1. Occurrence of HCC in Peru presents an age-based clinico-epidemiological polarity.
(A) Histogram presenting the distribution of the present patient population according to patients' age at the time of diagnosis. X-axis displays age (10-year bin); y-axis displays the headcount of patients for a given age group (n = 80). Straight line represents the histogram curve fitting with a Gaussian mixture function (BI = 1.8). This bimodal distribution concurs with the observation previously made in Peru . (B,C) Distribution maps of the population size (B) and mean age (C) of the patients according to their regional origin. (B) Regions for which patient headcount was ≤5 and>5 are choropleth mapped in pink and red, respectively. The southern-central Andean area encompassing the regions of Apurimac (#1), Ayacucho (#2), Cuzco (#3), and Junin (#4) is the area from where was originating the larger subset of <40 patients. (C) Regions for which mean age was <40 and ≥40 years old are choropleth mapped in magenta and blue, respectively. Φ indicates highly endemic regions of HBV infection (>8%); Ψ indicates regions of intermediate endemicity (2-7%); Ω indicates regions of moderate endemicity (<1%), as described . (B,C) Regions for which headcount was null are choropleth mapped in off-white. (D–F) Hematoxylin–eosin-stained liver sections from a 37-year-old Peruvian female individual with an 18-cm-diameter multinodular, moderately differentiated HCC. (D) Both NTL (left) and HCC (right) tissues presented under low magnification (40x). The arrow indicates the fibrotic tissues of the capsule enclosing HCC nodules. b: bile duct; v: vein. Scale bar; 100 µm. (E) Presentation of the normal NTL tissue under high magnification (100x). (F) Presentation of the E.S.2 HCC tissue with a trabecular pattern under high magnification (100x). (E,F) Scale bars; 10 µm.
Figure 2
Figure 2. The mutation spectra emerging from Peruvian HCCs display age-based peculiar genetic features.
(A) Mutations found in HCCs from <40 (left) and ≥40 (right) Peruvian patients, as see in CTNNB1, AXIN1, TP53, K-RAS, H-RAS, NFE2L2, and ARID2 genes (n = 80). Mutation presence is indicated on the upper panel by both blue and red check marks. Red check marks correspond to inactivating mutations, i.e. nonsense or frame shift mutations. Corresponding clinico-pathological features are mentioned on the lower panel. Check marks correspond to (from top to bottom): male sex; HBsAg(+); serum AFP level above the median; poorly differentiated tumor; ≥17 cm-diameter tumor; multinodular tumor; recurrence within 12 months following anatomic liver resection; metastatic cancer; and cirrhotic NTL. Red asterisks indicate significant differences between <40 and ≥40 patients both for HBsAg(+) (P<0.0001) and serum AFP level (P = 0.0006). Green asterisk indicates significant difference between HCCs with mutation(s) and HCCs with no mutation (P = 0.038). (B) Mutation spectrum of Peruvian HCC (n = 80). X-axis displays percentage of genetic alteration; y-axis displays each of the six classes of base substitution and Insertions/Deletions (InDels). (C) Bar chart illustrating the association between AXIN1 gene mutation and MDM2 GG genotype at the rs2279744 allele. (B,C) Error bars represent the standard errors of the counts.
Figure 3
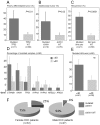
Figure 3. Age-based tumor phenotype and clinical pattern of the Peruvian HCCs are correlated to specific somatic mutation rates.
(A–E) Bar charts illustrating the association between HCC-related gene mutation rates (%) and tumor clinical presentation. (A–C,E) Black bars represent the mutation rate; grey bars represent the wild-type allele (WT) rate. (A) WT and mutation rates of TP53 gene in E.S.3 HCCs (P = 0.01). (B) WT and mutation rates of AXIN1 gene in multinodular HCCs (P = 0.03). (C) WT and mutation rates of Wnt axis in recurring HCCs (P<0.0001). (D) Bar chart of the mutation rates of ARID2, AXIN1, CTNNB1, H-RAS, K-RAS, NFE2L2, and TP53 genes in <40 and ≥40 patients (black and grey bars, respectively). (E) Bar chart presenting mutation rate of Wnt axis in <40 and ≥40 HCCs. Black and grey bars represent <40 and ≥40 patient rates, respectively. (A–E) Error bars represent the standard errors of the counts. (F) Pie charts for both mutation and WT rates of AXIN1 gene in HCCs of female (left chart) and male (right chart) patients. Black sectors represent the AXIN1 mutation rates; grey sectors represent the rates of AXIN1 WT.
Figure 4
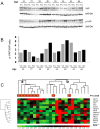
Figure 4. The Hippo axis is down-regulated during the development of massive HCC in Peruvian patient.
(A) Western blot analysis of total cell extracts prepared from HCC/NTL of eight Peruvian patients (ranking from age 13 to age 77). Cell extracts were separated by SDS-PAGE and electrophoretically transferred onto nitrocellulose membrane. The blots were probed using antibodies to YAP (upper panel), p-YAP (lower panel), and GAPDH (both panels). GAPDH was used as a loading control. (B) Bar chart representation of the p-YAP/YAP ratio in these eight HCC/NTLs. Relative quantification of YAP and p-YAP protein expression was measured on western blots using ImageJ software and the blotted signals were normalized to GAPDH expression before forming the ratio of the densitometric values of bands containing YAP and p-YAP proteins. (C) Heat map of an unsupervised hierarchical clustering of expression of 13 Hippo axis genes [i.e., baculoviral IAP repeat containing 5 (BIRC5), dachsous cadherin-related 1 (DCHS1), FAT atypical cadherin 4 (FAT4), hes family bHLH transcription factor 1 (HES1), jagged 1 (JAG1), large tumor suppressor kinase 1 (LATS1) and 2 (LATS2), macrophage stimulating 1 (MST1), neurofibromin 2 (NF2), SRY-box 4 (SOX4), TEA domain family member 4 (TEAD4), WW domain containing transcription regulator 1 (WWTR1), and YAP genes] in Peruvian HCCs (n = 23). Results are expressed as HCC/NTL mRNA expression ratios. The left-most cluster (a) is highly enriched in huge tumors (L) (P = 0.0066) and displays a general collapse of Hippo axis expression (except for MST1 and STK4 genes) when compared with the right-most cluster (b). L corresponds to the largest tumors (≥17 cm-diameter) present in the third tertile of the patient cohort (n = 23).
Figure 5
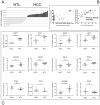
Figure 5. Serum AFP concentration in Peruvian HCC is concomitantly correlated to AFP gene overexpression and down-regulation of TF-encoding genes involved in AFP gene control.
(A) Bar chart displaying the AFP gene transcription levels obtained by qRT-PCR from 23 matched pairs of NTL (grey bars; left) and HCC (black bars; right) tissues from Peruvian patients. (B) Scatter plots showing the relationship between (left) the serum AFP concentration (x-axis) and the tumor size (y-axis) (ns); (right) the AFP mRNA expression (x-axis) and the serum AFP concentration (y-axis, n = 40, P = 0.0001). (C) Dot plots of the relative expression of 12 TF-encoding genes (i.e., ESR1, FOS, HNF4, JUN, NANOG, NR3C1, RELA, RXRA, ZBTB20, TP53, TP73, and ZHX2) controlling AFP gene expression in HCC/NTL as measured by qRT-PCR (n = 23). ***P<0.0001; **P<0.001; *P<0.05.
Figure 6
Figure 6. High expression of both alpha-fetoprotein transcript and polypeptide is correlated to NANOG gene transcription in massive Peruvian HCC.
(A) Dot plots indicating expression folds of four TF-encoding genes controlling AFP gene expression in high (n = 23) and low (n = 23) AFP-expressing HCC tumors. Folds of expression level of AFP gene are defined according to their position above (high) or below (low) the median AFP gene expression level of the cohort. ***P = 0.01; **P = 0.02; *P = 0.07 (ns). (B) Heat-map of the unsupervised hierarchical clustering for HNF1A, NANOG, and NR3C1 expression, TFs involved in AFP gene regulation in Peruvian HCCs (n = 46). The pervasive expression of NANOG gene correlates with high serum AFP concentration (red-squared H) (P = 0.007) and AFP mRNA level (white-squared H) (P<0.0001), whereas expression of NR3C1-GR gene and down-regulation of NANOG gene is preferentially observed in low AFP-expressing tumors. Arg/Arg homozygosity at codon 72 of TP53 (rs1042522) (green-squared R) is associated with high serum AFP concentration and AFP mRNA level, as well as increased NANOG gene expression (P = 0.008).

Similar articles

Cited by

References

    1. Ferlay J, Soerjomataram I, Dikshit R, Eser S, Mathers C, et al. (2014) Cancer incidence and mortality worldwide: Sources, methods and major patterns in GLOBOCAN 2012. Int J Cancer doi:10.1002/ijc.29210. - DOI - PubMed
    1. Yang JD, Roberts LR (2010) Hepatocellular carcinoma: a global view. Nat Rev Gastroenterol Hepatol 7:448–458. - PMC - PubMed
    1. McGlynn K, London W (2005) Epidemiology and natural history of hepatocellular carcinoma. Best Pract Res Clin Gastroenterol 19:3–23. - PubMed
    1. Goss PE, Lee BL, Badonivac-Crnjevic T, Strasser-Weippl K, Chavarri-Guerra Y, et al. (2013) Planning cancer control in Latin America and the Caribbean. Lancet Oncol 14:391–436. - PubMed
    1. Ruiz E, Sanchez J, Celis J, Payet E, Berrospi F, et al. (2007) [Short and long-term results of liver resection for hepatocellular carcinoma in Peru: a Peruvian single center experience on 232 cases.]. Rev Gastoenterol Peru 27:223–237 Spanish - PubMed

Publication types

Substances