. 2015 Feb;23(2):297-309.
doi: 10.1038/mt.2014.239. Epub 2014 Dec 15.

Inhibitory/suppressive oligodeoxynucleotide nanocapsules as simple oral delivery devices for preventing atopic dermatitis in mice

Affiliations

Inhibitory/suppressive oligodeoxynucleotide nanocapsules as simple oral delivery devices for preventing atopic dermatitis in mice

Yeqin Wang et al. Mol Ther. 2015 Feb.

Abstract

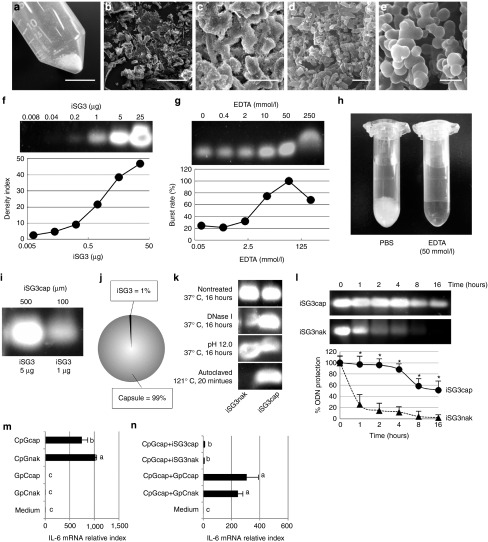
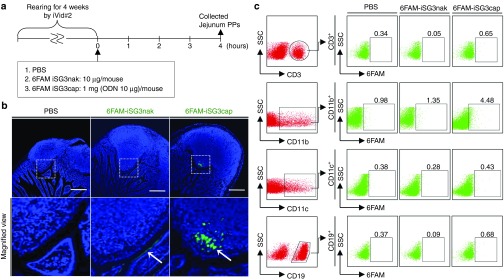
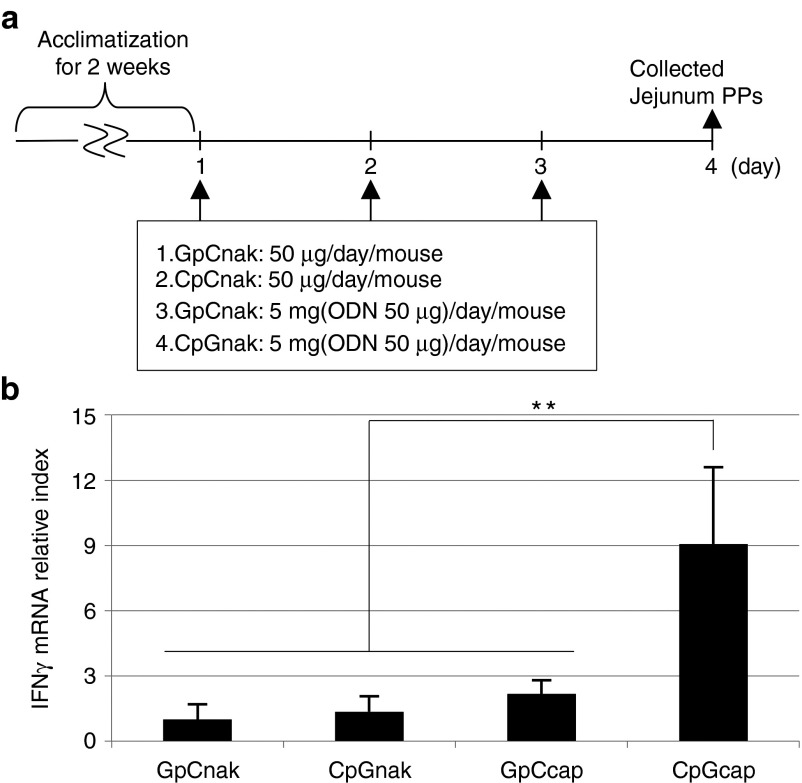
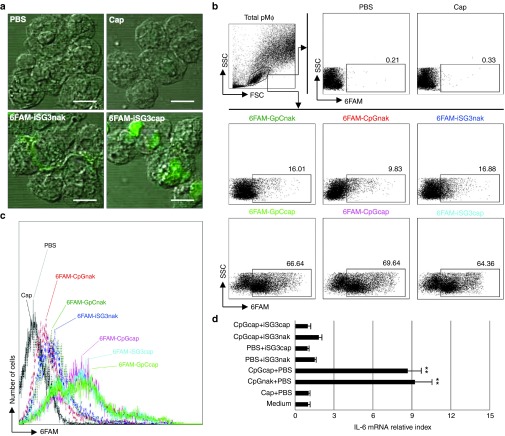
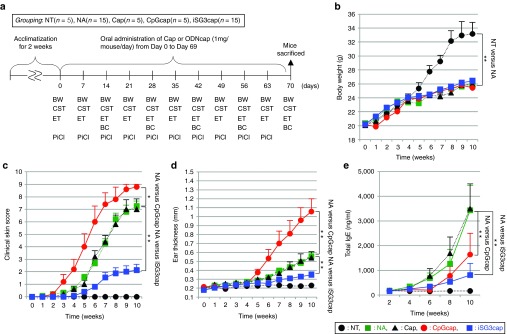
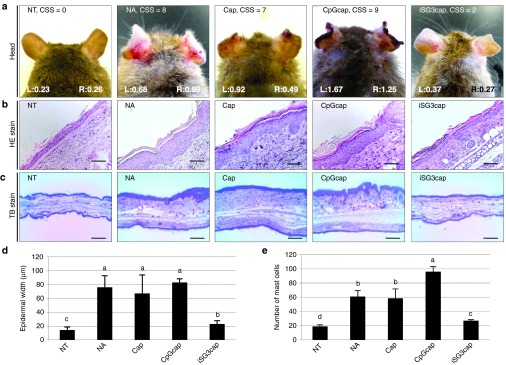
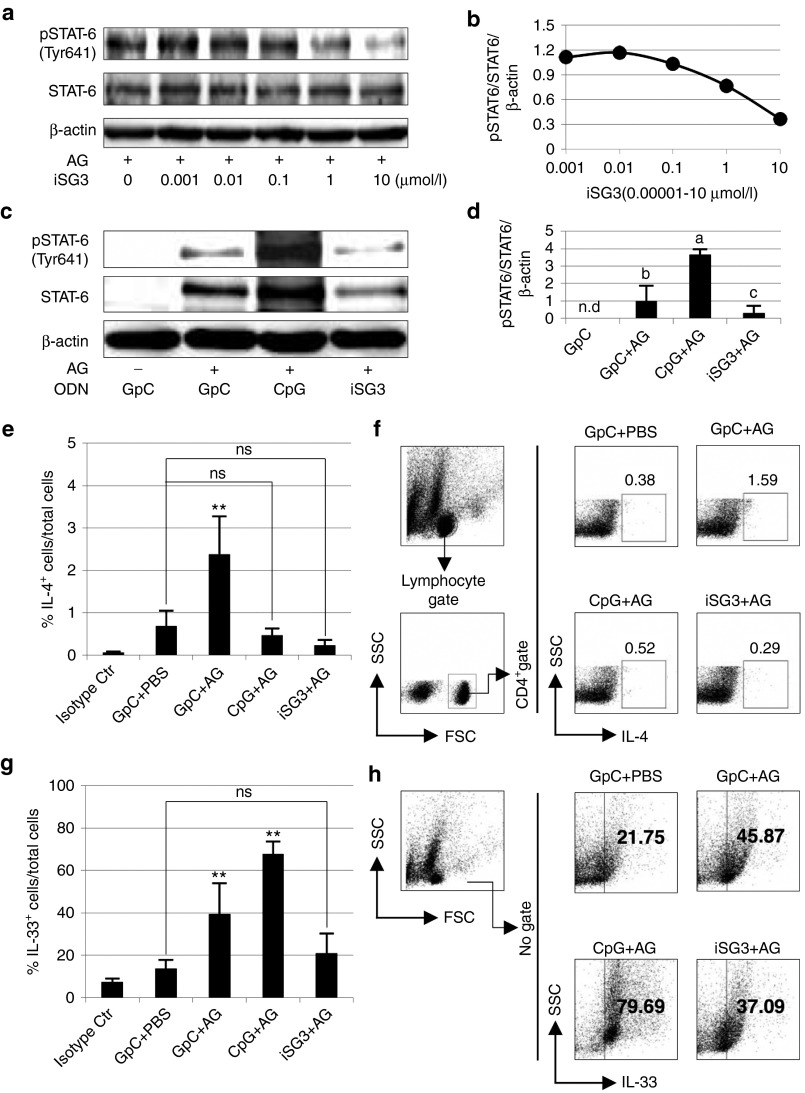
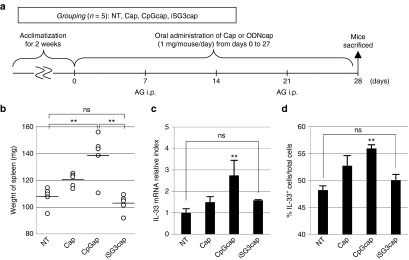
Here, we report a simple and low-cost oral oligodeoxynucleotide (ODN) delivery system targeted to the gut Peyer's patches (PPs). This system requires only Dulbecco's modified eagle's medium, calcium chloride, ODNs, and basic laboratory equipment. ODN nanocapsules (ODNcaps) were directly delivered to the PPs through oral administration and were taken up by macrophages in the PPs, where they induced an immune response. Long-term continuous oral dosing with inhibitory/suppressive ODNcaps (iODNcaps, "iSG3caps" in this study) was evaluated using an atopic dermatitis mouse model to visually monitor disease course. Administration of iSG3caps improved skin lesions and decreased epidermal thickness. Underlying this effect is the ability of iSG3 to bind to and prevent phosphorylation of signal transducer and activator of transcription 6, thereby blocking the interleukin-4 signaling cascade mediated by binding of allergens to type 2 helper T cells. The results of our iSG3cap oral delivery experiments suggest that iSG3 may be useful for treating allergic diseases.


Figures

Figure 1
Figure 1
Characterization of iSG3caps. (a) Digital camera photograph and (be) SEM photographs of iSG3caps. Scale bar equals (a) 10 mm, (b) 100 μm, (c) 10 μm, (d) 1 μm, and (e) 200 nm. (f) Optimum density of iSG3 for agarose gel electrophoresis. PS-iSG3 was diluted 1:5 serially, from 25 μg/well to 0.008 μg/well for 3% (w/v) agarose gel electrophoresis. Data are representative of at least three independent experiments. (g,h) Optimum concentration of EDTA for bursting capsules. EDTA was diluted 1:5 serially, from 250 to 0.4 mmol/l for analysis of capsule bursting. Data are representative of at least three independent experiments. (i,j) iSG3caps (500 μg) were synthesized containing 5 μg of iSG3. The encapsulation rate of ODN was calculated as ~1%. (k) Agarose gel electrophoresis analysis of ODN stability. iSG3nak and iSG3caps were incubated with DNase I at 37 °C for 16 hours; NaOH, pH 12.0, at 37 °C for 16 hours; or autoclaved at 121 °C for 20 minutes. Data are representative of at least three independent experiments. (l) Resistance of iSG3nak and iSG3caps to simulated gastric juice following incubation at 37 °C for 16 hours. The nontreated control was not incubated in simulated gastric juice (i.e., time zero). Data are shown as the mean + SD (n = 3) of one representative of three independent experiments with similar results. *P < 0.05. (m,n) RT-qPCR analysis of IL-6 mRNA expression in SP cells. (m) SP cells (2 × 106 cells/ml) were preincubated in medium for 3 hours prior to exposure to GpCnak, GpCcaps, CpGnaks, or CpGcaps for 6 hours. (n) CpGcaps plus GpCnak, GpCcaps, iSG3nak, or iSG3caps were added to examine the suppressive effect. Results are shown as the ratio of IL-6 mRNA levels (normalized to β-actin) in stimulated versus nontreated cells. Data are shown as the mean ± SD (n = 4) of one representative of three independent experiments with similar results. Values with different letters (i.e., a, b, and c) were significantly different (P < 0.01).
Figure 2
Figure 2
Assay of iSG3caps uptake following oral administration. (a) Schedule for experiments to determine the localization of orally administered 6FAM-iSG3caps in the intestinal mucosa. Effective uptake of iSG3caps by jejunal PPs. (b) Confocal laser microscopic images of PPs 4 hours after oral administration of PBS, 6FAM-conjugated iSG3nak (6FAM-iSG3nak), and 6FAM-conjugated iSG3caps (6FAM-iSG3caps). 6FAM-iSG3caps, but not 6FAM-iSG3nak, specifically reached the PPs (arrow). 6FAM-iSG3nak was attached to the apical surfaces of the follicle-associated epithelium (arrow). Scale bar equals 200 μm. Lower panels are high-magnification views. Data are representative of at least three independent experiments with similar results. (c) Assay of uptake of orally administered PBS, 6FAM-iSG3nak, or 6FAM-iSG3caps by PP cells. Flow cytometric analysis of PP cells stained with anti-CD3, CD11b, CD11c, or CD19 antibodies. The level of 6FAM-iSG3 or 6FAM-iSG3cap uptake by stained cells is shown as a percentage in the dot plots of gated cells. Analyses were carried out at least in triplicate with similar results, and representative results are presented.
Figure 3
Figure 3
CpGcaps activate PP cells following oral administration. (a) Schedule for experiments examining the immune activity of orally administered CpGcaps in jejunal PPs. After rearing for 2 weeks, mice were administered PBS, ODNnak (GpCnak or CpGnak), or ODNcaps (GpCcaps or CpGcaps) for 3 consecutive days. (b) RT-qPCR analysis of IFN-γ mRNA levels in jejunal PPs isolated from mice orally administered ODNnak or ODNcaps. Results are shown as the level of IFN-γ mRNA normalized to that of β-actin. Data are representative and shown as the mean ± SE for each animal; n = 5 mice/group. **P < 0.01.
Figure 4
Figure 4
Activation of pMΦs following uptake of CpGcaps. (ac) The pMΦs were treated with PBS, 1 μg of 6FAM-ODNnak, 100 μg of Caps, or 100 μg of 6FAM-ODNcaps for 1 hour at 37 °C. (a) Confocal laser microscopic analysis of 6FAM-iSG3nak and 6FAM-iSG3caps in pMΦs. Green fluorescence is indicative of 6FAM-iSG3. Scale bar equals 5 μm. (b) Representative FACS plots of analyses gated on pMΦs. (c) Histogram illustrating uptake of 6FAM-ODNnak or 6FAM-ODNcaps. (d) RT-qPCR analysis of IL-6 mRNA expression in mouse pMΦs. Results are shown as the level of IL-6 mRNA normalized to that of β-actin. Data are shown as the mean ± SD (n = 3) of one representative of three independent experiments with similar results. **P < 0.01.
Figure 5
Figure 5
The effect of oral administration of ODNcaps to AD mice. (a) Schedule for the long-term in vivo trial. After rearing for 2 weeks, each mouse was administered 1 mg of Caps, CpGcaps, or iSG3caps for 10 weeks. The (b) body weight (BW), (c) clinical skin test results (CST; clinical skin sore, CSS), and (d) ear thickness (ET) of each mouse were monitored during the experiment. Blood was collected from the caudal vein every other week. After 10 weeks, all mice were sacrificed and their spleens were extracted for analysis of the immune response. BC, blood collection; PiCl, PiCl challenge. (b) Change in body weight of mice. (c) The dermatitis score was defined as the sum of scores for three clinical criteria. (d) The thickness of the right and left ear auricles was measured using a vernier micrometer once per week. (e) Total serum IgE levels were monitored for 10 weeks. Data are shown as the mean ± SE for each animal at each time point; n = 5–15 mice/group (be). The data for the NA and iSG3cap groups (n = 15) are pooled from three independent experiments (be). **P < 0.01; *P < 0.05 for indicated groups at the same time point.
Figure 6
Figure 6
Histologic changes in ear skin observed on day 70. (a) Head, (b) HE, and (c) TB staining of thin ear sections of mice. The scores (left ear: L; right ear: R) shown in the photographs in a indicate ear thickness (mm). The average clinical skin score (CSS; by clinical skin test) is shown at the top of the panels in a. Thin sections (5 μm) were cut and stained with HE (b, scale bar equals 200 μm) or TB for mast cells (red-purple staining) (c, scale bar equals 100 μm). (d) The thickness of the epidermis in HE sections and (e) the number of mast cells were determined from five mice, and the results are presented as the mean ± SE (n = 5). Letters (i.e., a, b, c, and d) represent significant differences (P < 0.05).
Figure 7
Figure 7
Inhibition of Th2 signaling and IL-33 production by iSG3. (ad) Effect of iSG3 on STAT6 phosphorylation in SP cells isolated from AG-immunized mice. (a,b) Concentration-dependent effect of iSG3 on STAT6 phosphorylation. Protein extracted from SP cells was treated for 60 minutes with different concentrations of iSG3 (0.001–10 μmol/l) or PBS and then blotted to detect STAT6 Tyr641 phosphorylation (pSTAT6). Concentration-response curve shows the result from a densitometric analysis. Data are representative of three independent experiments with similar results. (c,d) SP cells were incubated with/without 10 μg/ml of AG and 3 μmol/l ODN (GpC-ODN, CpG-ODN, or iSG3) for 60 minutes. The effect on STAT6 phosphorylation was determined by Western blot analysis of cell lysates. Data are representative of three independent experiments with similar results. (d) Densitometric analysis of three independent Western blots shows quantitation of pSTAT6/STAT6/β-actin levels. The results shown are the mean ± SD (n = 3) from three independent experiments. Values with different letters (i.e., a, b, and c) are significantly different (P < 0.01). (eh) Flow cytometric analysis was performed to determine the proportions of CD4+IL-4+ cells and IL-33+ cells. SP cells isolated from AG-immunized mice were treated with ODN and/or AG for 72 hours. (f,h) Representative FACS plots gated on CD4+ IL-4+ cells and IL-33+ cells. (e,g) The results represent the mean ± SD (n = 3) from three independent experiments with similar results. **P < 0.01 for indicated group(s). ns, not significant.
Figure 8
Figure 8
ODNcaps regulate systemic immunity following oral administration. (a) Schedule for experiments examining the systemic immune activity of orally administered Caps, CpGcaps, and iSG3caps in AG-immunized mice. After rearing for 2 weeks, mice were administered PBS, Caps, or ODNcaps (GpCcaps or CpGcaps) for 4 weeks (days 0–27). The mice were sensitized with i.p. injections of 100 μg of AG with adjuvant on days 7 and 21. After 4 weeks, all mice were sacrificed and their spleens were extracted and cultured with 50 μg/ml of AG for 72 hours. (b) Spleen weight (mg). (c) RT-qPCR analysis of IL-33 mRNA expression in SP cells derived from mice immunized with in vitro AG resensitization. Results are shown as the level of mRNA normalized to that of β-actin. Data are representative and shown as the mean ± SE of three independent experiments with n = 5 mice/group. (d) Flow cytometric analysis was performed to determine the proportion of IL-33+ cells. SP cells (2 × 106) isolated from AG-immunized mice were treated with ODN and/or AG for 72 hours. Each symbol represents an individual mouse, n = 5 mice/group. **P < 0.01 for NT versus CpGcaps. ns, not significant.

Comment in

Similar articles

Cited by

References

    1. Krieg AM, Yi AK, Matson S, Waldschmidt TJ, Bishop GA, Teasdale R.et al. (1995CpG motifs in bacterial DNA trigger direct B-cell activation Nature 374546–549. - PubMed
    1. Costa LB, Noronha FJ, Roche JK, Sevilleja JE, Warren CA, Oriá R.et al. (2012Novel in vitro and in vivo models and potential new therapeutics to break the vicious cycle of Cryptosporidium infection and malnutrition J Infect Dis 2051464–1471. - PMC - PubMed
    1. Karbach J, Neumann A, Wahle C, Brand K, Gnjatic S, Jäger E. Therapeutic administration of a synthetic CpG oligodeoxynucleotide triggers formation of anti-CpG antibodies. Cancer Res. 2012;72:4304–4310. - PubMed
    1. Klinman DM. Immunotherapeutic uses of CpG oligodeoxynucleotides. Nat Rev Immunol. 2004;4:249–258. - PubMed
    1. Pico de Coana Y, Carnes J, Gallego MT, Alonso C, Parody N. Modulation of the humoral response to Dermatophagoides pteronyssinus allergens in BALB/c mice by extract modification and adjuvant use. Int Arch Allergy Immunol. 2012;157:331–338. - PubMed

Publication types

MeSH terms

LinkOut - more resources