. 2015 Feb;33(2):179-86.
doi: 10.1038/nbt.3101. Epub 2014 Dec 15.

Genome-wide detection of DNA double-stranded breaks induced by engineered nucleases

Affiliations

Genome-wide detection of DNA double-stranded breaks induced by engineered nucleases

Richard L Frock et al. Nat Biotechnol. 2015 Feb.

Abstract

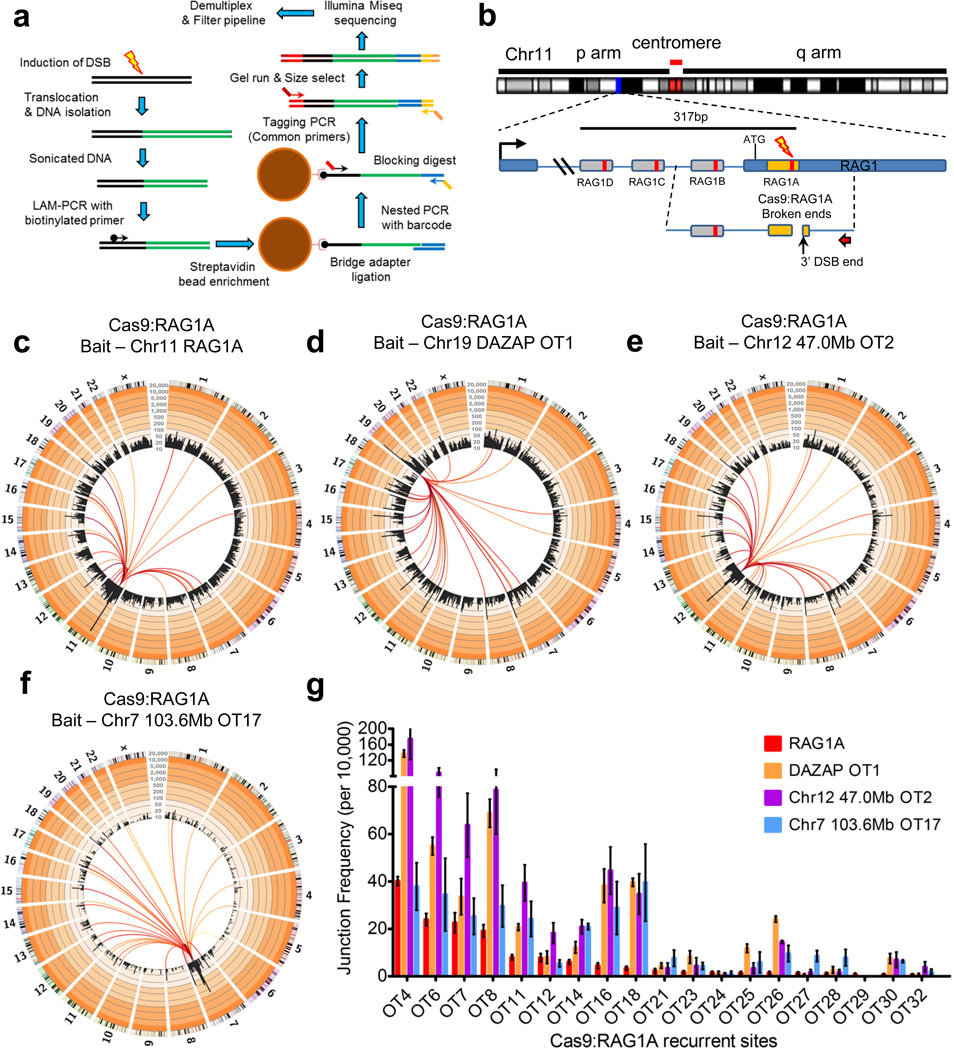
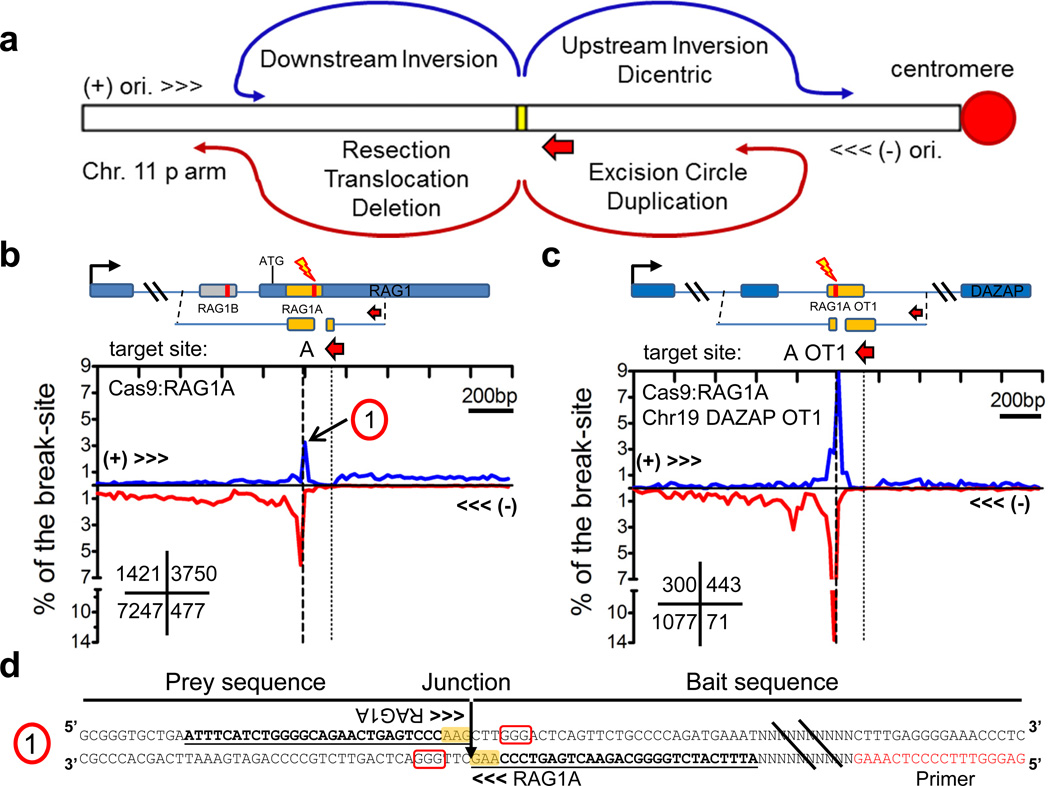
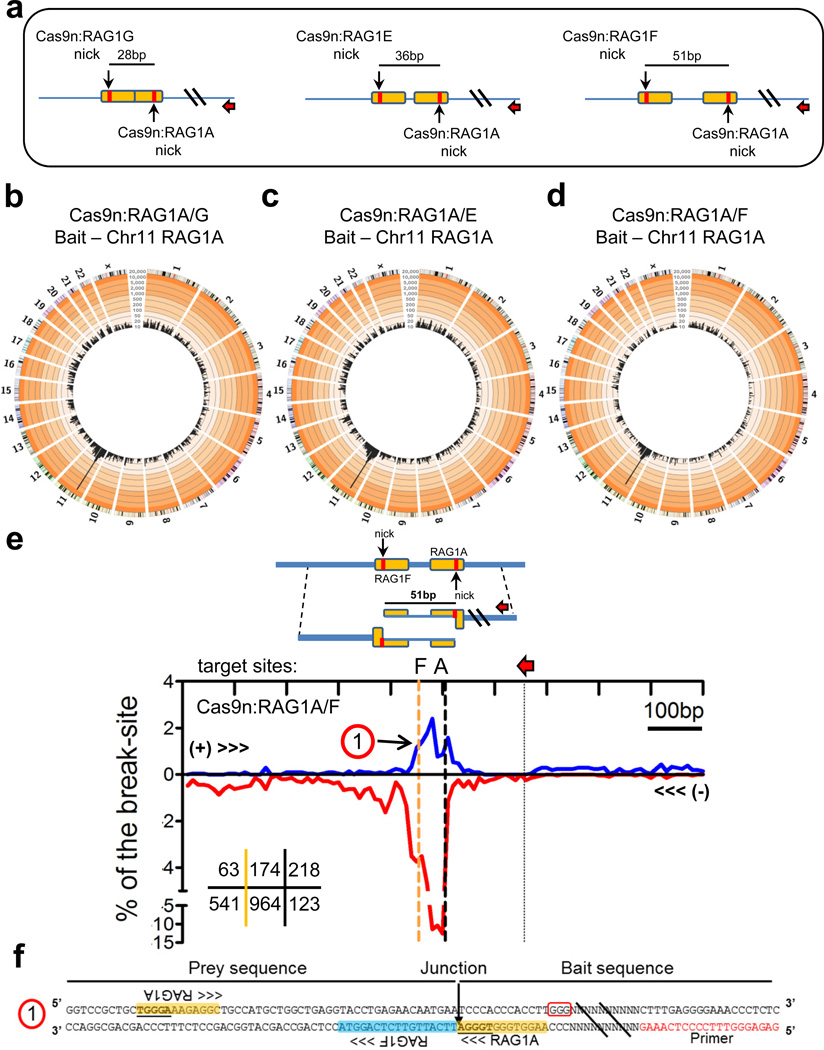
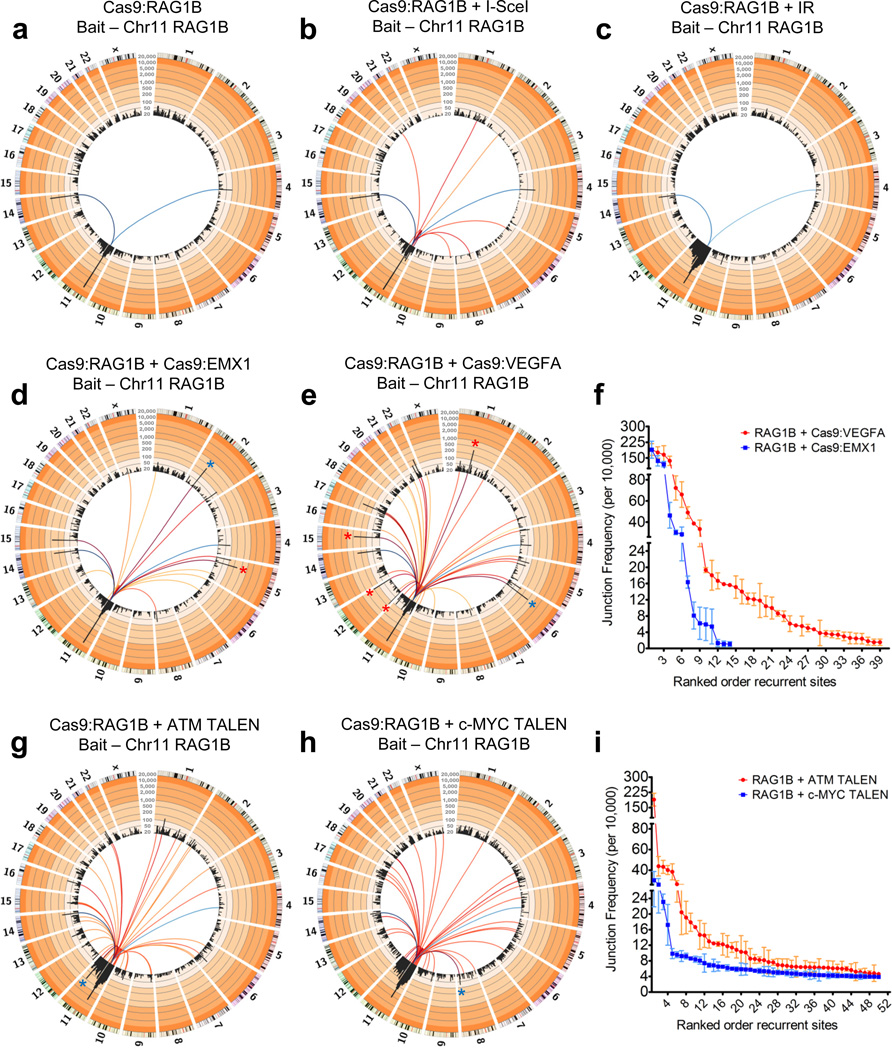
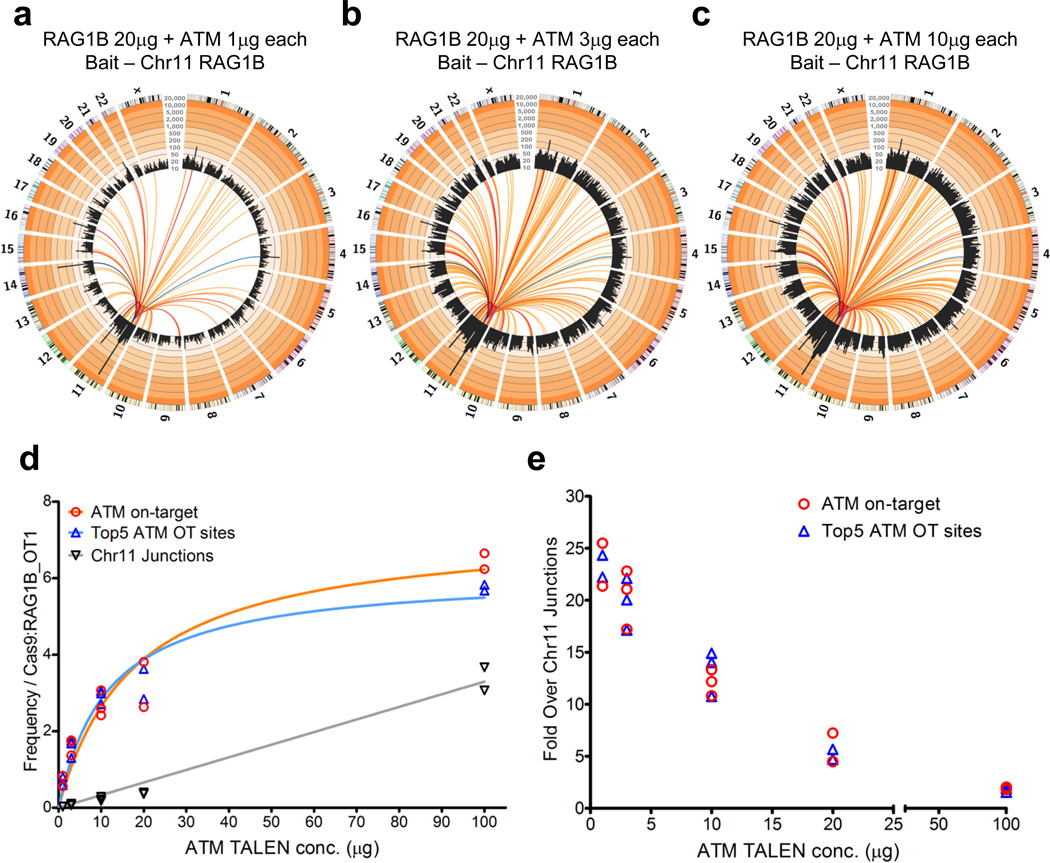
Although great progress has been made in the characterization of the off-target effects of engineered nucleases, sensitive and unbiased genome-wide methods for the detection of off-target cleavage events and potential collateral damage are still lacking. Here we describe a linear amplification-mediated modification of a previously published high-throughput, genome-wide, translocation sequencing (HTGTS) method that robustly detects DNA double-stranded breaks (DSBs) generated by engineered nucleases across the human genome based on their translocation to other endogenous or ectopic DSBs. HTGTS with different Cas9:sgRNA or TALEN nucleases revealed off-target hotspot numbers for given nucleases that ranged from a few or none to dozens or more, and extended the number of known off-targets for certain previously characterized nucleases more than tenfold. We also identified translocations between bona fide nuclease targets on homologous chromosomes, an undesired collateral effect that has not been described previously. Finally, HTGTS confirmed that the Cas9D10A paired nickase approach suppresses off-target cleavage genome-wide.


Figures

Figure 1
Figure 1. LAM-PCR HTGTS from Cas9:RAG1A on-target and off-target bait sites
(a) LAM-PCR HTGTS method overview. Major modifications of prior HTGTS method include enriching for translocations directly from sonicated DNA via LAM-PCR and ssDNA ligation using a bridge adapter. See online methods for greater detail. (b) Positions of Cas9:RAG1A-D sgRNA target sites within the RAG1 locus on Chromosome (Chr) 11. Red arrow indicates the cloning primer used to capture the 3’ DSB ends from the RAG1A site (orange box); RAG1B uses the same primer but with longer bait. RAG1 C & D use a separate primer strategy (see Supplementary Fig. 2a). Cas9:RAG1 DSBs occur 3bp proximal to the PAM within the sgRNA target sequence (red bar inside sgRNA targets) (c) Circos plots of RAG1A HTGTS genome-wide prey junctions binned into 5Mb regions (black bars) are plotted on a log scale with indicated custom ticks; frequency ranges are colored from white (0–10) to increasingly darker orange colors (>10) by factors of 10. Colored lines connect the RAG1 bait site to the prey hotspot; line color range from dark red to yellow indicates high to low hotspot enrichment respectively (25,000 junctions; N=6). Hotspots are identified as significantly focal sites (see online methods for more details), contain junctions to both chromosomal orientations, and are found in multiple library replicates; all hotspots shown are related to nuclease off-target activity (See online methods for more details). (d–f) RAG1A off-target (OT) bait HTGTS circos plots using the (d) DAZAP OT1 on chr19, (e) 47.0Mb OT2 on chr12, and (f) 103.6Mb OT17 on chr7 (N=3 each; see Supplementary Table 1). (g) Bar graph of average junction frequency per 10,000 unique junctions for each off-target site not located on bait chromosomes 7, 11, 12, and 19. Error bars are displayed as S.E.M. The junction scale displayed for the figure circos plots is from 10–20,000.
Figure 2
Figure 2. Distinct prey break-site junction joining to homologous chromosomes
(a) Prey joining outcomes of 3’ DSB ends at the break-site. Yellow box indicates the break-site and the short red arrow indicates the (−) orientation and position of the cloning primer used. Most junctions represent rejoining of the processed 5’ DSB end (resection) followed by joins to other DSB ends which can result in deletions and excision circles and inversions to the (+) orientation (see Supplementary Fig. 7a). Additional types of joins can occur from the homologous chromosome (see Supplementary Fig. 7b) leading to tandem duplications, and translocations which can form dicentric chromosomes. (b,c) HTGTS libraries displaying prey junction enrichment within 1kb regions flanking the break-site for (b) RAG1A and (c) RAG1A OT1 on Chr 19. Diagrams above each graph indicate the target break-site position; the number within the lower left grid of each graph indicates total junctions for each quadrant. (d) The sequence of a RAG1A head-to-head inversion joined from the break-site on the homologous chromosome and corresponds to ‘1” indicated in panel b. PAM is boxed in red and yellow highlight indicate RAG1A target sequence. Identical sequences between the bait and prey are underlined.
Figure 3
Figure 3. Cas9n paired nick DSB HTGTS libraries
(a) RAG1A is paired with nearby sgRNAs RAG1G, E, and F which target the opposing strand and generate DSBs with 5’ overhangs of 28, 36, and 51nt in length when used in combination with Cas9n. Red arrows indicate the orientation and position of the cloning primer used. Orange box indicates the sgRNA target sites with red bars indicating the position of Cas9 cleavage. (b–d) Circos plots (see Figure 1 legend) for HTGTS libraries of Cas9n (b) RAG1A/G (normalized to 20,000 junctions, N=6), (c) RAG1A/E (N=2), (d) and RAG1A/F (N=2) paired nicks using the RAG1A bait. See Supplementary Table 1 for junction frequencies. No hotspots relating to RAG1A off-target activity were identified. (e) Prey junction enrichment within 500bp of the RAG1A target site for Cas9n:RAG1A/F (N=2). Red arrows indicate position of the bait primer and the orange dashed line indicates the position of the opposing strand sgRNA target (RAG1F). Numbers in the lower left grid indicate total junctions for each region including the region between the paired off-set target sites (middle) (f) Sequence indicating a head-to-head inversion of the RAG1A bait to the RAG1F ‘prey” on the homologous chromosome as indicated as ‘1” on panel f of this figure. PAM is boxed in red and the yellow and blue highlights indicate RAG1A and RAG1F target sites respectively. Identical sequences between the two RAG1A target sites are underlined.
Figure 4
Figure 4. Identification of off-target sites from other nucleases using the universal Cas9:RAG1B bait
(a,b) Circos plots of (a) RAG1B only (N=6) and (b) RAG1B + I-SceI (N=3) HTGTS libraires. (c) Circos plot of IR-treated Cas9:RAG1B (N=3) libraries. Note the enrichment on the break-site chromosome. (d,e) Circos plots of RAG1B + (d) Cas9:EMX1 (N=3) or (e) Cas9:VEGFA (N=3) HTGTS libraries. Red asterisks indicate previously identified sites and blue asterisks indicate the on-target prey site. (f) Plot of on-target and off-target frequencies per 10,000 unique junctions from Cas9:EMX1 and Cas9:VEGFA (N=3 each) using Cas9:RAG1B as the bait. (g,h) Circos plots of RAG1B + (g) ATM or (h) c-MYC TALEN HTGTS libraries. Note that only the top 10% of identified recurrent sites—including the on-target site (blue asterisk)—are shown for TALEN off-target sites. (i) Average junction frequencies for the top 50 recurrent ATM and c-MYC TALEN sites are listed. Blue colored lines for all circos plots in this figure indicate RAG1B off-target sites (dark blue to light blue = high to low enrichment), whereas red to yellow colored lines (dark red to yellow = high to low enrichment) indicate the on and off-target sites of the co-expressed nuclease. (a–e,g,h) All circos plots shown are normalized to 25,000 junctions and presented as similarly described in Fig. 1 (see legend). Junction scale for all Figure 4 circos plots: 20–20,000. (f,i) Error bars are displayed as S.E.M. See Figure 1 legend for further description of circos plots.
Figure 5
Figure 5. Nuclease titration to measure on-target/background efficiency
(a–c) Circos plots (see Figure 1 legend) of fixed concentration RAG1B bait + titrated ATM TALEN prey HTGTS libraries at (a) 1µg, (b) 3µg, (c) 10µg of each ATM TALEN plasmid; total junctions for each library are shown (N=1 each) See Supplementary Fig. 15 for additional replicates and concentrations. Dark blue to light blue colored lines indicate RAG1B off-target sites, dark red to yellow colored lines designate ATM TALEN recurrent sites. (d) Graph of multiple RAG1B bait ATM TALEN titration HTGTS libraries plotting the ATM on-target frequency, the sum of the top 5 ATM TALEN off-target sites and the average of junction frequencies along the break-site chromosome (100 regions minus bait break-site region and known ATM off-target sites: 174 sites on chromosome 11, 880bp mean size/site) ranging from 1µg to 100µg each (1µg N=2; 3–10µg N=3; 20–100µg N=2). Libraries were normalized to RAG1B OT1 junction enrichment. (e) The fold enrichment of the ATM TALEN on-target and the sum of the top 5 ATM off-target sites over the ATM TALEN wide-spread, low level DSB activity junctions is indicated for each transfected ATM TALEN plasmid concentration assayed.

Comment in

References

    1. Sander JD, Joung JK. CRISPR-Cas systems for editing, regulating and targeting genomes. Nat. Biotechnol. 2014;32:347–355. - PMC - PubMed
    1. Kim H, Kim JS. A guide to genome engineering with programmable nucleases. Nat. Rev. Genet. 2014;15:321–334. - PubMed
    1. Yang H, et al. One-step generation of mice carrying reporter and conditional alleles by CRISPR/Cas-mediated genome engineering. Cell. 2013;154:1370–1379. - PMC - PubMed
    1. Yin H, et al. Genome editing with Cas9 in adult mice corrects a disease mutation and phenotype. Nat. Biotechnol. 2014;32:551–553. - PMC - PubMed
    1. Cong L, et al. Multiplex genome engineering using CRISPR/Cas systems. Science. 2013;339:819–823. - PMC - PubMed

Publication types