

Oscillation-induced signal transmission and gating in neural circuits
- PMID: 25503492
- PMCID: PMC4263355
- DOI: 10.1371/journal.pcbi.1003940
Oscillation-induced signal transmission and gating in neural circuits
Abstract
Reliable signal transmission constitutes a key requirement for neural circuit function. The propagation of synchronous pulse packets through recurrent circuits is hypothesized to be one robust form of signal transmission and has been extensively studied in computational and theoretical works. Yet, although external or internally generated oscillations are ubiquitous across neural systems, their influence on such signal propagation is unclear. Here we systematically investigate the impact of oscillations on propagating synchrony. We find that for standard, additive couplings and a net excitatory effect of oscillations, robust propagation of synchrony is enabled in less prominent feed-forward structures than in systems without oscillations. In the presence of non-additive coupling (as mediated by fast dendritic spikes), even balanced oscillatory inputs may enable robust propagation. Here, emerging resonances create complex locking patterns between oscillations and spike synchrony. Interestingly, these resonances make the circuits capable of selecting specific pathways for signal transmission. Oscillations may thus promote reliable transmission and, in co-action with dendritic nonlinearities, provide a mechanism for information processing by selectively gating and routing of signals. Our results are of particular interest for the interpretation of sharp wave/ripple complexes in the hippocampus, where previously learned spike patterns are replayed in conjunction with global high-frequency oscillations. We suggest that the oscillations may serve to stabilize the replay.
Conflict of interest statement
The authors have declared that no competing interests exist.
Figures
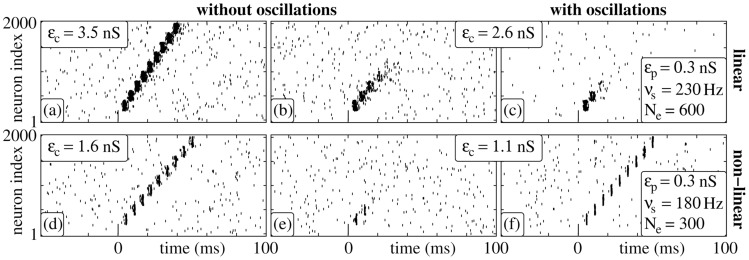
 are shown. Panels (a), (b), (d) and (e) display the network activity in the absence of oscillations; in panels (c) and (f) balanced oscillatory input is present (parameters see inset). The stimulation frequency
  equals the propagation frequency
  of the stable propagation shown in (a) and (d).
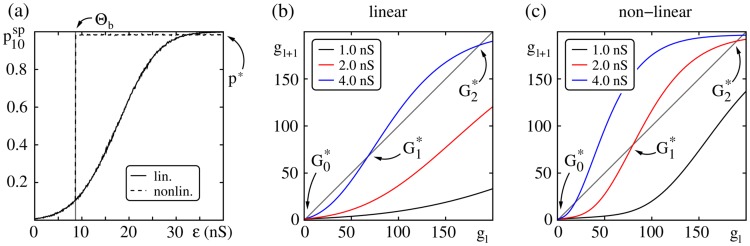
 that a single neuron in the ground state (receiving homogenous background inputs) spikes within 10 ms after stimulation by a synchronous input pulse of strength
  . For neurons with linear dendritic interactions (additive coupling; solid line) the spiking probability increases continuously with increasing input
  . For neurons with nonlinear dendritic interactions (non-additive coupling; dashed line), inputs larger than the dendritic threshold
  elicit a dendritic spike and therefore the spiking probability jumps to a constant value,
  , for
, for  . The probabilities are estimated from averaging over
  single trials per connection strength. (b,c) Maps (2), specifying the average number of synchronously spiking neurons
  in one layer given that in the previous layer
  neurons have spiked synchronously; derived from the single neuron response probability in (a) for an isolated FFN (here
  ,
,  ). Different colors indicate different strengths of feed-forward connections (
 nS); panel (b) shows the map for additive and panel (c) for non-additive coupling. For weak connection strength there is only one fixed point
  corresponding to the extinction of a synchronous pulse. With increasing coupling strength two additional fixed points
  and
and  emerge via a tangent bifurcation. This bifurcation marks the transition from a non-propagating to a propagating regime.
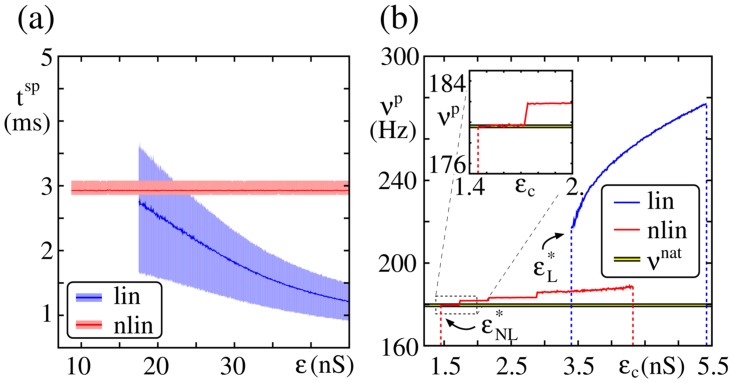
 of a neuron after stimulation with an input of strength
  (shaded areas indicate the regions between the 0.2 and 0.8 quantiles; only data for
  are shown). For neurons with nonlinear dendritic interactions
  is constant, whereas for neurons with linear dendritic interactions
  decreases with increasing stimulation strength
  . (b) Propagation frequency
  of a synchronous pulse versus strength of the feed-forward connections
  in the absence of external oscillations (
 ,
,  ); the inset shows a zoomed view of the propagation frequency in FFNs with non-additive couplings for
  . The yellow line indicates the natural propagation frequency
  .
.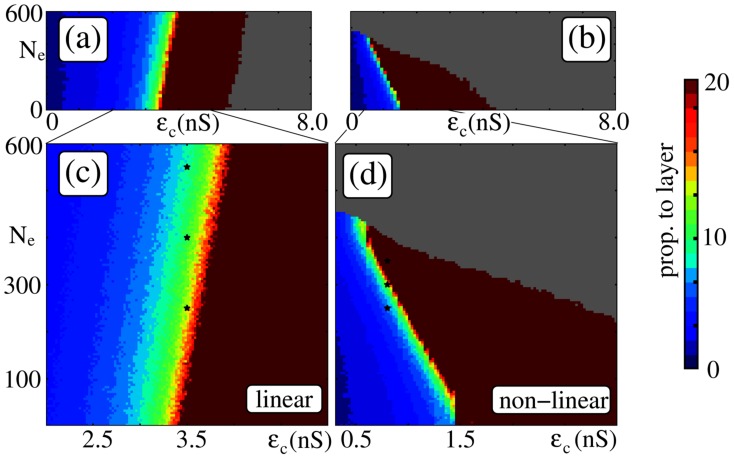
 and the amplitude of the external network oscillations, measured by
  . Configurations, where the system enters a pathological activity state (i.e., ongoing spontaneous propagation of synchrony) are marked in gray. Panels (a,c) show simulation results for networks with linear dendritic interactions (
 Hz,
Hz,  ms) and (b,d) for networks with nonlinear dendritic interactions (
 Hz,
Hz,  ms); panels (c) and (d) are close up views of (a) and (b). The black stars indicate the values of
  and
and  used in Fig. 6a,c. Whereas balanced oscillations hinder signal propagation in additively coupled networks (i.e., require compensation by stronger coupling), they can support it in non-additively coupled ones. Other parameters are
  ,
,  nS,
nS,  nS.
nS.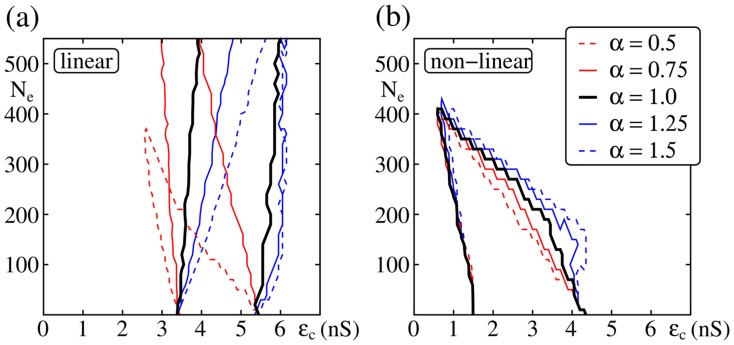
 as indicated in (b). The lines inclose the parameter regions for which an initial synchronous pulse is detectable up to the final layer. (a) For FFNs with linear dendritic interactions unbalanced oscillations may foster propagation of synchrony, if the excitation exceeds the inhibition (
 , i.e.,
  ; red lines) or impede it, if the inhibition exceeds the excitation, respectively (
 , i.e.,
  ; blue lines). (b) In contrast, in FFNs with nonlinear dendritic interactions the balance between excitation and inhibition has only a weak effect on the parameter region in which robust propagation of synchrony is possible.
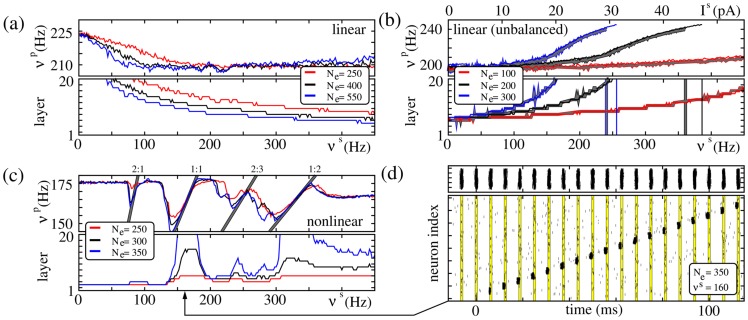
 nS, (b)
  nS and (c,d)
  nS. (a–c) The upper panels display the propagation frequency
  of the synchronous signal, the lower panels show the layer up to which propagation occurs, as a function of the stimulation frequency
  for FFNs with (a,b) linear and (c) nonlinear dendritic interactions. Different colors represent different amplitudes
  of external oscillations as indicated by insets. In additively coupled FFNs (a) balanced oscillations hinder synchrony propagation, whereas (b) unbalanced oscillations (
 , i.e., excitation exceeds inhibition, cf. Equation 4) support it. This support, however, might be equally well achieved by temporally constant additional excitatory inputs: The thick gray filled lines indicate the propagation properties of an FFN, where single neurons receive constant additional current
  (red; upper vertical axis),
  (black) or
  (blue). For very strong depolarization (high
  or
or  ) the network enters a pathological activity state; this break-down of network stability is indicated by the vertical lines in the lower panel. In non-additively coupled FFNs even (c) balanced oscillations foster synchrony propagation and, in contrast to additively coupled FFNs, the propagating signal may lock to the oscillatory stimulation if the ratio
  is rational; the gray lines indicate
  . This locking is illustrated in (d): Raster plots of spikes of the external oscillating population (upper panel) and of the FFN (lower panel). The yellow lines indicate the time intervals
  for
for  , containing
  of the spikes of the external oscillatory population (cf. also Fig. 7).
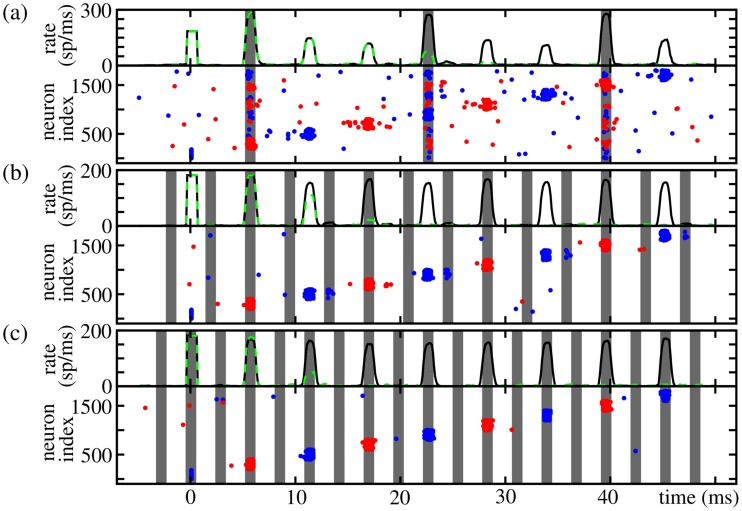
 and the natural propagation frequency
  is rational: (a)
  Hz, (b)
  Hz and (c)
  Hz. The gray areas indicate the time interval in which the external oscillations may contribute to the generation of somatic spikes. At
  synchronous activity is induced in the first layer. The upper panels show the spiking rate of neurons of the FFN in the presence of external oscillations (black solid). The firing rates for identical networks, where the oscillatory input stops at
  are shown for comparison (green dashed). The lower panels show the spiking activity of the first nine layers (odd layers: red, even layers: blue). Other parameters are (a–c)
  ,
,  ms,
ms,  nS,
nS,  and (a)
  nS,
nS,  , (b)
, (b)  nS,
nS,  and (c)
  nS,
nS,  .
.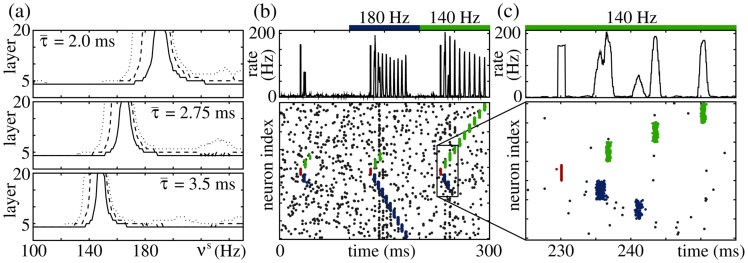
 (distribution width
  ms) resonance peaks (isolated FFN;
  ,
,  ,
,  ,
,  nS) are shifted to lower frequencies (cf. Equation 6). The panels show up to which layer a synchronous pulse propagates in the presence of balanced oscillations (
 ,
,  ,
,  nS,
nS,  nS,
nS,  ms). The width of the resonance peaks increases with increasing size of the dendritic integration window (solid:
  ms, dashed:
  ms, dotted:
  ms). (b) Raster plot of the spiking activity of a recurrent network (
 ,
,  ,
,  nS,
nS,  nS) which contains two FFNs (
 ,
,  ,
,  nS) which share the initial layer. Both FFNs have different average coupling delays (
 ms and
  ms;
ms;  ms) and thus different resonance frequencies (cf. panel a); for the remaining connections the average coupling delays is
  ms. Whereas a synchronous pulse extinguishes after a few layers in the absence of oscillations (
 ms), it may propagate along the layers of one FFN or the other depending on the stimulation frequency (
 ms and
  ms;
ms;  ,
,  nS,
nS,  nS,
nS,  ms). Panel (c) is a close-up view of the raster plot shown in (b).
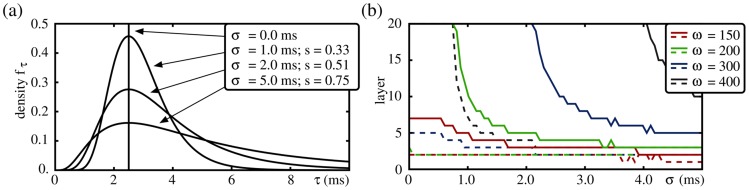
 ms and different standard deviations
  (cf. also Equation 11). (b) The panel shows up to which layer a synchronous pulse propagates in the presence (solid lines) and in the absence (dashed lines) of balanced oscillations for different layer sizes
  (color code). The network setup is the same as in Fig. 4 (
 ,
,  ,
,  nS; with external oscillation parameters:
  ,
,  nS,
nS,  nS,
nS,  nS,
nS,  ,
,  Hz). With increasing width of the delay distribution, the inputs from one layer to the following layer become more and more desynchronized, and thus signals propagate over fewer and fewer layers. However, by increasing the layer size oscillation-induced signal propagation is possible, even for very broad delay distributions. For further explanation see text.
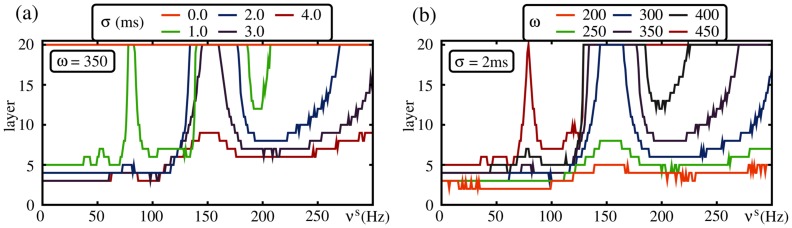
 . In (a) the layer size is fixed (
 ) and the width
  of the delay distribution is varied. Here, for heterogeneous coupling delays (orange) a synchronous signal propagates for all stimulation frequencies (and even in the absence of external stimulations). With increasing
  the fraction of frequencies for which a robust signal propagation is possible decreases, and for sufficiently large
  no robust signal propagation is possible anymore (red). In (b) the width of the delay distribution is fixed (
 ms) and the layer size
  is varied. Here, for small
  robust signal propagation is not possible (independent of the stimulation frequency), however, with increasing layer size the fraction of stimulation frequencies which enable a robust signal propagation increases. For further explanation see text.
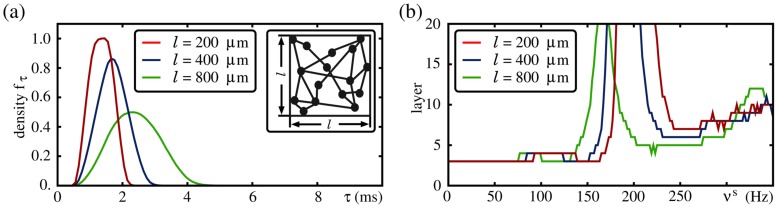
 . The conduction delay is composed of the distance-dependent axonal delay and the uniformly distributed dendritic delay (for details see Equations (12) – (15) and explaining text). (b) The panel shows up to which layer a synchronous pulse propagates along an FFN with the delay distribution taken from (a) in the presence of balanced oscillations for different patch sizes
  . The network setup is the same as in Fig. 9. With increasing patch size
  , and thus increasing connection lengths, the resonance frequencies are shifted to lower values. For further discussion see text.
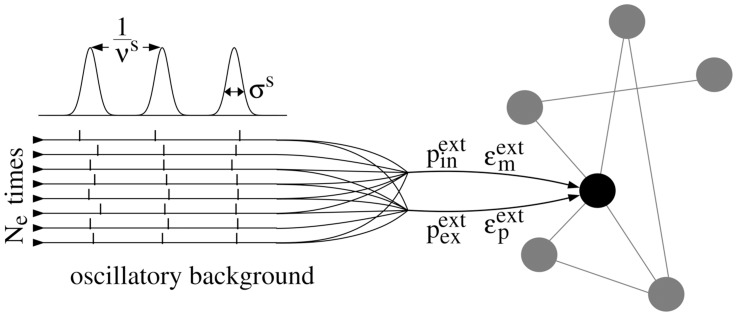
 neurons which spike once during each oscillation period of length
  . The actual spiking times are drawn from a Gaussian distribution. At each neuron in the network, each spike causes an excitatory input of strength
  with probability
  and an inhibitory input of strength
  with probability
  . Additionally to the oscillatory input, neuron receive inputs from recurrent connections and Poissonian spike trains which are not displayed in the fig.
References
-
- van Vreeswijk C, Sompolinsky H (1996) Chaos in neuronal networks with balanced excitatory and inhibitory activity. Science 274: 1724. - PubMed
-
- van Vreeswijk C, Sompolinsky H (1998) Chaotic balanced state in a model of cortical circuits. Neural Comput 10: 1321. - PubMed
-
- Brunel N (2000) Dynamics of sparsely connected networks of excitatory and inhibitory spiking neurons. J Comput Neurosci 8: 183–208. - PubMed
-
- Denker M, Timme M, Diesmann M, Wolf F, Geisel T (2004) Breaking synchrony by heterogeneity in complex networks. Phys Rev Lett 92: 074103. - PubMed
Publication types
MeSH terms
LinkOut - more resources
Full Text Sources
Other Literature Sources
