

TIGAR regulates glycolysis in ischemic kidney proximal tubules
- PMID: 25503731
- PMCID: PMC4329488
- DOI: 10.1152/ajprenal.00459.2014
TIGAR regulates glycolysis in ischemic kidney proximal tubules
Abstract
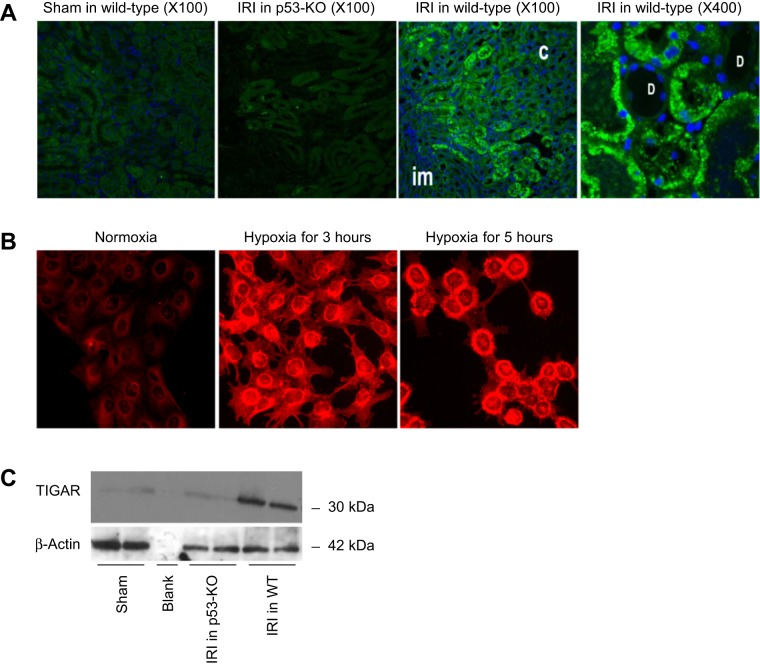
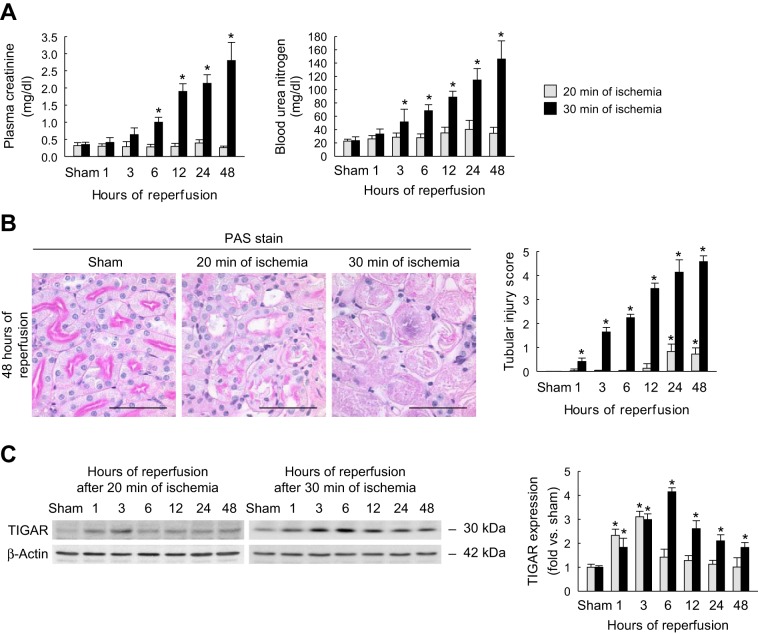
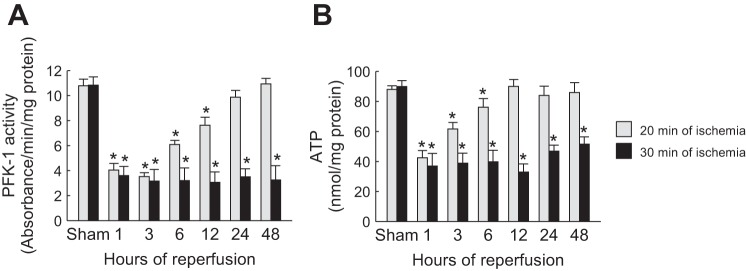
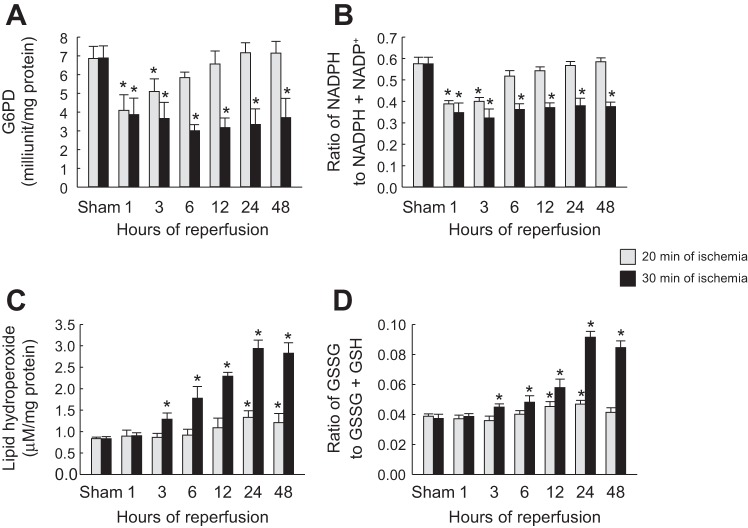
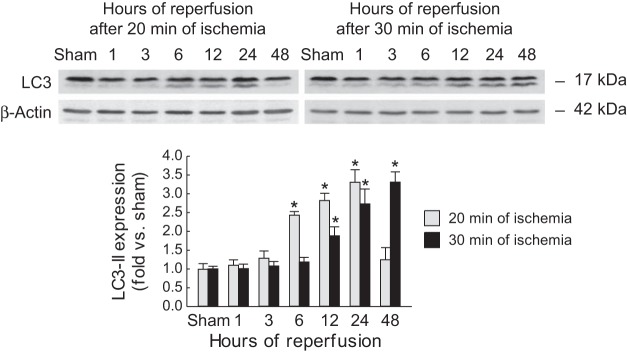
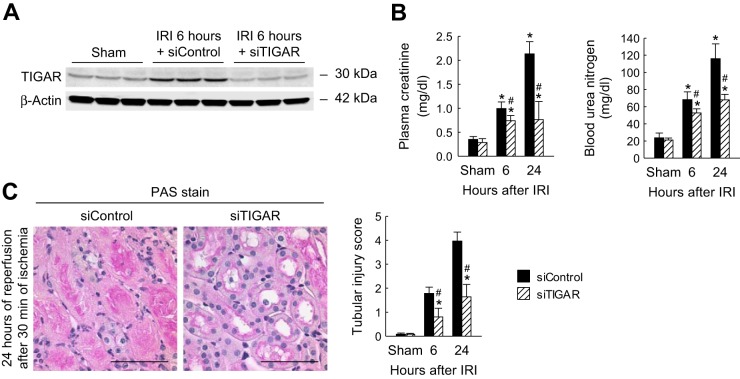
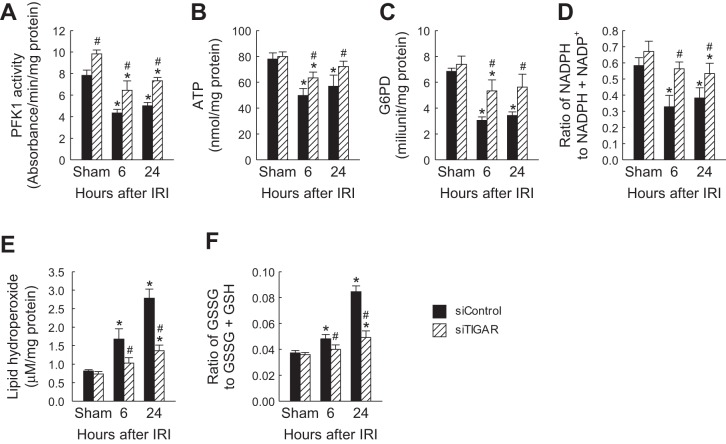
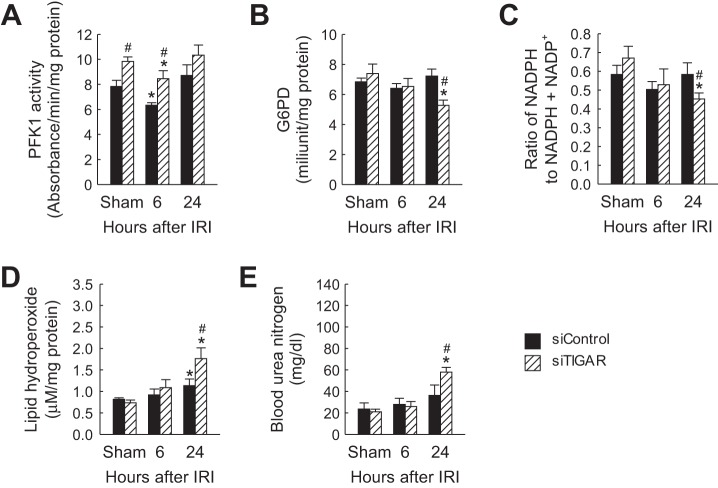
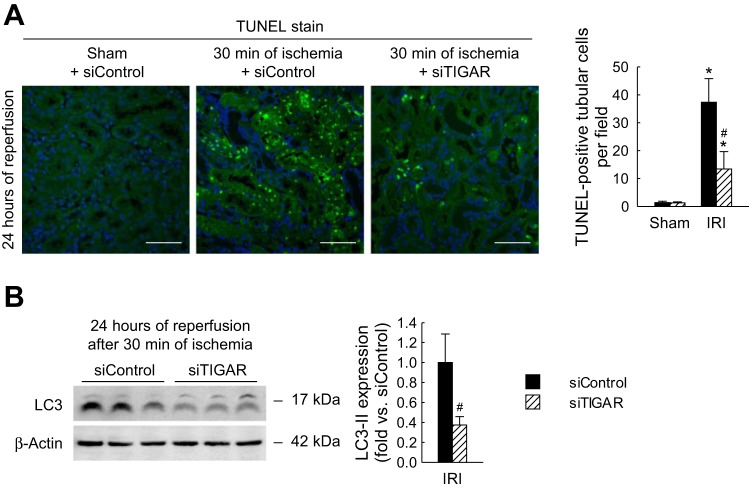
Tp53-induced glycolysis and apoptosis regulator (TIGAR) activation blocks glycolytic ATP synthesis by inhibiting phosphofructokinase-1 activity. Our data indicate that TIGAR is selectively induced and activated in renal outermedullary proximal straight tubules (PSTs) after ischemia-reperfusion injury in a p53-dependent manner. Under severe ischemic conditions, TIGAR expression persisted through 48 h postinjury and induced loss of renal function and histological damage. Furthermore, TIGAR upregulation inhibited phosphofructokinase-1 activity, glucose 6-phosphate dehydrogenase (G6PD) activity, and induced ATP depletion, oxidative stress, autophagy, and apoptosis. Small interfering RNA-mediated TIGAR inhibition prevented the aforementioned malevolent effects and protected the kidneys from functional and histological damage. After mild ischemia, but not severe ischemia, G6PD activity and NADPH levels were restored, suggesting that TIGAR activation may redirect the glycolytic pathway into gluconeogenesis or the pentose phosphate pathway to produce NADPH. The increased level of NADPH maintained the level of GSH to scavenge ROS, resulting in a lower sensitivity of PST cells to injury. Under severe ischemia, G6PD activity and NADPH levels were reduced during reperfusion; however, blockade of TIGAR enhanced their levels and reduced oxidative stress and apoptosis. Collectively, these results demonstrate that inhibition of TIGAR may protect PST cells from energy depletion and apoptotic cell death in the setting of severe ischemia-reperfusion injury. However, under low ischemic burden, TIGAR activation induces the pentose phosphate pathway and autophagy as a protective mechanism.
Keywords: ATP depletion; Tp53-induced glycolysis and apoptosis regulator; glycolytic inhibition; ischemic renal injury; phosphofructokinase; proximal straight tubules.
Copyright © 2015 the American Physiological Society.
Figures
Similar articles
-
TIGAR contributes to ischemic tolerance induced by cerebral preconditioning through scavenging of reactive oxygen species and inhibition of apoptosis.Sci Rep. 2016 Jun 3;6:27096. doi: 10.1038/srep27096. Sci Rep. 2016. PMID: 27256465 Free PMC article.
-
p53 and TIGAR regulate cardiac myocyte energy homeostasis under hypoxic stress.Am J Physiol Heart Circ Physiol. 2010 Dec;299(6):H1908-16. doi: 10.1152/ajpheart.00250.2010. Epub 2010 Oct 8. Am J Physiol Heart Circ Physiol. 2010. PMID: 20935145
-
G6PD plays a neuroprotective role in brain ischemia through promoting pentose phosphate pathway.Free Radic Biol Med. 2017 Nov;112:433-444. doi: 10.1016/j.freeradbiomed.2017.08.011. Epub 2017 Aug 18. Free Radic Biol Med. 2017. PMID: 28823591
-
Deciphering the Controversial Role of TP53 Inducible Glycolysis and Apoptosis Regulator (TIGAR) in Cancer Metabolism as a Potential Therapeutic Strategy.Cells. 2025 Apr 15;14(8):598. doi: 10.3390/cells14080598. Cells. 2025. PMID: 40277923 Free PMC article. Review.
-
The diverse role of TIGAR in cellular homeostasis and cancer.Free Radic Res. 2018 Dec;52(11-12):1240-1249. doi: 10.1080/10715762.2018.1489133. Epub 2018 Oct 4. Free Radic Res. 2018. PMID: 30284488 Review.
Cited by
-
The dysregulation of metabolic pathways and induction of the pentose phosphate pathway in renal ischaemia-reperfusion injury.J Pathol. 2021 Apr;253(4):404-414. doi: 10.1002/path.5605. Epub 2021 Jan 31. J Pathol. 2021. PMID: 33338266 Free PMC article.
-
Altered expression profile of glycolytic enzymes during testicular ischemia reperfusion injury is associated with the p53/TIGAR pathway: effect of fructose 1,6-diphosphate.PeerJ. 2016 Jul 5;4:e2195. doi: 10.7717/peerj.2195. eCollection 2016. PeerJ. 2016. PMID: 27441124 Free PMC article.
-
The platelet isoform of phosphofructokinase contributes to metabolic reprogramming and maintains cell proliferation in clear cell renal cell carcinoma.Oncotarget. 2016 May 10;7(19):27142-57. doi: 10.18632/oncotarget.8382. Oncotarget. 2016. PMID: 27049827 Free PMC article.
-
TIGAR contributes to ischemic tolerance induced by cerebral preconditioning through scavenging of reactive oxygen species and inhibition of apoptosis.Sci Rep. 2016 Jun 3;6:27096. doi: 10.1038/srep27096. Sci Rep. 2016. PMID: 27256465 Free PMC article.
-
Repeated Administration of Cisplatin Transforms Kidney Fibroblasts through G2/M Arrest and Cellular Senescence.Cells. 2022 Nov 2;11(21):3472. doi: 10.3390/cells11213472. Cells. 2022. PMID: 36359868 Free PMC article.
References
-
- Bagnasco S, Good D, Balaban R, Burg M. Lactate production in isolated segments of the rat nephron. Am J Physiol Renal Fluid Electrolyte Physiol 248: F522–F526, 1985. - PubMed
-
- Bensaad K, Tsuruta A, Selak MA, Vidal MN, Nakano K, Bartrons R, Gottlieb E, Vousden KH. TIGAR, a p53-inducible regulator of glycolysis and apoptosis. Cell 126: 107–120, 2006. - PubMed
-
- Berger NA. Poly(ADP-ribose) in the cellular response to DNA damage. Radiat Res 101: 4–15, 1985. - PubMed
-
- Berl T. American Society of Nephrology Renal Research Report. J Am Soc Nephrol 16: 1886–1903, 2005. - PubMed
Publication types
MeSH terms
Substances
Grants and funding
LinkOut - more resources
Full Text Sources
Other Literature Sources
Medical
Molecular Biology Databases
Research Materials
Miscellaneous