. 2014 Dec 12;9(12):e113036.
doi: 10.1371/journal.pone.0113036. eCollection 2014.

Characterization of X chromosome inactivation using integrated analysis of whole-exome and mRNA sequencing

Affiliations

Characterization of X chromosome inactivation using integrated analysis of whole-exome and mRNA sequencing

Szabolcs Szelinger et al. PLoS One. .

Abstract

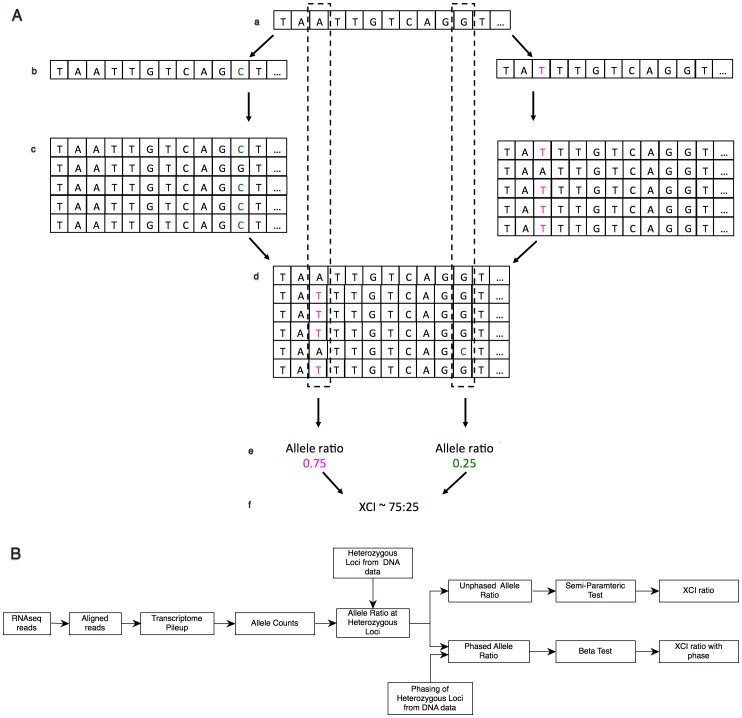
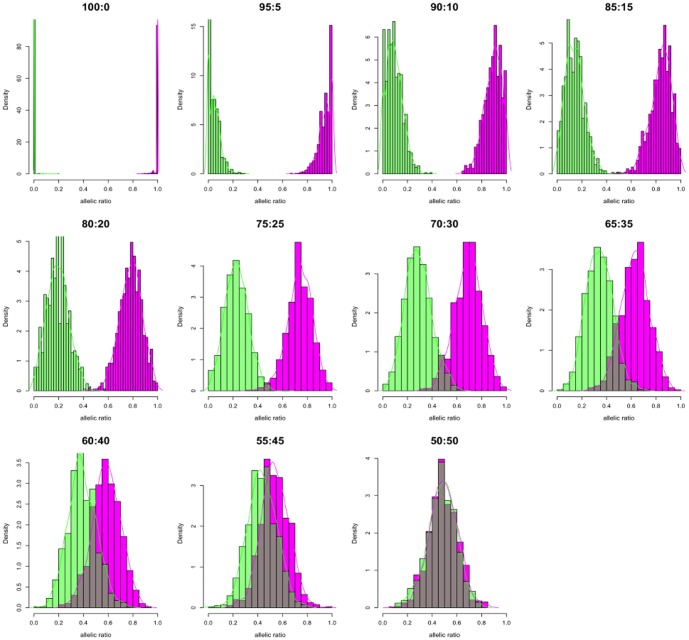
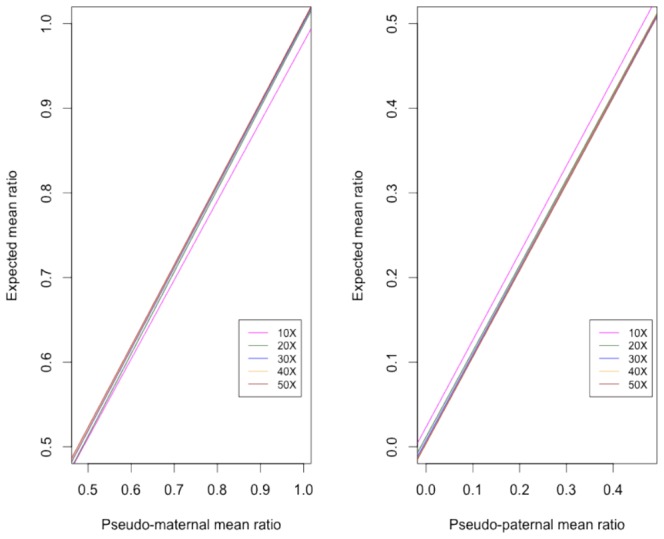
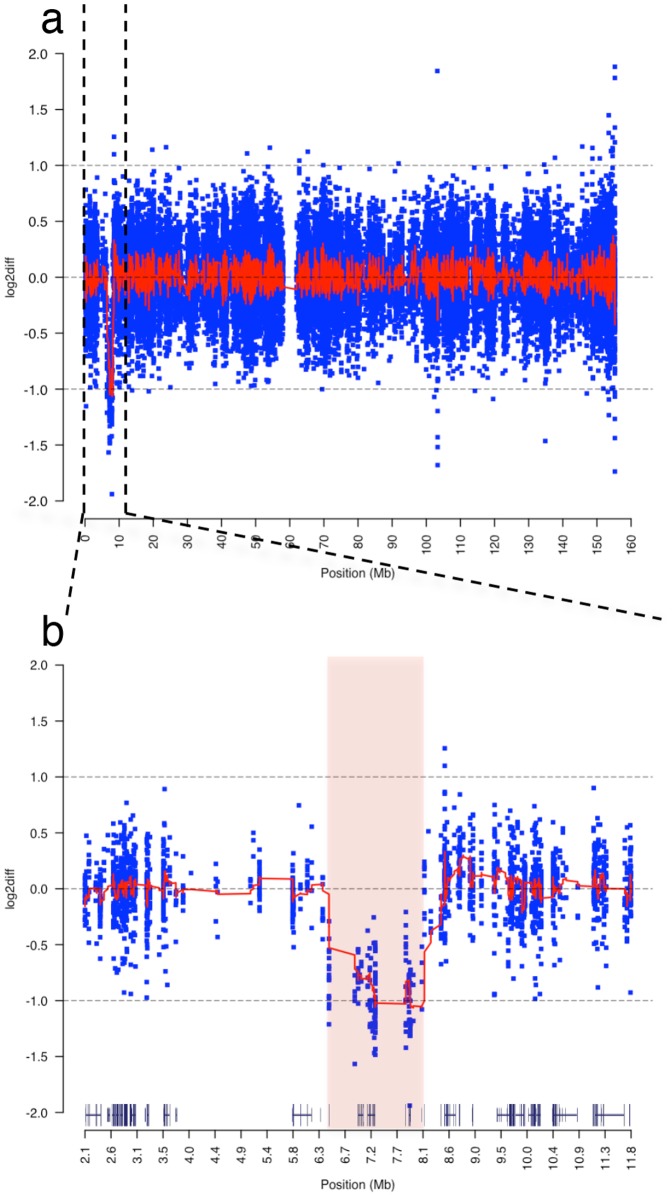
In females, X chromosome inactivation (XCI) is an epigenetic, gene dosage compensatory mechanism by inactivation of one copy of X in cells. Random XCI of one of the parental chromosomes results in an approximately equal proportion of cells expressing alleles from either the maternally or paternally inherited active X, and is defined by the XCI ratio. Skewed XCI ratio is suggestive of non-random inactivation, which can play an important role in X-linked genetic conditions. Current methods rely on indirect, semi-quantitative DNA methylation-based assay to estimate XCI ratio. Here we report a direct approach to estimate XCI ratio by integrated, family-trio based whole-exome and mRNA sequencing using phase-by-transmission of alleles coupled with allele-specific expression analysis. We applied this method to in silico data and to a clinical patient with mild cognitive impairment but no clear diagnosis or understanding molecular mechanism underlying the phenotype. Simulation showed that phased and unphased heterozygous allele expression can be used to estimate XCI ratio. Segregation analysis of the patient's exome uncovered a de novo, interstitial, 1.7 Mb deletion on Xp22.31 that originated on the paternally inherited X and previously been associated with heterogeneous, neurological phenotype. Phased, allelic expression data suggested an 83∶20 moderately skewed XCI that favored the expression of the maternally inherited, cytogenetically normal X and suggested that the deleterious affect of the de novo event on the paternal copy may be offset by skewed XCI that favors expression of the wild-type X. This study shows the utility of integrated sequencing approach in XCI ratio estimation.


Conflict of interest statement

Competing Interests: The authors have declared that no competing interests exist.

Figures

Figure 1
Figure 1. Schematic view of estimation of XCI ratio from read count data.
(A) Overview of the simulation study. From a reference transcriptome (a), two haplotypes are simulated with known variant alleles (b). Sequence read simulator generates reads with error attributes using the two haplotypes as reference (c). The reads from both read simulations are merged and aligned back to the original reference (d, dashed lines). Counting the number of reads mapping to each known allele, the allelic ratio of mapped variant alleles can be determined (e). The overall XCI ratio is determined for large number of variants by estimating the mean of the allele ratio distributions of multiple alleles (f). (B) Workflow of XCI estimation from RNAseq experiment using phased and unphased approaches. Essentially, RNAseq reads are aligned followed by obtaining the transcriptome pileup at each sequenced loci. This is followed by counting the number of reads mapping to each allele across the transcriptome. Next, loci are reduced to those that contain heterozygous calls in the genomic DNA and allelic ratio is calculated at each heterozygous locus. If there is no available information on the phase of X-linked alleles at heterozygous loci, the unphased, X-linked allelic ratios are evaluated for their distribution using semi-parametric model and XCI is reported from the parameters of the semi-parametric model. When transmission of alleles can be obtained from DNA data, the phased, X-linked allele ratios are evaluated by the beta distribution and XCI reported from the parameters of the beta model with the phase of XCI.
Figure 2
Figure 2. Phasing and distribution of in silico allelic ratios.
Histograms of showing the allelic ratio distribution after each heterozygous SNP in the in silico data is assigned phase. Each heterozygous SNP allele was covered with at least 20 reads. Alt-M allelic ratios [magenta] and Alt-P allelic ratios [green] in bins of 20. Dark bars indicate SNP ratios that overlap between phased groups. Colored lines are the kernel density estimates of the phased allelic ratio distributions.
Figure 3
Figure 3. Correlation of expected and observed XCI ratios in terms of sequence coverage.
(A) The mean allelic ratio of the Alt-M alleles the in silico data to their corresponding expected allelic ratio. Eg. in 70∶30 simulation, Alt maternal alleles have an observed mean allelic ratio of 69.0. (B) The mean allelic ratio of Alt-P alleles from each in silico dataset. Eg. in 70∶30 simulation, Alt-P alleles have an observed allelic ratio of 27.6. Each color indicates the correlation of observed vs. expected ratios at minimum sequence coverage of 10X, 20X, 30X, 40X, and 50X. Pearson correlation coefficient was highest at r>0.9998 above 20X read coverage.
Figure 4
Figure 4. Characterization of de novo, interstitial, heterozygous deletion on Xp22.31.
(a) Chromosomal view of log2 coverage difference between affected child and mother obtained by WES. The log2 difference of normalized read coverage between affected child and mother is shown on the y axis, with each blue dot indicating log2 difference in normalized sequence coverage in a 100 bp window. The red line across the chromosome is the mean log2 differences across a sliding window of 25. A large deletion on chromosome X is recognizable in the child indicated by drop in log2 difference to −1 between 0–10Mbase. (b) Zoomed in view of reduced sequence read coverage between 6.4–8.1Mbase of the short arm of the chromosome. The pink shaded area indicates the deletion breakpoints predicted by aCGH analysis that overlaps with deletion seen by the exome coverage analysis. Gene tracks above the x-axis were obtained from UCSC Genome Browser and contain the deleted genes VCX3A, HDHD1, STS, VCX, PNPLA4 genes and MI4767 microRNA genes.
Figure 5
Figure 5. Determining phase of rs5933863.
Next-generation sequencing traces visualized using the Integrated Genomic Viewer (IGV) and below them the corresponding Sanger traces of rs5933863 G>A alleles in the STS gene that helped determine phase and origin of the 1.7 Mb deletion on chromosome X . Patient's IGV and Sanger traces (a) indicate that she is either homozygous G/G or hemizygous “G” genotype at this position. The mother's (b) and the father's (c) traces indicate that they are “G/A” and “A” genotype, respectively.
Figure 6
Figure 6. Phased allelic expression on chromosome X.
(A) Allelic ratio of heterozygous SNPs show bimodal distribution of the expressed maternal (magenta dots, n = 37) and paternal (green dots, n = 44) alleles indicated biased expression of the inherited chromosomes. (B) Chromosome-wide allele frequency of the phased alleles from RNAseq indicate that overall, maternal X has a preferential expression in the patient with mean ratio across X of 0.82.7±0.083 (dashed magenta line), compared to paternal alleles of 0.20.3±0.095 (green dashed line). Biased expression in favor of the maternally inherited alleles is preserved across the entire length of the chromosome. However, alleles within genes that potentially escape X inactivation can show bi-allelic expression as defined by an allelic ratio 2SD outside the mean of the phased allele ratios (colored, dotted lines). Essentially all high quality heterozygous SNPs with a minimum of 20X coverage could be phased based on transmission of alleles within the X-linked region. SNPs where transmission of alleles could not be determined (clear circle) lie predominantly in the pseudoautosomal region (PAR1) except two Mendelian errors.

Similar articles

Cited by

References

    1. Dixon-Salazar TJ, Silhavy JL, Udpa N, Schroth J, Bielas S, et al. (2012) Exome Sequencing Can Improve Diagnosis and Alter Patient Management. Science Translational Medicine 4:138ra78–138ra78 10.1126/scitranslmed.3003544 - DOI - PMC - PubMed
    1. Yang Y, Muzny DM, Reid JG, Bainbridge MN, Willis A, et al. (2013) Clinical Whole-Exome Sequencing for the Diagnosis of Mendelian Disorders. N Engl J Med: 131002140031007. doi:10.1056/NEJMoa1306555. - DOI - PMC - PubMed
    1. Gilissen C, Hoischen A, Brunner HG, Veltman JA (2012) Disease gene identification strategies for exome sequencing. 20:490–497 10.1038/ejhg.2011.258 - DOI - PMC - PubMed
    1. Wang Z, Gerstein M, Snyder M (2009) RNA-Seq: a revolutionary tool for transcriptomics. Nat Rev Genet 10:57–63. - PMC - PubMed
    1. Shah SP, Roth A, Goya R, Oloumi A, Ha G, et al. (2012) The clonal and mutational evolution spectrum of primary triple-negative breast cancers. Nature. doi:10.1038/nature10933. - DOI - PMC - PubMed

Publication types