

A genome-wide association study of heparin-induced thrombocytopenia using an electronic medical record
- PMID: 25503805
- PMCID: PMC4433536
- DOI: 10.1160/TH14-08-0670
A genome-wide association study of heparin-induced thrombocytopenia using an electronic medical record
Abstract
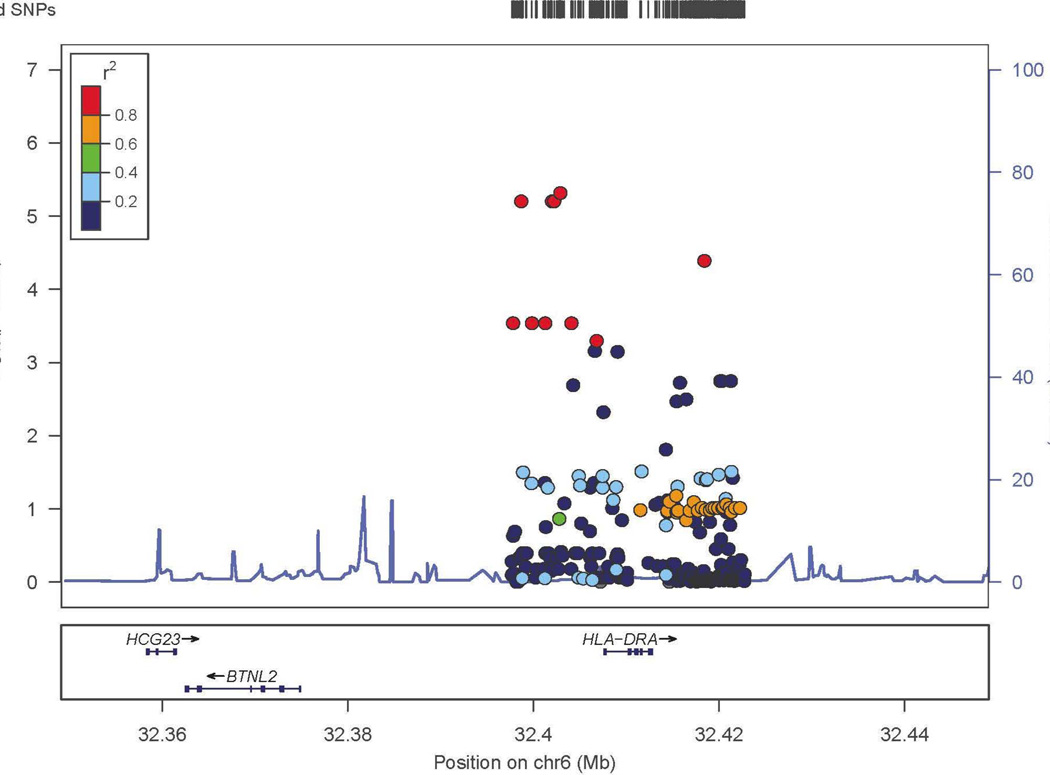
Heparin-induced thrombocytopenia (HIT) is an unpredictable, potentially catastrophic adverse effect of heparin treatment resulting from an immune response to platelet factor 4 (PF4)/heparin complexes. No genome-wide evaluations have been performed to identify potential genetic influences on HIT. Here, we performed a genome-wide association study (GWAS) and candidate gene study using HIT cases and controls identified using electronic medical records (EMRs) coupled to a DNA biobank and attempted to replicate GWAS associations in an independent cohort. We subsequently investigated influences of GWAS-associated single nucleotide polymorphisms (SNPs) on PF4/heparin antibodies in non-heparin treated individuals. In a recessive model, we observed significant SNP associations (odds ratio [OR] 18.52; 95% confidence interval [CI] 6.33-54.23; p=3.18×10(-9)) with HIT near the T-Cell Death-Associated Gene 8 (TDAG8). These SNPs are in linkage disequilibrium with a missense TDAG8 SNP. TDAG8 SNPs trended toward an association with HIT in replication analysis (OR 5.71; 0.47-69.22; p=0.17), and the missense SNP was associated with PF4/heparin antibody levels and positive PF4/heparin antibodies in non-heparin treated patients (OR 3.09; 1.14-8.13; p=0.02). In the candidate gene study, SNPs at HLA-DRA were nominally associated with HIT (OR 0.25; 0.15-0.44; p=2.06×10(-6)). Further study of TDAG8 and HLA-DRA SNPs is warranted to assess their influence on the risk of developing HIT.
Keywords: Pharamacogenetics; heparins; thrombocytopenia.
Conflict of interest statement
The authors declare no competing financial interests.
Figures


Similar articles
-
Early-onset and persisting thrombocytopenia in post-cardiac surgery patients is rarely due to heparin-induced thrombocytopenia, even when antibody tests are positive.J Thromb Haemost. 2010 Jan;8(1):30-6. doi: 10.1111/j.1538-7836.2009.03626.x. Epub 2009 Sep 28. J Thromb Haemost. 2010. PMID: 19793190
-
Cellular immune responses to platelet factor 4 and heparin complexes in patients with heparin-induced thrombocytopenia.J Thromb Haemost. 2018 Jul;16(7):1402-1412. doi: 10.1111/jth.14132. Epub 2018 Jun 5. J Thromb Haemost. 2018. PMID: 29723924
-
A diagnosis of heparin-induced thrombocytopenia with combined clinical and laboratory methods in cardiothoracic surgical intensive care unit patients.Anesth Analg. 2011 Oct;113(4):697-702. doi: 10.1213/ANE.0b013e3182297031. Epub 2011 Jul 25. Anesth Analg. 2011. PMID: 21788317
-
Testing for heparin-induced thrombocytopenia antibodies.Transfus Med Rev. 2006 Oct;20(4):259-72. doi: 10.1016/j.tmrv.2006.05.001. Transfus Med Rev. 2006. PMID: 17008164 Review.
-
Heparin-induced thrombocytopenia.Hematology Am Soc Hematol Educ Program. 2013;2013:668-74. doi: 10.1182/asheducation-2013.1.668. Hematology Am Soc Hematol Educ Program. 2013. PMID: 24319250 Free PMC article. Review.
Cited by
-
Pharmacogenetics to prevent heparin-induced thrombocytopenia: what do we know?Pharmacogenomics. 2018 Dec;19(18):1413-1422. doi: 10.2217/pgs-2018-0147. Epub 2018 Nov 6. Pharmacogenomics. 2018. PMID: 30398086 Free PMC article.
-
GPR65 (TDAG8) inhibits intestinal inflammation and colitis-associated colorectal cancer development in experimental mouse models.Biochim Biophys Acta Mol Basis Dis. 2022 Jan 1;1868(1):166288. doi: 10.1016/j.bbadis.2021.166288. Epub 2021 Oct 8. Biochim Biophys Acta Mol Basis Dis. 2022. PMID: 34628032 Free PMC article.
-
Integrating electronic health record genotype and phenotype datasets to transform patient care.Clin Pharmacol Ther. 2016 Mar;99(3):298-305. doi: 10.1002/cpt.321. Epub 2016 Jan 26. Clin Pharmacol Ther. 2016. PMID: 26667791 Free PMC article.
-
Quantitative and Qualitative Platelet Derangements in Cardiac Surgery and Extracorporeal Life Support.J Clin Med. 2021 Feb 6;10(4):615. doi: 10.3390/jcm10040615. J Clin Med. 2021. PMID: 33561947 Free PMC article. Review.
-
Autoimmunity roots of the thrombotic events after COVID-19 vaccination.Autoimmun Rev. 2021 Nov;20(11):102941. doi: 10.1016/j.autrev.2021.102941. Epub 2021 Sep 9. Autoimmun Rev. 2021. PMID: 34508917 Free PMC article. Review.
References
-
- Warkentin TE, Levine MN, Hirsh J, et al. Heparin-induced thrombocytopenia in patients treated with low-molecular-weight heparin or unfractionated heparin. N Engl J Med. 1995;332(20):1330–1335. - PubMed
-
- Girolami B, Prandoni P, Stefani PM, et al. The incidence of heparin-induced thrombocytopenia in hospitalized medical patients treated with subcutaneous unfractionated heparin: a prospective cohort study. Blood. 2003;101(8):2955–2959. - PubMed
-
- Greinacher A, Farner B, Kroll H, et al. Clinical features of heparin-induced thrombocytopenia including risk factors for thrombosis. A retrospective analysis of 408 patients. Thromb Haemost. 2005;94(1):132–135. - PubMed
-
- Martel N, Lee J, Wells PS. Risk for heparin-induced thrombocytopenia with unfractionated and low-molecular-weight heparin thromboprophylaxis: a meta-analysis. Blood. 2005;106(8):2710–2715. - PubMed
Publication types
MeSH terms
Substances
Grants and funding
LinkOut - more resources
Full Text Sources
Medical
Research Materials
Miscellaneous
