. 2015 Jul;240(7):904-16.
doi: 10.1177/1535370214562338. Epub 2014 Dec 11.

Protective phenotypes of club cells and alveolar macrophages are favored as part of endotoxin-mediated prevention of asthma

Affiliations

Protective phenotypes of club cells and alveolar macrophages are favored as part of endotoxin-mediated prevention of asthma

Luciana N García et al. Exp Biol Med (Maywood). 2015 Jul.

Abstract

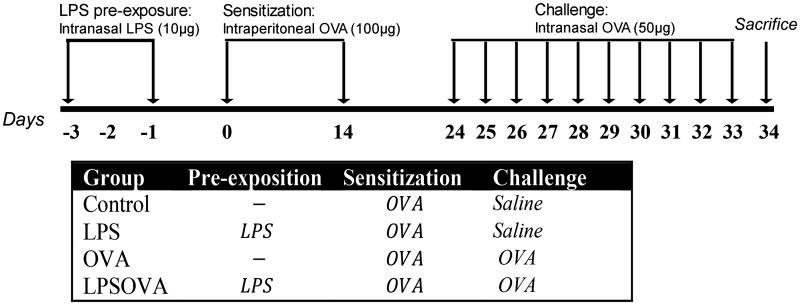
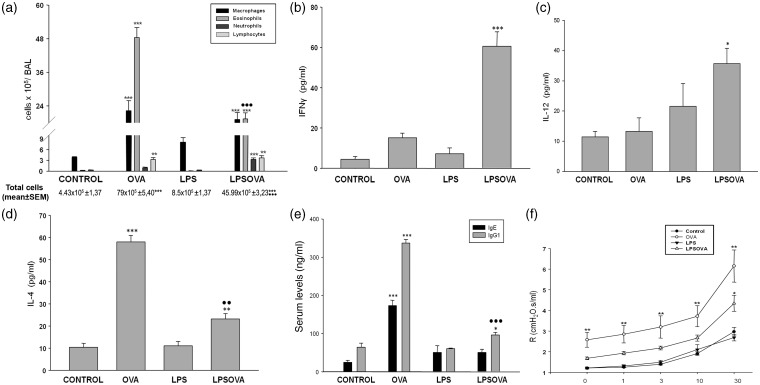
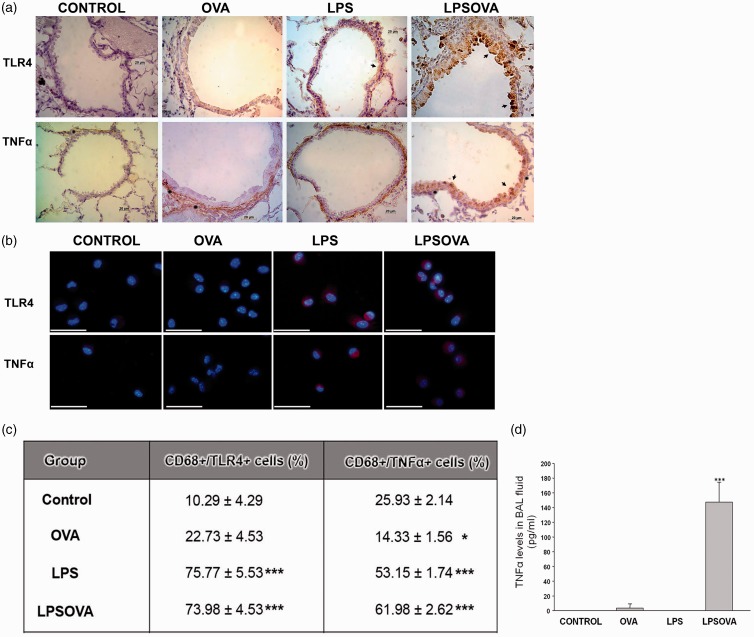
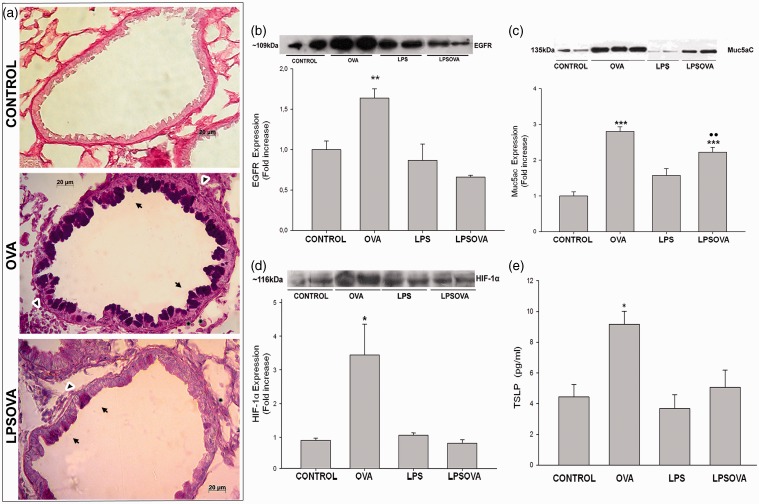
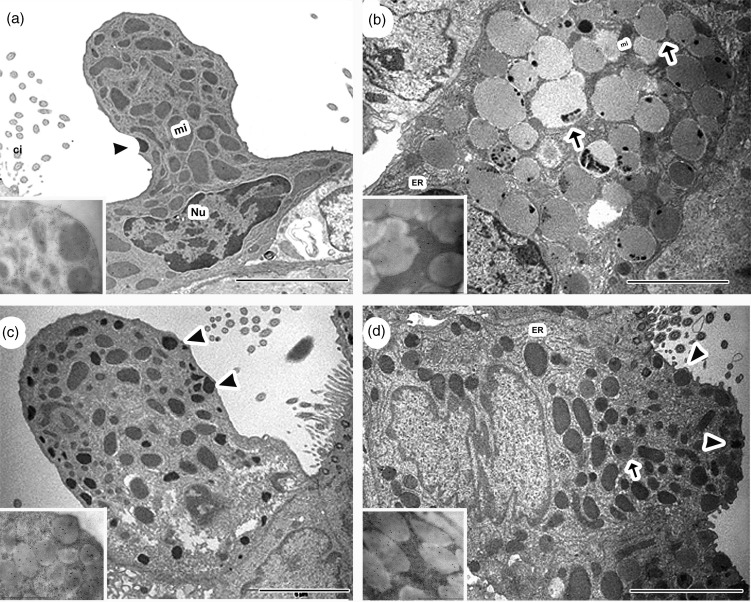
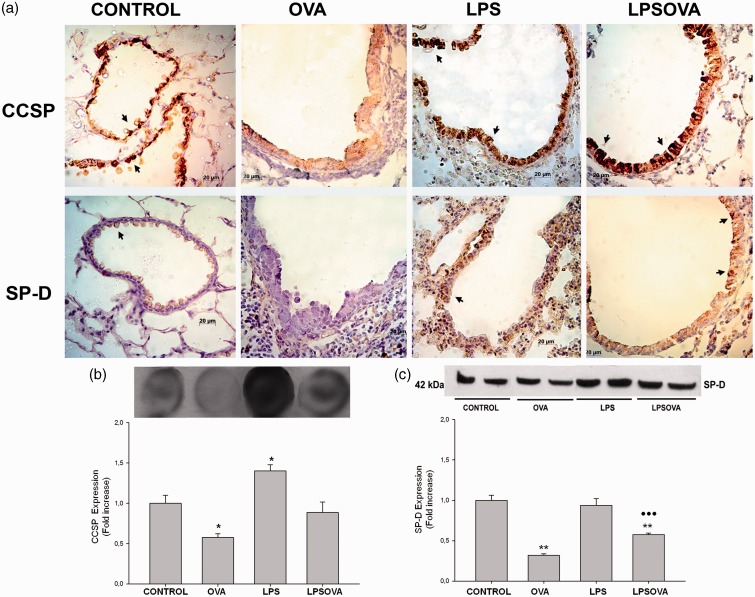
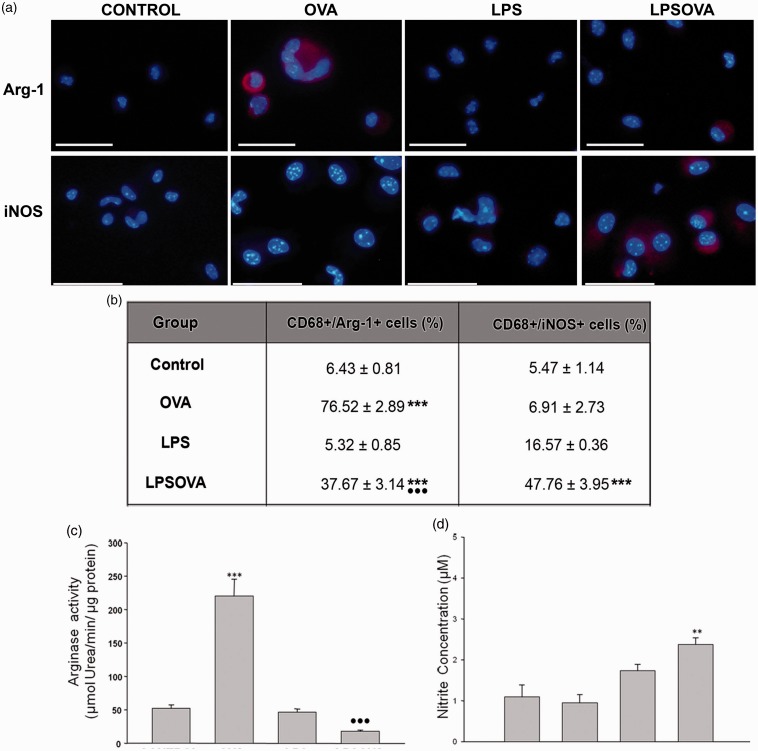
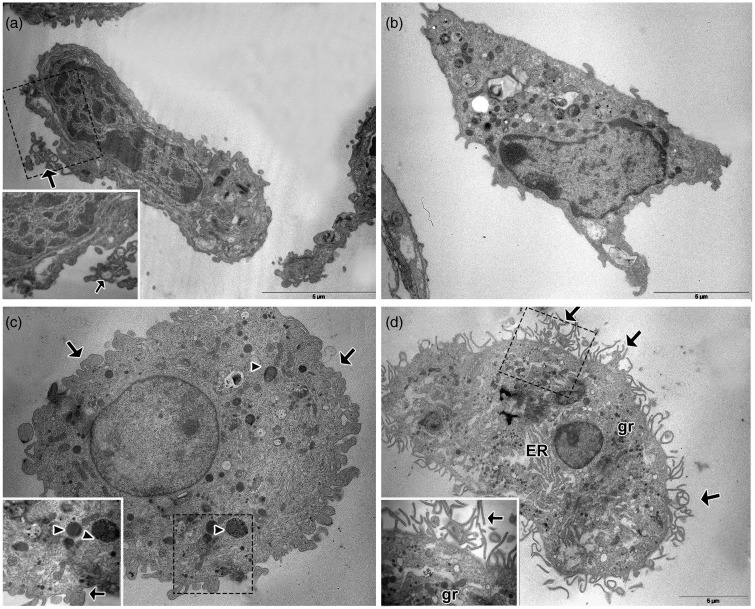
Atopic asthma is a chronic allergic disease that involves T-helper type 2 (Th2)-inflammation and airway remodeling. Bronchiolar club cells (CC) and alveolar macrophages (AM) are sentinel cells of airway barrier against inhaled injuries, where allergy induces mucous metaplasia of CC and the alternative activation of AM, which compromise host defense mechanisms and amplify Th2-inflammation. As there is evidence that high levels of environmental endotoxin modulates asthma, the goal of this study was to evaluate if the activation of local host defenses by Lipopolysaccharide (LPS) previous to allergy development can contribute to preserving CC and AM protective phenotypes. Endotoxin stimulus before allergen exposition reduced hallmarks of allergic inflammation including eosinophil influx, Interleukin-4 and airway hyperreactivity, while the T-helper type 1 related cytokines IL-12 and Interferon-γ were enhanced. This response was accompanied by the preservation of the normal CC phenotype and the anti-allergic proteins Club Cell Secretory Protein (CCSP) and Surfactant-D, thereby leading to lower levels of CC metaplasia and preventing the increase of the pro-Th2 cytokine Thymic stromal lymphopoietin. In addition, classically activated alveolar macrophages expressing nitric oxide were promoted over the alternatively activated ones that expressed arginase-1. We verified that LPS induced a long-term overexpression of CCSP and the innate immune markers Toll-like receptor 4, and Tumor Necrosis Factor-α, changes that were preserved in spite of the allergen challenge. These results demonstrate that LPS pre-exposition modifies the local bronchioalveolar microenvironment by inducing natural anti-allergic mechanisms while reducing local factors that drive Th2 type responses, thus modulating allergic inflammation.

Keywords: Club cell; alveolar macrophage; asthma; pulmonary host defense.


Figures

Figure 1
Figure 1
Experimental design and protocols employed in this study. Protocols included experimental groups of Ovoalbumin (OVA)-sensitized mice on days 0 and 14, which on days 24 to 33 were then challenged daily with intranasal OVA (OVA group) or sham with saline (control group). Furthermore, two lipopolysaccharide (LPS) pre-exposed groups included mice that received two doses of intranasal LPS and then were either OVA challenged (LPSOVA group) or sham-exposed (LPS group)
Figure 2
Figure 2
Inflammatory microenvironmental state. (a) Differential quantification of cell populations in bronchoalveolar lavage (BAL). Bar graph represents total number of macrophages, eosinophils, neutrophils, and lymphocytes in BAL. (b), (c) and (d): Levels of IFNγ, IL-12(p70), and IL-4 in BAL by ELISA. (e) IgE and IgG1 levels by ELISA in mice serum. (f) Measurement of airway reactivity in response to increasing doses of metacholine (Mch) analyzed by invasive plethysmography. Graph represents the resistance measurements obtained 24 h after last intranasal challenge from at least eight animals per group in two independent experiments. Data represent mean ± SD ***P < 0.001 vs control, **P < 0.01 vs control, *P < 0.05 vs control, •• p < 0.01 vs OVA, ••• p < 0.001 vs OVA
Figure 3
Figure 3
Analysis of TLR4 and TNFα expression in club cells and alveolar macrophages. (a) Representative micrographs of TLR4 and TNFα immunostaining performed on lung sections. Positive club cells are stained brown with diaminobenzidine (arrow) against the blue hematoxylin counter staining. Asterisks indicate TNFα positive expression in the subepithelial compartment. Scale bars: 20 µm. (b) Immunofluorescence staining for TLR4 or TNFα in cover slides enriched in macrophages obtained by bronchoalveolar lavage; CD68 immunofluorescence was performed to determine the total macrophage number. Representative micrographs show overlays of cell nuclei staining for DAPI and red TLR4 or TNFα fluorescence, while the percentage of CD68+/TLR4+ cells and CD68+/TNFα+ cells is shown in (c). (d) Levels of TNFα in broncheoalveolar lavage (BAL) fluid determined by ELISA. Data are represented as mean ± SEM. ***P < 0.001 vs control, *P < 0.05 vs control. (A color version of this figure is available in the online journal.)
Figure 4
Figure 4
Mucous metaplasia analysis. (a) Representative photomicrographs of Alcian blue-periodic acid Schiff (AB-PAS) staining on lung sections from control, OVA, and LPSOVA mice. Arrows indicate AB-PAS positive cells in OVA and LPSOVA groups, while asterisks point out the enlarged subepithelial compartment due to thickening of the smooth-muscle cell layer and PAS positive collagen deposition at the basement membrane. In addition, arrowheads in OVA and LPSOVA mice indicate infiltrating inflammatory cells. Scale bars: 20 µm. (b) Western blot of Epithelial Growth Factor Receptor (EGFR). Graph represents fold increase of the relative EGFR/β-actin expression in lung homogenate by densitometric analysis. (c) Western blot of Muc5ac.Graph represents fold increase of the relative Muc5ac expression by densitometric analysis in broncheoalveolar lavage. (d) Western blot of Hypoxia inducible factor 1α (HIF-1α). Graph represents fold increase of the relative HIF-1α/β-actin expression in lung homogenate by densitometric analysis. In (b)–(d), underlined blots indicate independent samples of each group. (e) Level of TSLP in BAL analyzed by ELISA. Data are represented as mean ± SEM, *P < 0.05 vs control, **P < 0.01 vs CONTROL, ***P < 0.001 vs control, ••P < 0.01 vs OVA. (A color version of this figure is available in the online journal.)
Figure 5
Figure 5
Club cell ultrastructural analysis. Representative electron micrograph images of club cell morphology of control (a), OVA (b), LPS (c), and LPSOVA groups (d) are shown. Scale bar represents 5 µm. Inset electron micrographs in (a)–(d) show CC16 immunogold labeling of secretory granules for the different groups. Inset bar represents 2 µm. mi: mitochondria, Nu: nucleus; ER: endoplasmic reticulum; arrowheads: normal electron dense granules; arrows: electron lucid granules
Figure 6
Figure 6
Analysis of Club cell secretory protein (CCSP) and surfactant (SP)-D content. (a) CCSP and SP-D immunostaining performed on lung section of all groups. Positive club cells appear in brown (arrows) against the blue counter stain of haematoxylin. Scale bars: 20 µm. (b) Dot blot of CCSP in lung homogenates. Graph represents fold increase of the relative CCSP expression in lung homogenate by densitometric analysis. (c) Western blot of SP-D lung content. Graph represents fold increase of the relative SP-D/β-actin expression in lung homogenate by densitometric analysis. Underlined blots indicate independent samples of each group. Data are represented as mean ± SEM, *p < 0.05 vs Control, **P < 0.01 vs control, ••• p < 0.001 vs OVA. (A color version of this figure is available in the online journal.)
Figure 7
Figure 7
Analysis of the macrophage polarization biomarkers Arg-1 and iNOS enzymes in alveolar macrophages. (a) Immunofluorescence of CD68 together with arginase-1 (Arg-1) or inducible NO synthase (iNOS) was realized in cover slides enriched in macrophages obtained by bronchoalveolar lavage (BAL); CD68 co-localization was performed to determine the total macrophage number. Representative micrographs show overlays of cell nuclei staining for DAPI and red Arg-1 or iNOS fluorescence only, while the counting percentage of double labeled CD68+/Arg-1+ cells and CD68+/iNOS+ cells are shown in (b). (c) Arginase activity assay performed on homogenates of alveolar macrophages purified from BAL. Graph represents units of arginase activity, defined as the amount of enzyme that catalyzed the formation of 1 µmol urea/min, normalized against total protein. (d) Nitrite levels detected by Griess reaction in culture media obtained during alveolar macrophage purification step. Data are represented as mean ± SEM, scale bars: 20 µm, ***P < 0.001 vs control, **P < 0.01 vs control, •••P < 0.001 vs OVA. Scale bars: 20 µm. (A color version of this figure is available in the online journal.)
Figure 8
Figure 8
Alveolar Macrophage ultrastructural analysis. Representative electron micrographs illustrate the morphology of the alveolar macrophages (AM) in lung serial sections of control (a), LPS (b), OVA (c), and LPSOVA groups (d). Scale bar represents 5 µm. Boxed area in panels (a), (c), and (d) is enlarged and shown as an inset to reveal details of the AM morphology. Arrows indicate filopodial projections and arrowheads show phagosomes. ER: endoplasmic reticulum; gr: granules

Similar articles

Cited by

References

    1. Bateman ED, Hurd SS, Barnes PJ, Bousquet J, Drazen JM, FitzGerald M, Gibson P, Ohta K, O'Byrne P, Pedersen SE, Pizzichini E, Sullivan SD, Wenzel SE, Zar HJ. Global strategy for asthma management and prevention: GINA executive summary. Eur Respir J 2008; 31: 143–78. - PubMed
    1. Galli SJ, Tsai M, Piliponsky AM. The development of allergic inflammation. Nature 2008; 454: 445–54. - PMC - PubMed
    1. Schleimer RP, Kato A, Kern R, Kuperman D, Avila PC. Epithelium: at the interface of innate and adaptive immune responses. J Allergy Clin Immunol 2007; 120: 1279–84. - PMC - PubMed
    1. Murray PJ, Wynn TA. Protective and pathogenic functions of macrophage subsets. Nat Rev Immunol 2011; 11: 723–37. - PMC - PubMed
    1. Barnes PJ. Immunology of asthma and chronic obstructive pulmonary disease. Nat Rev Immunol 2008; 8: 183–92. - PubMed

Publication types