

REDD1 functions at the crossroads between the therapeutic and adverse effects of topical glucocorticoids
- PMID: 25504525
- PMCID: PMC4309667
- DOI: 10.15252/emmm.201404601
REDD1 functions at the crossroads between the therapeutic and adverse effects of topical glucocorticoids
Abstract
Cutaneous atrophy is the major adverse effect of topical glucocorticoids; however, its molecular mechanisms are poorly understood. Here, we identify stress-inducible mTOR inhibitor REDD1 (regulated in development and DNA damage response 1) as a major molecular target of glucocorticoids, which mediates cutaneous atrophy. In REDD1 knockout (KO) mice, all skin compartments (epidermis, dermis, subcutaneous fat), epidermal stem, and progenitor cells were protected from atrophic effects of glucocorticoids. Moreover, REDD1 knockdown resulted in similar consequences in organotypic raft cultures of primary human keratinocytes. Expression profiling revealed that gene activation by glucocorticoids was strongly altered in REDD1 KO epidermis. In contrast, the down-regulation of genes involved in anti-inflammatory glucocorticoid response was strikingly similar in wild-type and REDD1 KO mice. Integrative bioinformatics analysis of our and published gene array data revealed similar changes of gene expression in epidermis and in muscle undergoing glucocorticoid-dependent and glucocorticoid-independent atrophy. Importantly, the lack of REDD1 did not diminish the anti-inflammatory effects of glucocorticoids in preclinical model. Our findings suggest that combining steroids with REDD1 inhibitors may yield a novel, safer glucocorticoid-based therapies.
Keywords: REDD1; glucocorticoid; glucocorticoid receptor; mTOR; skin atrophy.
© 2014 The Authors. Published under the terms of the CC BY 4.0 license.
Figures
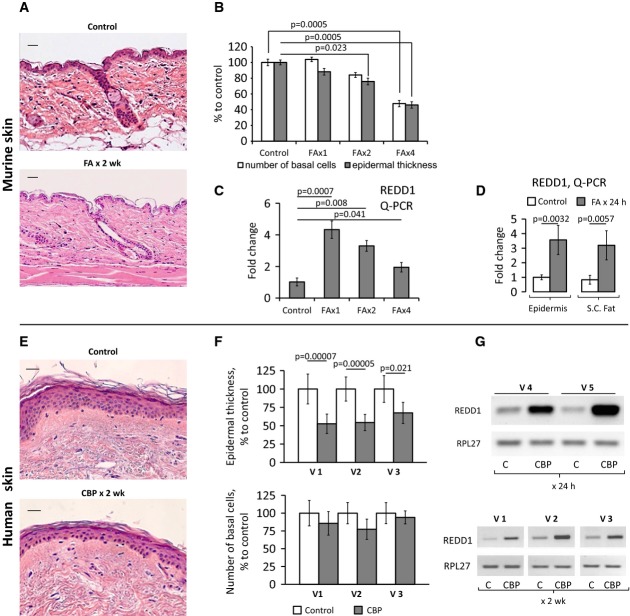
A–G B6D2 mice were treated topically with acetone (vehicle control) or glucocorticoid FA (2 μg/animal), every 72 h for 2 weeks. Human volunteers were treated with 0.05% CPB cream applied to the right arm skin once or daily for 2 weeks. Untreated skin from the left arm was used as a control. H&E staining of mouse skin (A) and human skin (E). Scale bars are 20 μm (A) and 40 μm (E). Morphometric analysis of epidermal thickness and number of basal keratinocytes in mouse skin treated with FA 1, 2, and 4 times (B), and human skin treated daily for 2 weeks (F). REDD1 mRNA expression in mouse epidermis 8 h after 1st, 2nd, and 4th applications of FA (C, Q-PCR), in mouse epidermis and s.c. adipose, 24 h after FA (D, Q-PCR), and in human skin 24 h after single (G, volunteers V4 and V5) and 2-week (G, volunteers V1, V2, V3, RT–PCR) treatment with CBP. RPL27 was used as a cDNA normalization control. In human skin, the means ± SD were calculated in each individual sample compared to the untreated skin from the same individual (30 measurements/condition). In mouse skin, the means ± SD were calculated for three individual skin samples/condition in one representative experiment (30 measurements/condition) out of three experiments. Q-PCR results are the means ± SD calculated for three individual RNA samples/condition. Statistical analysis for differences between treatment and control was done by the unpaired two-tailed t-test.
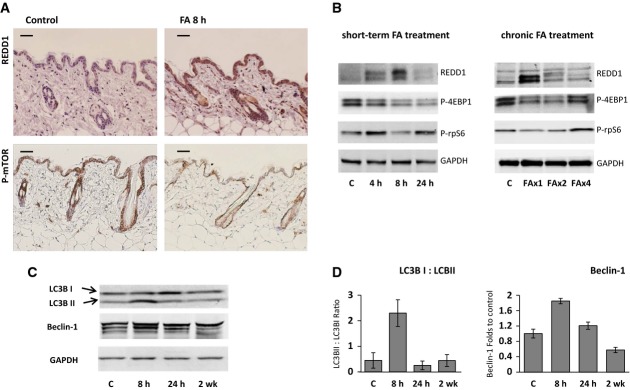
A Immunohistochemical staining of mouse skin treated with acetone or FA for 8 h for REDD1 (upper panels) and phosphorylated mTOR-Ser2448 (lower panels). Scale bars are 20 μm.
B Western blot analysis of REDD1 protein and phosphorylation of down-stream mTOR target proteins 4E-BP1 and rpS6 in murine epidermis. GAPDH is used as a normalization control.
C, D Glucocorticoids induce autophagy in epidermis. Western blot analysis of Beclin-1 and conversion of light chain 3 (LC3) from LC3-I to LC3-II (C). Quantification of LC3-I to LC3-II conversion and Beclin-1 expression (D). The means ± SD were calculated using Western blots from two independent experiments (each lane is whole-cell protein from three pulled individual samples of epidermis).
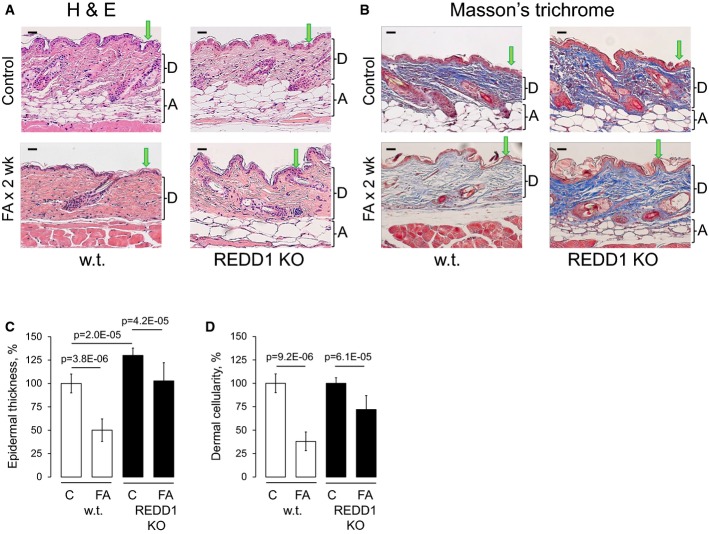
A, B H&E staining (A) and Masson's trichrome staining: Dermis/collagen fibers are blue, muscle is red, nuclei are dark red, and cytoplasm is red/pink (B). Arrows point to epidermis and brackets indicate subcutaneous adipose (A) and dermis (D). Scale bars are 20 μm.
C, D Morphometric analysis of epidermal thickness and dermal cellularity as described in Materials and Methods. Changes in epidermal thickness (C) are presented as % to wild-type control epidermis. Changes in dermal cellularity (D) are presented as % to corresponding control skin. The means ± SD were calculated for three individual skin samples in one representative experiment (30 measurements/condition) out of two experiments. Statistical analysis for differences between treatment and control and between control wild-type and REDD1 KO epidermal thickness was done by the unpaired two-tailed t-test.
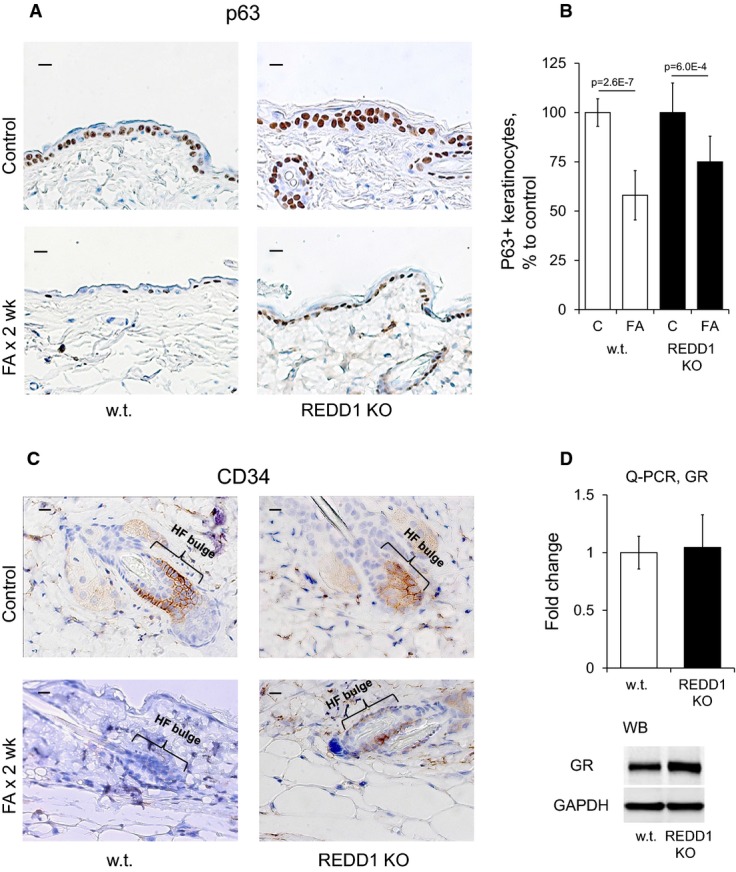
A–C Expression of p63 (A) and CD34 (C). Scale bars are 10 μm. Analysis of p63 staining (B). The number of p63+ basal keratinocytes/total number of basal keratinocytes is presented as % to the corresponding control epidermis.
D Similar GR expression in epidermis of wild-type and REDD1 KO mice determined by Q-PCR and Western blotting. Rpl27 and GAPDH used as a normalization controls, respectively.
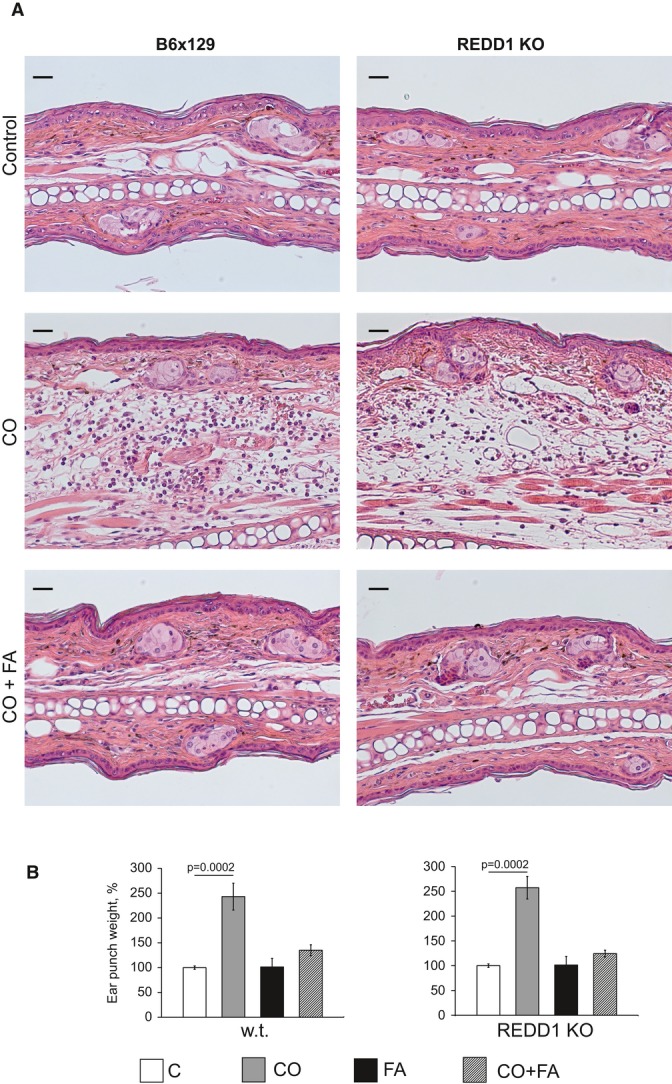
A H&E staining. Scale bars are 20 μm.
B Ear punch weight. Results are presented as % to corresponding (wild-type or REDD1 KO) control ear weight. The means ± SD were calculated for six individual ear punches/condition in one representative experiment (out of three experiments). Statistical analysis for differences between treatment and corresponding control was done by the unpaired two-tailed t-test.
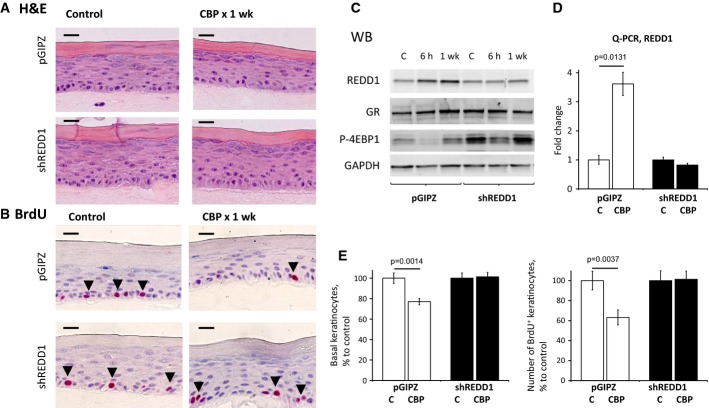
A, B H&E and BrdU staining of raft cultures (BrdU+ cells are indicated by arrowheads). Scale bars are 10 μm.
C Western blot analysis of REDD1, GR, and mTOR substrate 4E-BP1 phosphorylation. GAPDH was used as a loading control.
D Q-PCR analysis of REDD1 expression in rafts.
E Analysis of CBP effect on basal keratinocyte number (left) and keratinocyte proliferation (number of BrdU+ basal keratinocytes/total number of basal keratinocytes, right) is presented as % to corresponding control rafts.
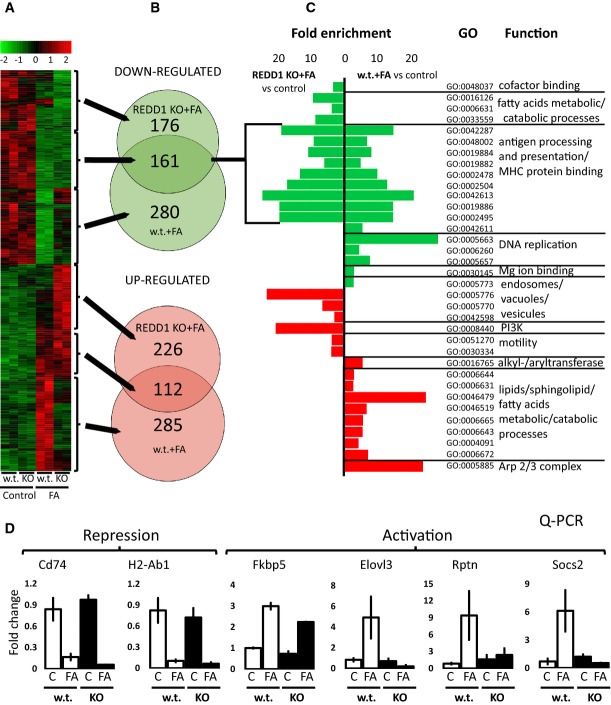
A A heatmap of gene expression as analyzed by the Mouse Whole-Genome Gene Expression BeadChips (Illumina). Columns show normalized gene expression for individual animals (red: increased, green: decreased expression).
B Venn diagrams show overlap of differentially expressed genes between REDD1 KO and wild-type mice (adjusted P < 0.05). Arrows connect sections of the heatmap with corresponding Venn diagrams.
C Most enriched gene ontology (GO) categories for biological processes and molecular functions (fold-change enrichment ≥ 3, P < 0.01), associated with transrepression and transactivation of the glucocorticoid-responsive genes in REDD1 KO and wild-type mice.
D Array validation by Q-PCR for genes from the different GO categories. Note: lack of overlap in GO categories between KO and wild-type mice associated with up-regulated genes and significant overlap in the function of down-regulated genes.
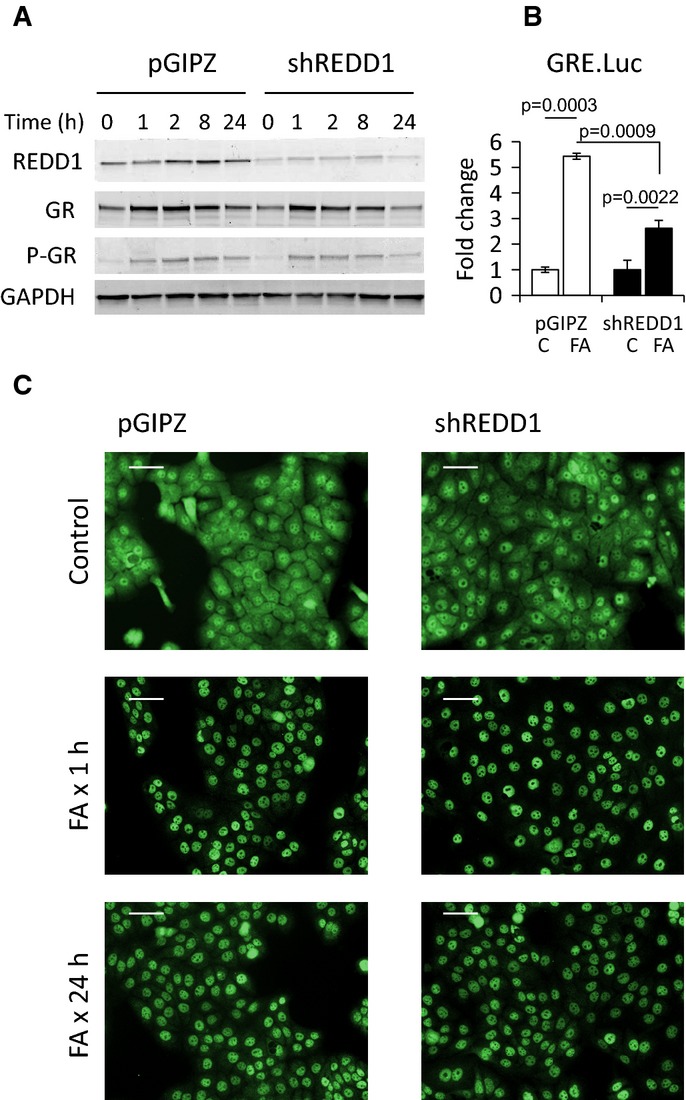
Western blot analysis of REDD1, GR, and phosphorylated GR-Ser211. GAPDH used as a loading control.
Reduced induction of Luciferase reporter in shREDD1-HaCaT cells. shREDD1- and pGIPZ-HaCaT cells were infected with GRE.Luc lentivirus and treated with FA (10−6 M) for 24 h. The Luciferase induction is presented as a fold change to corresponding vehicle-treated control. The means ± SD were calculated for three individual wells/group in one representative experiment (out of three experiments). Statistical analysis for differences between groups was done by ANOVA.
Immunofluorescence analysis of GR nuclear translocation and retention in shREDD1- and pGIPZ-HaCaT cells treated with FA (10−6 M). Scale bars are 10 μm.
Similar articles
-
PI3K inhibitors protect against glucocorticoid-induced skin atrophy.EBioMedicine. 2019 Mar;41:526-537. doi: 10.1016/j.ebiom.2019.01.055. Epub 2019 Feb 5. EBioMedicine. 2019. PMID: 30737086 Free PMC article.
-
Rapamycin Modulates Glucocorticoid Receptor Function, Blocks Atrophogene REDD1, and Protects Skin from Steroid Atrophy.J Invest Dermatol. 2018 Sep;138(9):1935-1944. doi: 10.1016/j.jid.2018.02.045. Epub 2018 Mar 27. J Invest Dermatol. 2018. PMID: 29596905 Free PMC article.
-
Important role of kallikrein 6 for the development of keratinocyte proliferative resistance to topical glucocorticoids.Oncotarget. 2016 Oct 25;7(43):69479-69488. doi: 10.18632/oncotarget.9926. Oncotarget. 2016. PMID: 27283773 Free PMC article.
-
Nutritional Sensor REDD1 in Cancer and Inflammation: Friend or Foe?Int J Mol Sci. 2022 Aug 26;23(17):9686. doi: 10.3390/ijms23179686. Int J Mol Sci. 2022. PMID: 36077083 Free PMC article. Review.
-
The mineralocorticoid receptor in skin disease.Br J Pharmacol. 2022 Jul;179(13):3178-3189. doi: 10.1111/bph.15736. Epub 2021 Dec 23. Br J Pharmacol. 2022. PMID: 34788475 Review.
Cited by
-
Differential Effect of Aldosterone or Mineralocorticoid Receptor Overexpression on Retinal Inflammation.Invest Ophthalmol Vis Sci. 2024 Oct 1;65(12):39. doi: 10.1167/iovs.65.12.39. Invest Ophthalmol Vis Sci. 2024. PMID: 39453673 Free PMC article.
-
Is REDD1 a Metabolic Éminence Grise?Trends Endocrinol Metab. 2016 Dec;27(12):868-880. doi: 10.1016/j.tem.2016.08.005. Epub 2016 Sep 6. Trends Endocrinol Metab. 2016. PMID: 27613400 Free PMC article. Review.
-
Ginsenoside Rg1 ameliorates stress-exacerbated Parkinson's disease in mice by eliminating RTP801 and α-synuclein autophagic degradation obstacle.Acta Pharmacol Sin. 2025 Feb;46(2):308-325. doi: 10.1038/s41401-024-01374-w. Epub 2024 Sep 3. Acta Pharmacol Sin. 2025. PMID: 39227736
-
The significance of CYP11A1 expression in skin physiology and pathology.Mol Cell Endocrinol. 2021 Jun 15;530:111238. doi: 10.1016/j.mce.2021.111238. Epub 2021 Mar 12. Mol Cell Endocrinol. 2021. PMID: 33716049 Free PMC article.
-
A Natural Compound Mixture Containing Arctigenin, Hederagenin, and Baicalein Alleviates Atopic Dermatitis in Mice by Regulating HPA Axis and Immune Activity.Evid Based Complement Alternat Med. 2020 Jun 29;2020:1970349. doi: 10.1155/2020/1970349. eCollection 2020. Evid Based Complement Alternat Med. 2020. PMID: 32714398 Free PMC article.
References
-
- Adcock IM. Glucocorticoid-regulated transcription factors. Pulm Pharmacol Ther. 2001;14:211–219. - PubMed
-
- Baida G, Bhalla P, Yuen K, Guo S, Lavker RM, Budunova I. mTOR inhibitor REDD1 protects CD34+ follicular epithelial stem cells and prevents development of steroid-induced cutaneous atrophy. J Invest Dermatol. 2013;133:S243–S246.
-
- Brafman A, Mett I, Shafir M, Gottlieb H, Damari G, Gozlan-Kelner S, Vishnevskia-Dai V, Skaliter R, Einat P, Faerman A, et al. Inhibition of oxygen-induced retinopathy in RTP801-deficient mice. Invest Ophthalmol Vis Sci. 2004;45:3796–3805. - PubMed
Publication types
MeSH terms
Substances
Grants and funding
LinkOut - more resources
Full Text Sources
Other Literature Sources
Medical
Molecular Biology Databases
Research Materials
Miscellaneous
