. 2014 Dec 11;5(1):133-44.
doi: 10.1534/g3.114.015008.

High-resolution linkage map and chromosome-scale genome assembly for cassava (Manihot esculenta Crantz) from 10 populations

High-resolution linkage map and chromosome-scale genome assembly for cassava (Manihot esculenta Crantz) from 10 populations

International Cassava Genetic Map Consortium (ICGMC). G3 (Bethesda). .

Abstract

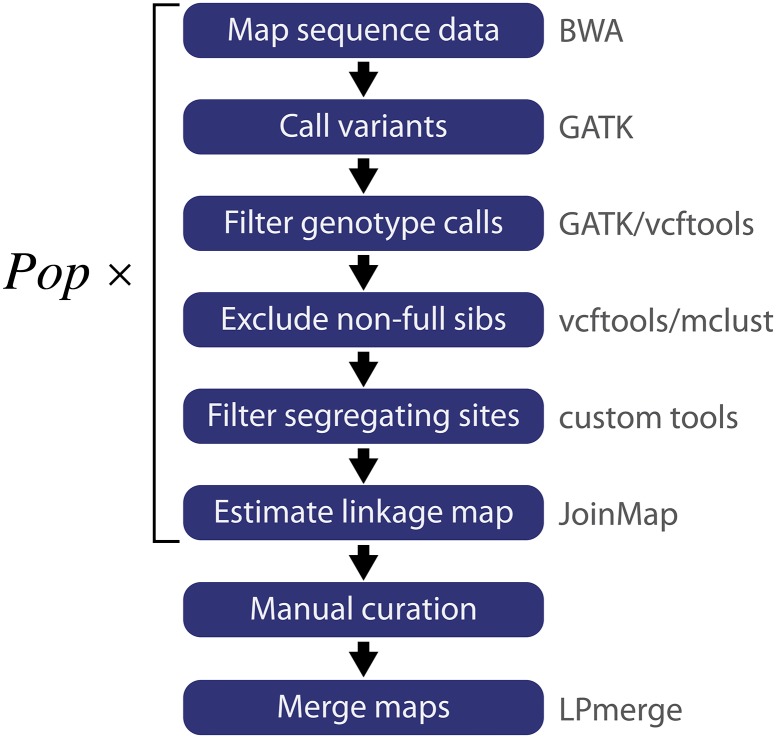
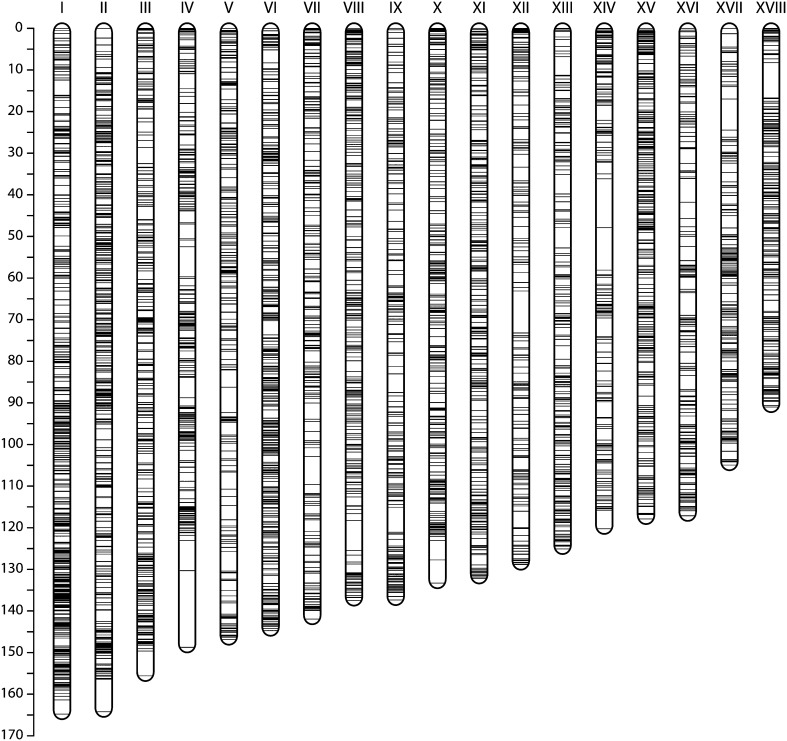
Cassava (Manihot esculenta Crantz) is a major staple crop in Africa, Asia, and South America, and its starchy roots provide nourishment for 800 million people worldwide. Although native to South America, cassava was brought to Africa 400-500 years ago and is now widely cultivated across sub-Saharan Africa, but it is subject to biotic and abiotic stresses. To assist in the rapid identification of markers for pathogen resistance and crop traits, and to accelerate breeding programs, we generated a framework map for M. esculenta Crantz from reduced representation sequencing [genotyping-by-sequencing (GBS)]. The composite 2412-cM map integrates 10 biparental maps (comprising 3480 meioses) and organizes 22,403 genetic markers on 18 chromosomes, in agreement with the observed karyotype. We used the map to anchor 71.9% of the draft genome assembly and 90.7% of the predicted protein-coding genes. The chromosome-anchored genome sequence will be useful for breeding improvement by assisting in the rapid identification of markers linked to important traits, and in providing a framework for genomic selection-enhanced breeding of this important crop.

Keywords: F1 cross; SNP; composite genetic map; genotyping-by-sequencing; pseudomolecules.


Figures

Figure 1
Figure 1
Data analysis pipeline used in this study. Using a combination of publicly available and custom tools (gray text), the pipeline starts with sequence data and generates a map for each population (Pop) through a series of analyses (white text on blue). Finally, the maps are merged using LPmerge to generate a single composite map (Endelman and Plomion 2014).
Figure 2
Figure 2
Analysis of parentage and sibling relationships. (A) The fraction of non-Mendelian genotypes detected in each individual in a population is plotted as a function of the minimum genotype quality (GQ) threshold. Off-types can be detected by a consistently high rate of Mendelian violation (black dotted lines), while, for legitimate progeny (solid gray), the non-Mendelian genotype rate is consistently lower than that of the putative parents (solid black lines). (B) A bivariate clustering analysis was performed on each population to verify parentage and full-sibling relationships. In this plot, we show the ARAL population as an example. Pairwise kinship coefficients phi are calculated between progeny and parents (Manichaikul et al. 2010). Each putative progeny is represented as a point in two-dimensional space colored by its cluster assignment: full-sib F1 progeny are in red and S1 progeny of AR40-6 (therefore unrelated to Albert) are in green; individuals consistent with being progeny from a full sib of Albert crossed to AR40-6 are in purple; individuals consistent with being the progeny from an S1 of AR40-6 being crossed to Albert are in blue.
Figure 3
Figure 3
Pairwise comparison of single population maps. (A) An example of a pairwise comparison between maps. Every marker is plotted at a position corresponding to its genetic distance in each map (for shared markers) or along the axis (for markers unique to one map). Shared markers reveal the correspondences and relative orientations between LGs produced by JoinMap (arbitrarily numbered). Runs of shared markers appearing as approximately straight, continuous lines demonstrate marker orders consistent between the two maps; a positive or negative gradient indicates identical or opposite orientation, respectively, in the two maps. In addition, LGs to be joined or split are revealed, respectively, as multiple unusually small LGs in one map corresponding to a single LG in another map (NCAR LG 3, and KAR LGs 13 and 14) and as a single unusually large LG in one map corresponding to multiple LGs in the other (NCAR LGs 7 and 9, and KAR LG 1). (B) An example of a “V”-shaped dot plot pattern, typically observed in LGs, that required (and could be corrected with) JoinMap parameters that increased the sensitivity (see Materials and Methods).
Figure 4
Figure 4
Marker distribution in the composite map. The scale on the left shows the map distance in cM. Our composite map consists of 18 LGs with a marker density of 1.95 nonredundant markers per cM. Previous maps did not recapitulate 18 LGs with a clear one-to-one mapping to our map, so we adopted a Roman numeral numbering system, ordered by decreasing genetic size.
Figure 5
Figure 5
Additional maps incorporate more markers, scaffolds, and anchored bases. These plots show the effects of adding maps to the framework map. Each additional map incorporates more genetically nonredundant markers (A) into the framework map, but the number of scaffolds incorporated is saturating (B) and the number of mapped bases (C) is reaching a plateau. This is because the scaffolds being added in later maps are getting smaller and smaller and, hence, adding ever fewer bases.

References

    1. Altshuler D., Pollara V. J., Cowles C. R., Van Etten W. J., Baldwin J., et al. , 2000. An SNP map of the human genome generated by reduced representation shotgun sequencing. Nature 407: 513–516. - PubMed
    1. Aronesty, E., 2011 Command-line tools for processing biological sequencing data. http://code.google.com/p/ea-utils.
    1. Awoleye F., Duren M., Dolezel J., Novak F. J., 1994. Nuclear DNA content and in vitro induced somatic polyploidization cassava (Manihot esculenta Crantz) breeding. Euphytica 76: 195–202.
    1. Baird N. A., Etter P. D., Atwood T. S., Currey M. C., Shiver A. L., et al. , 2008. Rapid SNP discovery and genetic mapping using sequenced RAD markers. PLoS ONE 3: e3376. - PMC - PubMed
    1. Bohra A., Saxena R. K., Gnanesh B. N., Saxena K., Byregowda M., et al. , 2012. An intra-specific consensus genetic map of pigeonpea [Cajanus cajan (L.) Millspaugh] derived from six mapping populations. Theor. Appl. Genet. 125: 1325–1338. - PMC - PubMed

Publication types

LinkOut - more resources