. 2015 Apr;67(4):1062-73.
doi: 10.1002/art.38990.

Myofibroblasts in murine cutaneous fibrosis originate from adiponectin-positive intradermal progenitors

Affiliations

Myofibroblasts in murine cutaneous fibrosis originate from adiponectin-positive intradermal progenitors

Roberta Goncalves Marangoni et al. Arthritis Rheumatol. 2015 Apr.

Abstract

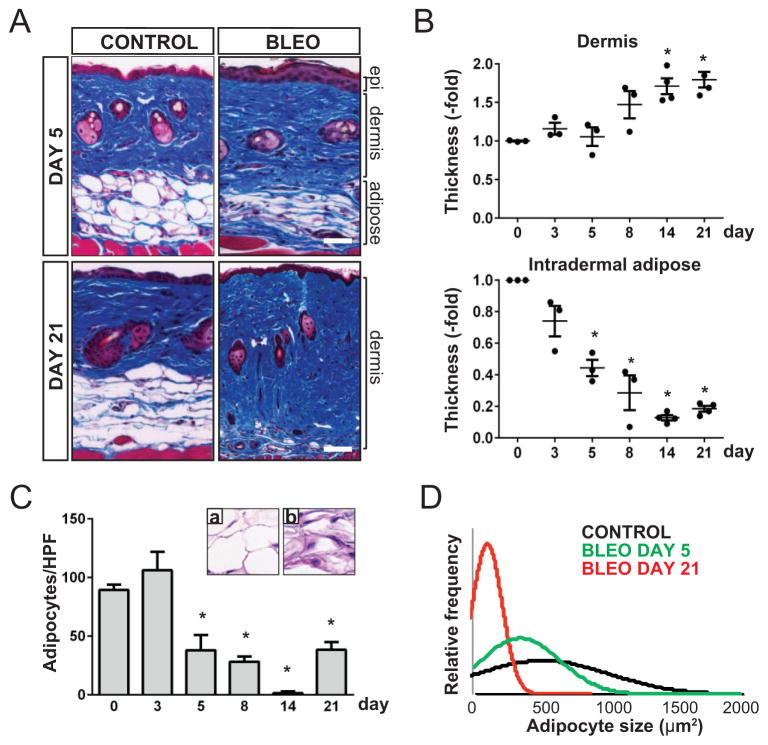
Objective: Accumulation of myofibroblasts in fibrotic skin is a hallmark of systemic sclerosis (SSc; scleroderma), but the origins of these cells remain unknown. Because loss of intradermal adipose tissue is a consistent feature of cutaneous fibrosis, we sought to examine the hypothesis that myofibroblasts populating fibrotic dermis derive from adipocytic progenitors.

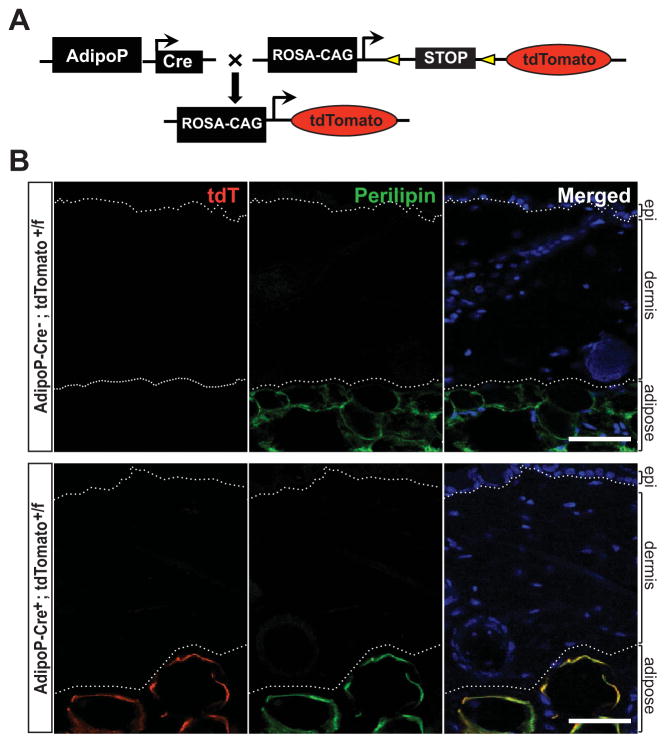
Methods: We performed genetic fate mapping studies to investigate the loss of intradermal adipose tissue and its potential role in fibrosis in mice with bleomycin-induced scleroderma. Modulation of adipocytic phenotypes ex vivo was investigated in adipose tissue-derived cells in culture.

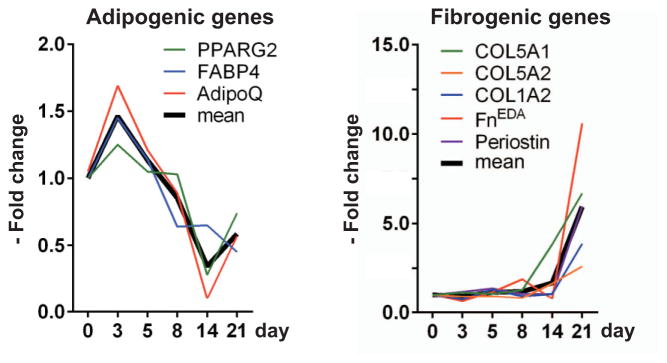
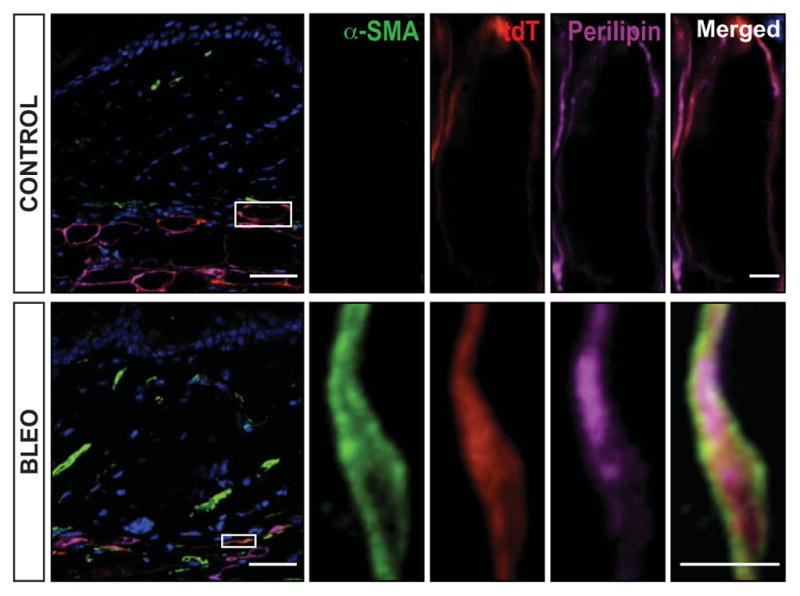
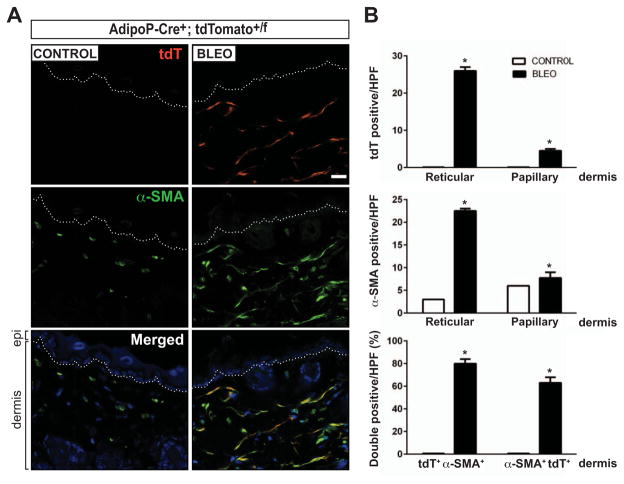
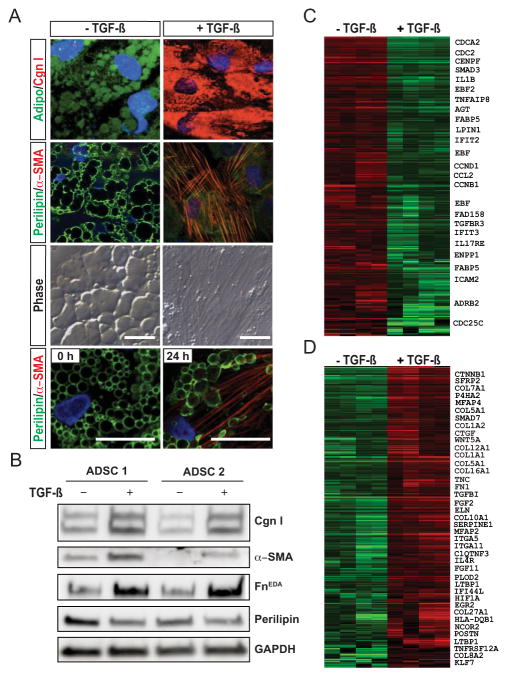
Results: A striking loss of intradermal adipose tissue and its replacement with fibrous tissue were consistently observed in mice with bleomycin-induced fibrosis. Loss of adipose tissue and a decline in the expression of canonical adipogenic markers in lesional skin preceded the onset of dermal fibrosis and expression of fibrogenic markers. Ex vivo, subcutaneous adipocytes were driven by transforming growth factor β to preferentially undergo fibrogenic differentiation. Cell fate mapping studies in mice with the adiponectin promoter-driven Cre recombinase transgenic construct indicated that adiponectin-positive progenitors that are normally confined to the intradermal adipose tissue compartment were distributed throughout the lesional dermis over time, lost their adipocytic markers, and expressed myofibroblast markers in bleomycin-treated mice.

Conclusion: These observations establish a novel link between intradermal adipose tissue loss and dermal fibrosis and demonstrate that adiponectin-positive intradermal progenitors give rise to dermal myofibroblasts. Adipose tissue loss and adipocyte-myofibroblast transition might be primary events in the pathogenesis of cutaneous fibrosis that represent novel potential targets for therapeutic intervention.


Figures

Figure 1
Figure 1
Loss of intradermal fat precedes dermal fibrosis in bleomycin-treated mice. C57BL/6J mice were given daily subcutaneous injections of bleomycin (bleo) or phosphate buffered saline (control) for up to 14 days. Skin specimens were obtained at the indicated time points. A, Masson’s trichrome–stained sections showing decreased intradermal adipose tissue on day 5 and increased collagen deposition on day 21 in bleomycin-treated mice. Bars = 100 μm. B, Changes in thickness of the dermis and intradermal adipose tissue over time in bleomycin-treated mice, as determined in 5 high-power fields (hpf)/mouse, showing that decreased intradermal adipose tissue thickness occurs prior to dermal thickening. Values are the fold change relative to control mice (n = 3–4 mice). Symbols represent individual mice; bars show the mean ± SEM. * = P ≤ 0.001 versus day 0. C, Numbers of intradermal adipocytes in the skin of bleomycin-treated mice, as counted in 2–3 hpf per tissue section. Values are the mean ± SEM (n = 2–3 mice/group). * = P ≤ 0.05 versus day 0. a and b, Representative hematoxylin and eosin–stained intradermal adipose tissue sections from control and bleomycin-treated mice, respectively, on day 5. Original magnification × 63. D, Changes in the size of adipocytes over time in control and bleomycin-treated mice, as determined in >200 adipocytes from 3–4 mice in each group. Epi = epidermis.
Figure 2
Figure 2
Gene expression changes during cutaneous fibrogenesis. C57BL/6J mice were given daily subcutaneous injections of bleomycin or phosphate buffered saline for up to 14 days. Skin tissue samples isolated from the areas of injection were harvested at the indicated time points, and mRNA levels were determined. Results were normalized to GAPDH and are representative of triplicate determinations (n = 3–4 mice/group). * = P ≤ 0.001 versus day 0. FnEDA = cellular fibronectin.
Figure 3
Figure 3
Selective expression of adiponectin-Cre in adipocytes. A, Adiponectin-Cre–transgenic (AdipoP-Cre) mice were crossed with Ai14 (tandem dimer Tomato [tdTomato; tdT]) reporter mice to generate progeny expressing tdTomato fluorescent protein restricted to adipocytes. B, Skin harvested from the interscapular region of 6-week-old female AdipoP-Cre−;tdTomato+/f and AdipoP-Cre+;tdTomato+/f mice was immunostained with antibodies to perilipin (green). No tdTomato expression from the unrecombined Ai14 allele was observed in mice lacking Cre-recombinase (AdipoP-Cre−). In AdipoP-Cre+;tdTomato+/f mice, 100% colocalization of the tdTomato reporter with perilipin-labeled adipocytes was observed. Hoechst 33342 (blue) counterstained; bars = 50 μm. Dotted lines outline the dermis.
Figure 4
Figure 4
Triple-positive transitional cells are present in intradermal fat in early fibrogenesis. AdipoP-Cre+;tdTomato+/f mice were given daily subcutaneous injections of bleomycin (bleo) or phosphate buffered saline (control). Lesional skin harvested on day 8 was immunostained with antibodies to α-smooth muscle actin (α-SMA) (green) and perilipin (purple) and examined by confocal microscopy. Endogenous tdTomato label (red) was restricted to the intradermal fat layer. Numerous lineage-labeled adipocytes (red + purple) also expressed α-SMA. Hoechst 33342 (blue) counterstained; bars = 50 μm (inset = 5 μm). Boxed areas show higher-magnification views. Images are representative of 3 mice/group. See Figure 3 for other definitions.
Figure 5
Figure 5
Myofibroblasts populating the fibrotic dermis are derived from adipocytes. AdipoP-Cre+;tdTomato+/f mice were given daily subcutaneous injections of bleomycin (bleo) or phosphate buffered saline (control) for 14 days. Skin tissue isolated from the areas of injection was harvested on day 21 and immunostained with antibodies to α-smooth muscle actin (α-SMA). A, Representative split image photomicrographs showing immunolabeling for endogenous tdTomato (red) and α-SMA (green). Hoechst 33342 (blue) counterstained; bar = 20 μm. Dotted lines represent the border between the epidermis (epi) and dermis (bottom). B, Quantification of tdTomato-positive cells (top), α-SMA–positive cells (middle), and the production of double-positive cells in the dermis. Values are the mean ± SEM (n = 3–5 mice/treatment group) and are representative of 3 independent experiments. * = P < 0.01 versus control. hpf = high-power field (see Figure 3 for other definitions).
Figure 6
Figure 6
Transforming growth factor β (TGFβ) induces myofibroblast differentiation from adipocytes. Human subcutaneous adipose tissue–derived progenitor cells (ADSCs) were incubated in differentiation media for 10 days, followed by incubation with TGFβ (5 ng/ml) for up to 72 hours. A, Immunofluorescence analysis using antibodies to adiponectin (green) and type I collagen (Cng I; red) (top row) or perilipin (green) and α-smooth muscle actin (α-SMA) (red) (second row from top and bottom row). The 3 top rows show results at 72 hours, and the bottom row shows results at 0 and 24 hours. DAPI was used for nuclear staining (blue). Bars = 50 μm. B, Representative Western blots of whole cell lysates. ADSC 1 = donor 1; FnEDA = cellular fibronectin. C and D, Heatmaps showing the expression of adipogenic genes (C) and fibrogenic genes (D), organized by hierarchical clustering. Total RNA was hybridized to Agilent microarrays. Genes with expression levels above the mean are shown in red, and those with expression levels below the mean are shown in green. The first pair of columns (from left) show the mRNA profile of a sample and its technical replicate, and the second pair of columns show the profiles of a biologic replicate sample and its technical replicate.

Comment in

References

    1. Gabrielli A, Avvedimento EV, Krieg T. Scleroderma. N Engl J Med. 2009;360:1989–2003. - PubMed
    1. Jimenez SA, Derk CT. Following the molecular pathways toward an understanding of the pathogenesis of systemic sclerosis. Ann Intern Med. 2004;140:37–50. - PubMed
    1. Hinz B, Phan SH, Thannickal VJ, Prunotto M, Desmouliere A, Varga J, et al. Recent developments in myofibroblast biology: paradigms for connective tissue remodeling. Am J Pathol. 2012;180:1340–55. - PMC - PubMed
    1. Driskell RR, Lichtenberger BM, Hoste E, Kretzschmar K, Simons BD, Charalambous M, et al. Distinct fibroblast lineages determine dermal architecture in skin development and repair. Nature. 2013;504:277–81. - PMC - PubMed
    1. Piera-Velazquez S, Li Z, Jimenez SA. Role of endothelial-mesenchymal transition (EndoMT) in the pathogenesis of fibrotic disorders. Am J Pathol. 2011;179:1074–80. - PMC - PubMed

Publication types