

doi: 10.1128/JVI.02590-14.
Epub 2014 Dec 10.
Adaptation of pandemic H2N2 influenza A viruses in humans
Affiliations
- PMID: 25505070
- PMCID: PMC4338906
- DOI: 10.1128/JVI.02590-14
Item in Clipboard
Adaptation of pandemic H2N2 influenza A viruses in humans
J Virol.
2015 Feb.
Erratum in
-
Correction for Joseph et al., Adaptation of pandemic H2N2 influenza A viruses in humans.J Virol. 2015 Apr;89(8):4706. doi: 10.1128/JVI.00259-15. J Virol. 2015. PMID: 25792756 Free PMC article. No abstract available.
Abstract
The 1957 A/H2N2 influenza virus caused an estimated 2 million fatalities during the pandemic. Since viruses of the H2 subtype continue to infect avian species and pigs, the threat of reintroduction into humans remains. To determine factors involved in the zoonotic origin of the 1957 pandemic, we performed analyses on genetic sequences of 175 newly sequenced human and avian H2N2 virus isolates and all publicly available influenza virus genomes.
Copyright © 2015, American Society for Microbiology. All Rights Reserved.
Figures
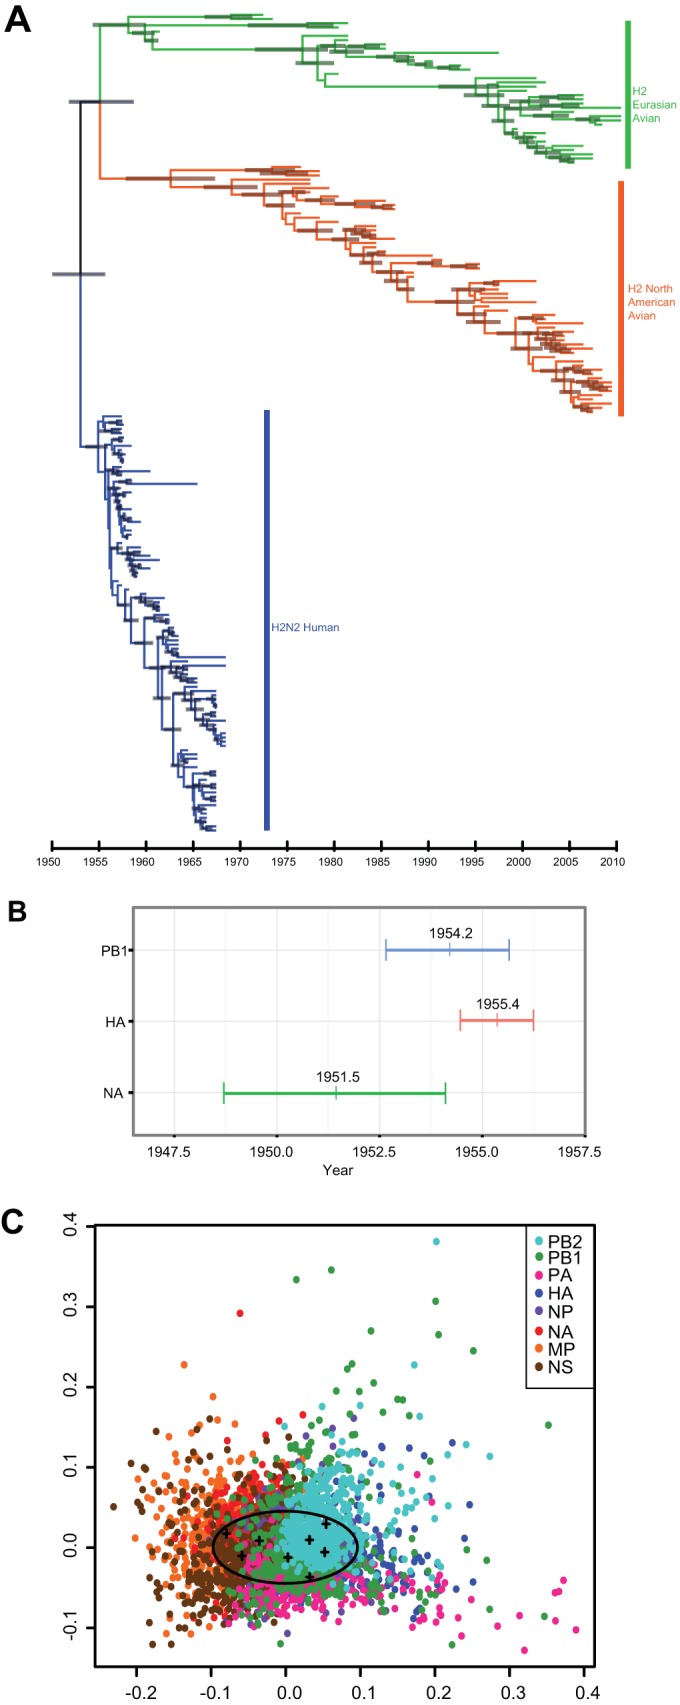
Evolution and reassortment of H2 viruses. Maximum-clade credibility temporal tree of H2N2 influenza A virus segment. (A) HA of Eurasian avian (green), North American avian (orange), and human (blue) virus isolates (n = 194). Gray bars represent the 95% highest posterior density (HPD) of age for each node. (B) Ninety-five percent HPDs of times to most recent common ancestor (TMRCAs) for avian-derived H2N2 human segments PB1 (blue), HA (red), and NA (green). Mean TMRCA values are indicated at the center of each bar. (C) Multidimensional scaling (MDS) plot of uncertainty of TMRCAs between samples of 500 trees for each segment of pandemic H2N2 viruses (n = 49) sampled between 1957 and 1968. In this analysis, the tree-to-tree variation in posterior distribution of 500 trees for each segment is plotted as a cloud of points where the mean is represented by the centroid of the cloud (crosses), while the spread of points indicates the degree of statistical uncertainty in the phylogenetic history of each gene segment. The space occupied by human H3N2 viruses is indicated by the oval (15).
Uracil content patterns. Uracil content in H2N2 human (solid triangles) gene segments in comparison to the respective H2 avian (asterisks) or H1 mammalian (open circles) isolates from which each segment is derived, depicted per year. Best-fit regression lines are shown with the 95% confidence interval shaded gray.
References
-
- Zhou B, Donnelly ME, Scholes DT, St. George K, Hatta M, Kawaoka Y, Wentworth DE. 2009. Single-reaction genomic amplification accelerates sequencing and vaccine production for classical and swine origin human influenza A viruses. J Virol 83:10309–10313. doi: 10.1128/JVI.01109-09. - DOI - PMC - PubMed
Publication types
MeSH terms
Substances
Grants and funding
LinkOut - more resources
Full Text Sources
Other Literature Sources
Medical
