. 2015 Mar 1;113(5):1598-615.
doi: 10.1152/jn.00566.2014. Epub 2014 Dec 10.

Dendritic spine dysgenesis contributes to hyperreflexia after spinal cord injury

Affiliations

Dendritic spine dysgenesis contributes to hyperreflexia after spinal cord injury

Samira P Bandaru et al. J Neurophysiol. .

Abstract

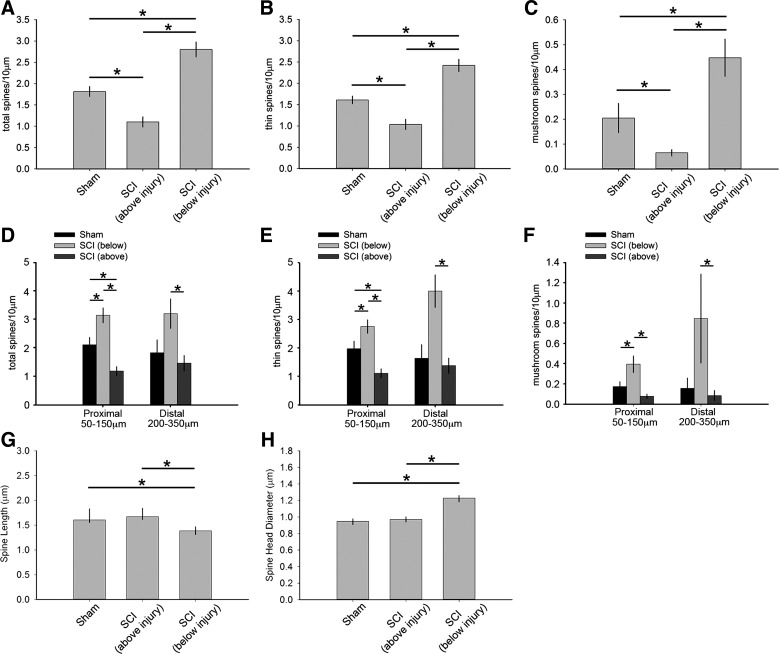
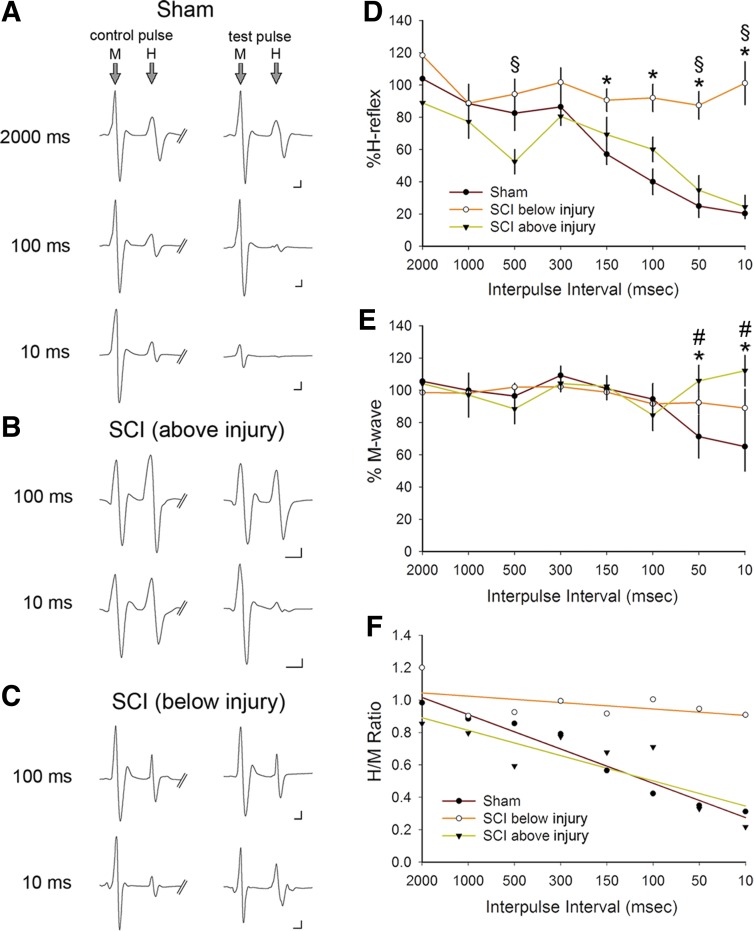
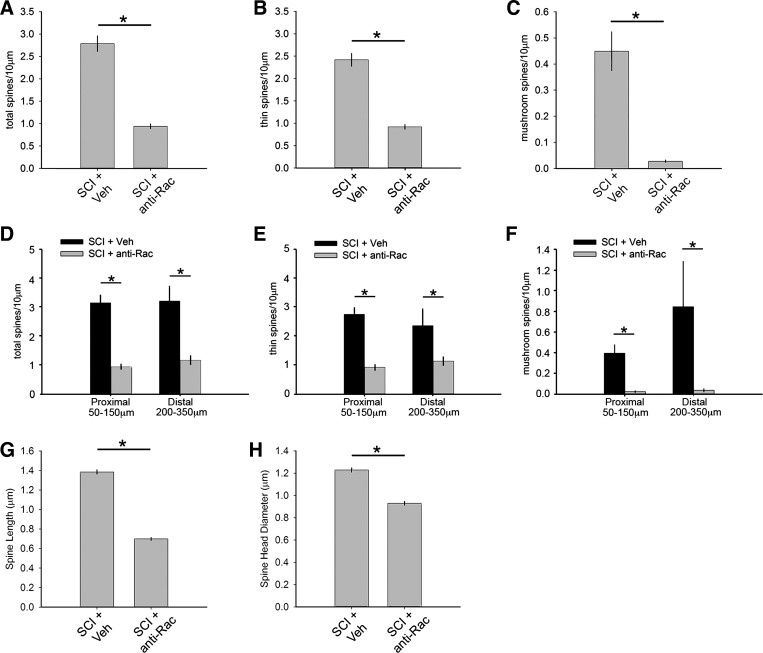
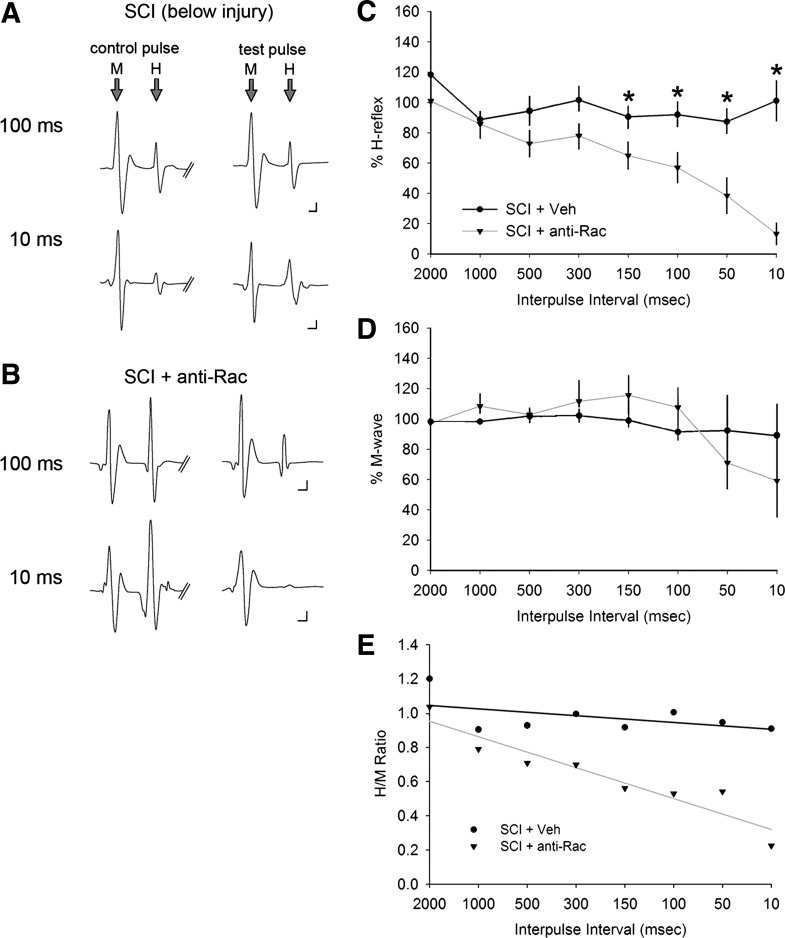
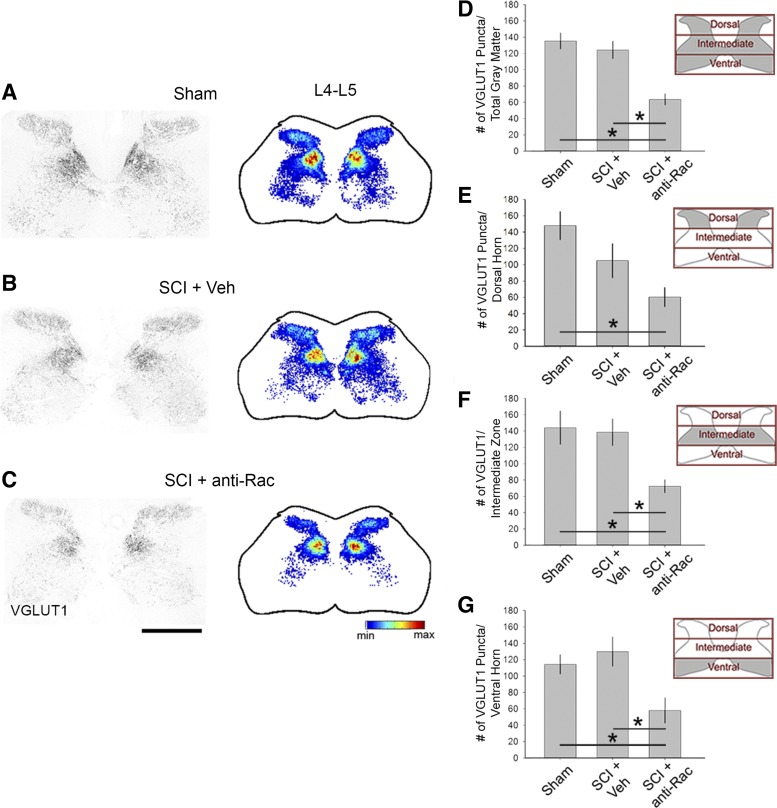
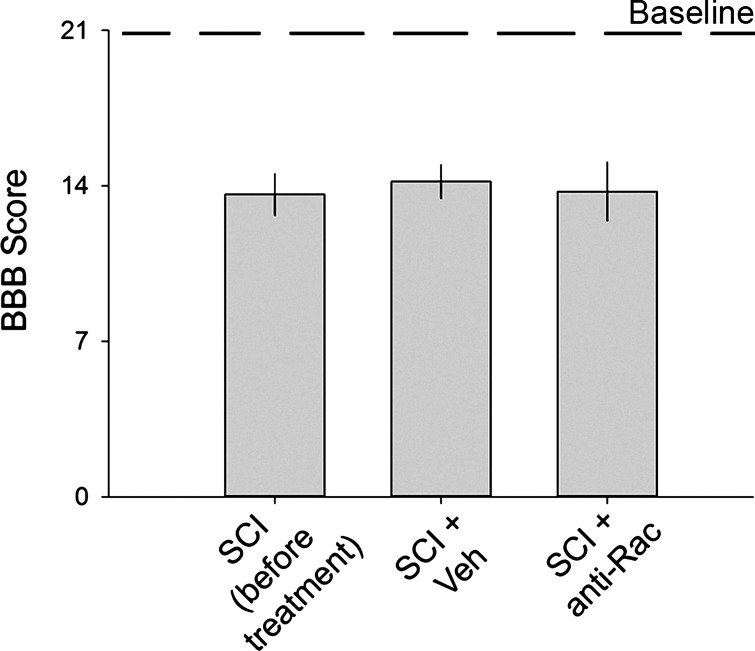
Hyperreflexia and spasticity are chronic complications in spinal cord injury (SCI), with limited options for safe and effective treatment. A central mechanism in spasticity is hyperexcitability of the spinal stretch reflex, which presents symptomatically as a velocity-dependent increase in tonic stretch reflexes and exaggerated tendon jerks. In this study we tested the hypothesis that dendritic spine remodeling within motor reflex pathways in the spinal cord contributes to H-reflex dysfunction indicative of spasticity after contusion SCI. Six weeks after SCI in adult Sprague-Dawley rats, we observed changes in dendritic spine morphology on α-motor neurons below the level of injury, including increased density, altered spine shape, and redistribution along dendritic branches. These abnormal spine morphologies accompanied the loss of H-reflex rate-dependent depression (RDD) and increased ratio of H-reflex to M-wave responses (H/M ratio). Above the level of injury, spine density decreased compared with below-injury spine profiles and spine distributions were similar to those for uninjured controls. As expected, there was no H-reflex hyperexcitability above the level of injury in forelimb H-reflex testing. Treatment with NSC23766, a Rac1-specific inhibitor, decreased the presence of abnormal dendritic spine profiles below the level of injury, restored RDD of the H-reflex, and decreased H/M ratios in SCI animals. These findings provide evidence for a novel mechanistic relationship between abnormal dendritic spine remodeling in the spinal cord motor system and reflex dysfunction in SCI.

Keywords: H-reflex; Rac1; hyperreflexia; spasticity; spinal cord injury.


Figures

Fig. 1.
Fig. 1.
Study design. All weight-matched animals underwent Basso, Beattie, and Bresnahan (BBB) locomotor testing to obtain baseline behavioral data. The number of animals (n values) in each group are shown. In week 1, animals were randomly assigned to receive sham or spinal cord injury (SCI) surgical procedures. In week 5, animals received intrathecal catheter implants. After 2–3 days of recovery, we performed pretreatment BBB testing and immediately administered intrathecal infusions of control vehicle or NSC23766 (twice a day for 3 days). At experimental endpoint at week 6, these treatments produced 4 comparator groups (gray-shaded boxes). Note that within SCI animals treated with vehicle (SCI + Veh), we assessed and compared data outcomes from above or below the injury site (i.e., forelimb and hindlimb, respectively). At endpoint, we also performed posttreatment BBB testing, H-reflex assessment, and histological analysis.
Fig. 2.
Fig. 2.
Spinal cord injury. A: contusion injury at L2 resulted in severe damage of the dorsal columns and gray matter, as shown by glial fibrillary acidic protein (GFAP) staining in coronal spinal cord tissue sections. Asterisk denotes lesion epicenter. B: intact spinal cord tissue from sham animal. C and D: biomechanical data provided by the Infinite Horizon (IH) impactor demonstrated no difference between vehicle (SCI + Veh)- and Rac1 inhibitor NSC23766-treated (SCI + anti-Rac) SCI groups. E: 6 wk after SCI (above injury), PKC-γ staining produced bilateral labeling of the dorsal corticospinal tract (dCST) and lamina I/II. F: at the lumbar level L5 (below injury), the absence of PKC-γ immunoreactivity in the dorsal column white matter tracts demonstrates significant disruption of the dCST. SCI did not affect PKC-γ staining in superficial laminae. Scale bars, 500 μm.
Fig. 3.
Fig. 3.
Golgi staining of spinal cord tissue reveals dendritic spines on motor neurons in the ventral gray matter. A: image of ventral gray matter with an identified α-motor neuron located in Rexed lamina IX (arrow and white box). B: high-power field of motor neuron shown in inset in A. Six weeks after sham and SCI procedures, representative images of dendritic branches show apparent differences in dendritic spine profiles from sham (C), SCI + Veh above the injury (D), SCI + Veh below the injury (E), and SCI + anti-Rac (F) treatment groups. C′–F′: high magnification of selected dendrite regions from C–F (red boxes). Scale bars: A, 500 μm; B, 100 μm; C–F, 10 μm; C′–F′, 2 μm.
Fig. 4.
Fig. 4.
Digital reconstructions of spinal cord motor neurons. To obtain an accurate profile of dendritic spines in motor neurons, we digitally reconstructed the entire branch structure of sampled neurons. A–D: contour traces from each group as indicated show the locations of all sampled motor neurons (red dots) within the gray matter (representative black trace). Density and distribution were measured from 3-dimensional neuron reconstructions from sham (A′), SCI + Veh above the injury (B′), SCI + Veh below the injury (C′), and SCI + anti-Rac (D′) treatment groups. A″–D″: ∼50-μm lengths of dendrites from neurons shown in A′–D′ (gray-shaded regions) show thin-shaped (blue dots) and mushroom-shaped spines (red dots). Scale bars: A–D, 500 μm; A′–D′, 50 μm; A″–D″, 10 μm.
Fig. 5.
Fig. 5.
Quantitative analysis of dendritic spine profiles between sham and SCI animals above or below the injury. Analysis of dendritic spine profiles reveals differences in dendritic spine density (A–C), distribution (D–F), and shape (G and H). Total dendritic spine density (A), which includes all spine shapes, thin spine density (B) and mushroom spine density (C) decreased on motor neurons located above the injury after SCI compared with neurons from sham (*P < 0.05). In contrast, total spine density increased on motor neurons located below the injury compared with neurons from either sham or above the injury after SCI (*P < 0.05). Dendritic spine distribution for total (D), thin (E), and mushroom spines (F) differed across the comparator groups. At proximal regions in SCI animals, all spine densities increased below the injury compared with neurons from sham and above the injury (*P < 0.05). In contrast, neurons above the injury had lower total and thin spine density at proximal regions compared with neurons from sham and below the injury (*P < 0.05). Although mushroom spine density on motor neurons above the injury did not differ from that on neurons from sham at proximal regions (F), these neurons had significantly lower mushroom spine density than below the injury. At distal regions, motor neurons below the injury had greater spine density in all categories compared with motor neurons above the injury (*P < 0.05). There was no difference in any spine densities at distal regions on neurons from sham and above the injury in SCI animals. Dendritic spine shape analysis revealed no change in spine length (G) or spine head diameter (H) on motor neurons located above the injury in SCI animals compared with neurons from sham (*P < 0.05). Below the injury, these measurements demonstrated a decrease in spine length and an increase in spine head diameter compared with neurons from sham and above the injury (*P < 0.05).
Fig. 6.
Fig. 6.
Rate-dependent depression (RDD) of the H-reflex and M-wave responses above and below SCI. As a physiological assessment of the monosynaptic H-reflex, we performed a paired-pulse stimulation protocol. Representative traces (averaged 10–20 traces) of the M and H responses to control (first) and test (second) pulse in sham (A), SCI above the injury (B), and SCI below the injury (C). The control and test pulses were separated with a range of interpulse latencies between 2,000 and 10 ms. Note that in sham animals, as the interpulse intervals decreased (e.g., increasing the rate of activity) between the test and control pulse, the amplitude of the M and H responses decreased. As shown in C, in SCI below the injury, RDD in amplitude of either the M or H response failed to appear. D and E: %H-reflex and %M-wave amplitudes are normalized values of the evoked stimulus response of the test and control pulse. D: after SCI, there was no significant difference in %H-reflex in SCI above the injury compared with sham at any interpulse interval. In contrast, in SCI animals below the injury, the %H-reflex significantly increased compared with sham at the shortest interpulse intervals between 100 and 10 ms (*P < 0.05), demonstrating a loss of RDD and increased excitability of the H-reflex. Similarly, %H-reflex below the injury was significantly greater than above the injury in SCI animals at 500-, 50-, and 10-ms interpulse intervals (§P < 0.05). E: % M-wave demonstrated a significantly increased response below the injury compared with the response in sham animals (*P < 0.05) and above the injury in SCI animals (#P < 0.05). F: the H/M ratio was calculated from M-wave and H-wave responses.
Fig. 7.
Fig. 7.
Rac1 inhibitory treatment disrupts dendritic spine morphology on motor neurons in the ventral horn after SCI. Treatment with NSC23766 in SCI animals (SCI + anti-Rac) resulted in a significant decrease in total (A), thin (B), and mushroom spine density (C) compared with SCI + Veh (*P < 0.05). D–F: assessment of dendritic spine distribution on motor neurons showed that NSC23766 treatment in SCI animals resulted in decreased spine density for all spine categories at both proximal and distal branch regions (*P < 0.05). NSC23766 treatment decreased SCI-induced spine length (G) and spine head diameter (H) compared with SCI + Veh (*P < 0.05).
Fig. 8.
Fig. 8.
Disruption of Rac1-regulated dendritic spines reduces SCI-induced H-reflex hyperexcitability. Representative traces show the M and H responses from paired-pulse testing in SCI + Veh below the injury (A) and SCI + anti-Rac (B) treatment groups. C: quantification of the %H-reflex response demonstrates that the H-reflex response in SCI + Veh animals exhibited reduced RDD (also see Fig. 6). Rac1 inhibitor treatment in SCI animals reduced the %H-reflex at 100, 50, and 10 ms compared with SCI + Veh (*P < 0.05). D: there was no significant difference in the %M-wave between SCI + Veh and SCI + anti-Rac. E: treatment with Rac1 inhibitor in SCI animals decreased the H/M ratio compared with SCI + Veh, as demonstrated by a steeper downward trend line.
Fig. 9.
Fig. 9.
Excitatory terminals in the spinal cord gray matter. Vesicular glutamate transporter 1 (VGluT1)-immunopositive puncta appeared throughout all laminae of the spinal cord gray matter in the lumbar enlargement L4–L5 (A–C, left). Spatial heat maps (A–C, right; red = highest density, blue = lowest density) shows the overall areal density of VGluT1 expression in sham (A), SCI + Veh (B), and SCI + anti-Rac (C) treatment groups. Quantification of the VGluT1 puncta within the total gray matter region (D), dorsal horn (E), intermediate zone (F), and ventral horn (G) as represented in insets as gray shading demonstrates no significant change in SCI + Veh compared with sham. Treatment with the Rac1 inhibitor in SCI animals decreased VGluT1 areal density compared with SCI + Veh in the total gray matter, intermediate zone, and ventral horn only (*P < 0.05) with no significant change in the dorsal horn (P > 0.05). The areal density of VGluT1 decreased in SCI + anti-Rac1 compared with sham in the dorsal horn (*P < 0.05). Scale bar for A–C, 500 μm.
Fig. 10.
Fig. 10.
Locomotor testing. Blinded observers performed BBB testing on SCI animals at 3 time points: before any procedure (baseline), before treatment, and after treatment (SCI + Veh and SCI + anti-Rac). All naive animals exhibited a baseline locomotor score of 21. There were no significant differences in BBB scores across groups (P > 0.05).

Similar articles

Cited by

References

    1. Alvarez FJ, Titus-Mitchell HE, Bullinger KL, Kraszpulski M, Nardelli P, Cope TC. Permanent central synaptic disconnection of proprioceptors after nerve injury and regeneration. I. Loss of VGLUT1/IA synapses on motoneurons. J Neurophysiol 106: 2450–2470, 2011. - PMC - PubMed
    1. Alvarez FJ, Villalba RM, Zerda R, Schneider SP. Vesicular glutamate transporters in the spinal cord, with special reference to sensory primary afferent synapses. J Comp Neurol 472: 257–280, 2004. - PubMed
    1. Anderson LC, von Bartheld CS, Byers MR. NGF depletion reduces ipsilateral and contralateral trigeminal satellite cell reactions after inferior alveolar nerve injury in adult rats. Exp Neurol 150: 312–320, 1998. - PubMed
    1. Arendt-Nielsen L, Graven-Nielsen T, Svensson P, Jensen TS. Temporal summation in muscles and referred pain areas: an experimental human study. Muscle Nerve 20: 1311–1313, 1997. - PubMed
    1. Arendt-Nielsen L, Sonnenborg FA, Andersen OK. Facilitation of the withdrawal reflex by repeated transcutaneous electrical stimulation: an experimental study on central integration in humans. Eur J Appl Physiol 81: 165–173, 2000. - PubMed

Publication types