Review
. 2015 Feb 6;12(103):20140882.
doi: 10.1098/rsif.2014.0882.

Collective sensing and collective responses in quorum-sensing bacteria

Affiliations
Review

Collective sensing and collective responses in quorum-sensing bacteria

R Popat et al. J R Soc Interface. .

Abstract

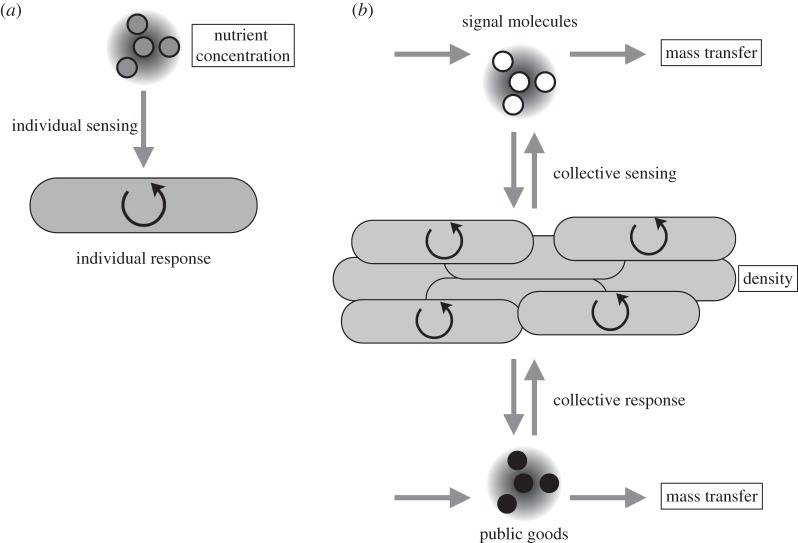
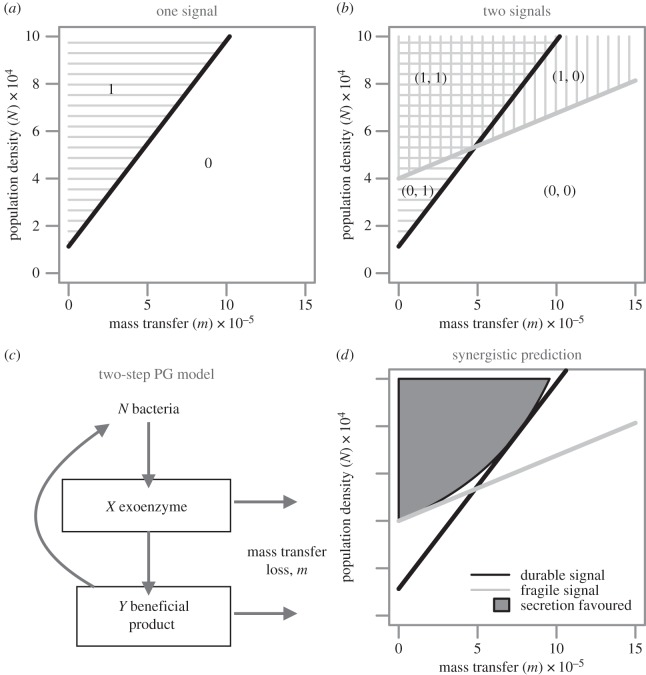
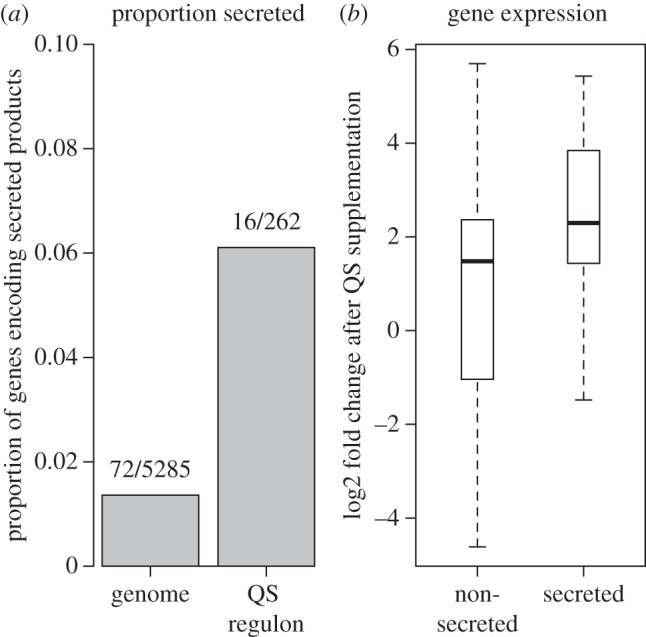
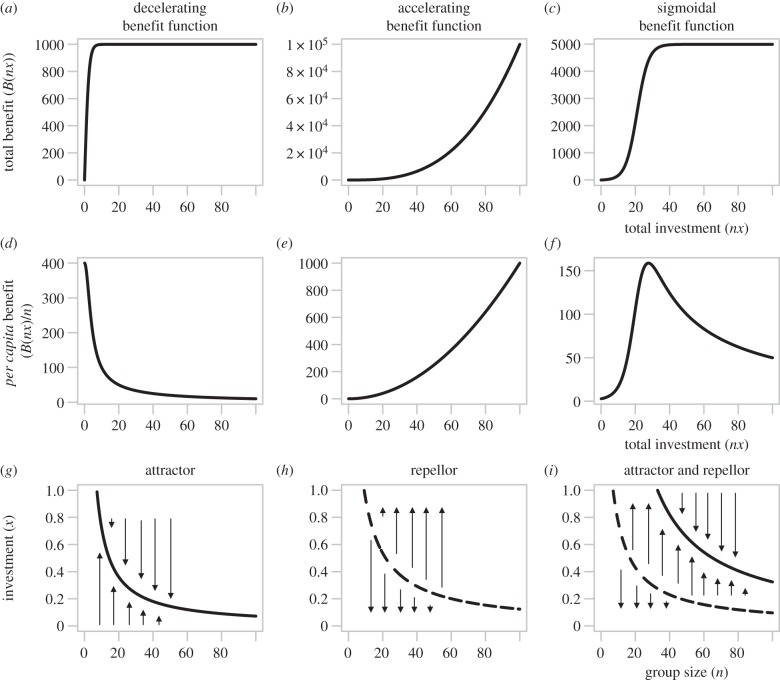
Bacteria often face fluctuating environments, and in response many species have evolved complex decision-making mechanisms to match their behaviour to the prevailing conditions. Some environmental cues provide direct and reliable information (such as nutrient concentrations) and can be responded to individually. Other environmental parameters are harder to infer and require a collective mechanism of sensing. In addition, some environmental challenges are best faced by a group of cells rather than an individual. In this review, we discuss how bacteria sense and overcome environmental challenges as a group using collective mechanisms of sensing, known as 'quorum sensing' (QS). QS is characterized by the release and detection of small molecules, potentially allowing individuals to infer environmental parameters such as density and mass transfer. While a great deal of the molecular mechanisms of QS have been described, there is still controversy over its functional role. We discuss what QS senses and how, what it controls and why, and how social dilemmas shape its evolution. Finally, there is a growing focus on the use of QS inhibitors as antibacterial chemotherapy. We discuss the claim that such a strategy could overcome the evolution of resistance. By linking existing theoretical approaches to data, we hope this review will spur greater collaboration between experimental and theoretical researchers.

Keywords: collective behaviour; quorum sensing; social evolution; systems biology.


Figures

Figure 1.
Figure 1.
Individual sensing versus collective sensing and responses. (a) An individually sensed environmental parameter such as lactose concentration is sensed by an individual cell and affects an individual response. The lac operon is upregulated, and lactose transport and metabolism is enhanced. Such a decision can be made by directly sensing the nutrient concentration and an effective response is not contingent upon the action of others. (b) By contrast, environmental parameters that cannot be directly sensed such as population density and mass transfer can affect the concentration of QS molecules. Multiple individuals contribute to a common pool of molecular environmental probes generating information at the group level, via a collective mechanism of sensing. The resulting change in behaviour involves both individual traits and group traits (in particular, secretions) that favourably modify the environment.
Figure 2.
Figure 2.
Signal ambiguity and multiple signals. (a) The ambiguity between population density and mass transfer is inherent when inferences are made on the concentration of only one QS molecule. (b) With two molecules that have differing rates of chemical decay, there are non-overlapping regions in their thresholds over population density and mass transfer allowing greater environmental resolution (see box 1), requiring combinatorial responses to the concentration of the two molecules. (c) A two-step public goods model where a beneficial secreted product liberates nutrients in the environment. Both the secreted product and the liberated nutrient can be lost via mass transfer (see box 2). (d) Secretions are more effective at high concentrations and therefore at high population density and low mass transfer. The benefit derived from secretions that liberate nutrients from the environment is affected by both the loss of the secretion and the liberated nutrient (see box 2). This double jeopardy contributes to an accelerating penalty on the benefit of secretion with increasing mass transfer which translates into the curved grey shaded region in panel c (the region favouring investments in secreted public goods). This region can be better approximated by two signals and an AND-gate response rule. The thick lines represent the threshold beyond which QS is ‘on’ (1) and below which QS is ‘off’ (0). The dark grey region in (c) represents the mass transport and population density regimes where secretions that liberate nutrients would be favoured. Parameters for the two signal molecules are: u1 = 1.3 × 10⁻⁵ s−1, a1 = 1.15 × 10⁻⁹ cell s−1, u2 = 1.45 × 10⁻⁴ s−1, a2 = 3.625 × 10⁻⁹ cell s−1. The parameters for the public good model in panel c are: P = 9.6 × 10⁻⁹ µg ml s−1, q = 10−1 s−1, e = 4 × 10⁻³ s−1, f = 1.2 × 10⁻³ s−1, c = 7 × 10⁻⁷ µl cell s−1. See box 1 for model details. Adapted from [25].
Figure 3.
Figure 3.
The control of secretions by QS in P. aeruginosa. We analysed data from a previous study where gene expression in a mutant in two AHL QS systems (PAO1 ΔlasI/rhlI) was measured with and without the supplementation of both 3-oxo-C12-HSL and C4-HSL [25]. (a) Genes encoding secretions are over-represented in the QS regulon (6.1%) compared to the genome as a whole (1.4%). (b) Genes that encode secretions are activated by QS to a higher degree than non-secretions when QS is activated by both signals.
Figure 4.
Figure 4.
Evolutionary dynamics of cooperative secretions depend critically on nonlinearities in benefit functions. Panels (ac) show the total group benefits of a public good for (a) diminishing, (b) accelerating and (c) sigmoidal returns on total group investment, with per capita benefits shown in (df) (adapted from [25]). Individual investment is set as x = 1 and n is the group size. We assume that the public good is rival (for discussion, see [57]) so that the per capita benefit is B(nx)/n, where B(nx) defines the total benefit of total group investment. The functions plotted are (a,d,g) B(xn) = α[β + dexp(κ–bxn)]–1α[β + dexp(κ)]–1, where α = 2000, d = 1, β = 1, κ = 0, b = 0.8; (b,e,h) B(xn) = b(xn)a, where b = 0.1 and α = 3; and (c,f,i) B(xn) = α[β + dexp(κbxn)]–1α[β + dexp(κ)]–1, where α = 10 000, d = 1, β = 2, κ = 7, b = 0.3. These functions are taken from [56] and are chosen for their respective shapes (diminishing, accelerating and sigmoidal). Panels (gi) show the evolutionary dynamics of investment for each of the benefit functions. These show how selection will act on investment levels. The solid lines show evolutionary attractors, whereas dashed lines show evolutionary repellors. With decelerating benefits (g), there is a unique ESS, which declines with group size. With accelerating benefits (h) cooperation is entirely disfavoured at low group sizes, but full cooperation also becomes a stable strategy with an increasingly large basin of attraction as group size increases. With sigmoidal benefits (i), there can be two singular strategies, one an attractor and the other a repellor. Cooperation is entirely disfavoured at both low and high group sizes, but stable cooperation can occur at intermediate group sizes. In gi, within group relatedness is set to r = 0.1, however, in all cases higher relatedness favours the evolution of cooperation [56]. The cost function used is C(x) = 5x. See [56] for further model details.
Figure 5.
Figure 5.
Social conflict shapes the evolution of signal production and signal response. Plotted are predictions of the model of Brown & Johnstone [59] for the evolution of investment in signalling and in cooperation. The fitness of a focal individual is given by w(m, M) = (1 − cm)(p + nM) − s, where c is the cost of cooperation, p is baseline fitness, n is group size (inferred from mean signal investment S), s is investment in signalling by the focal individual, m is the investment in cooperation by the focal individual, M is the average investment in cooperation in the focal individual's group and relatedness to the group R = dM/dm. This model leads to the prediction that, while cooperation increases monotonically with relatedness within a colony, signalling investment shows a humped relationship with relatedness. At low relatedness signalling collapses, as there is insufficient resultant cooperation. At high relatedness, minimal signalling is also favoured in order minimize the costs of regulating cooperation among identical individuals. However, at intermediate values of relatedness is at its maximum as cells attempt to ‘coerce’ cooperation from their neighbours. Parameter values are c = 0.04, p = 100 and n = 1000. For model details, see [59].

References

    1. Janga SC, Collado-Vides J. 2007. Structure and evolution of gene regulatory networks in microbial genomes. Res. Microbiol. 158, 787–794. (10.1016/j.resmic.2007.09.001) - DOI - PMC - PubMed
    1. Stover CK, et al. 2000. Complete genome sequence of Pseudomonas aeruginosa PAO1, an opportunistic pathogen. Nature 406, 959–964. (10.1038/35023079) - DOI - PubMed
    1. van Nimwegen E. 2003. Scaling laws in the functional content of genomes. Proc. Natl Acad. Sci. USA 19, 479–484. (10.1016/S0168-9525(03)00203-8) - DOI - PubMed
    1. Pardee AB, Jacob F, Monod J. 1959. The genetic control and cytoplasmic expression of ‘inducibility’ in the synthesis of β-galactosidase by E. coli. J. Mol. Biol. 1, 165–178. (10.1016/S0022-2836(59)80045-0) - DOI
    1. Fuqua WC, Winans SC, Greenberg EP. 1994. Quorum sensing in bacteria: the LuxR-LuxI family of cell density-responsive transcriptional regulators. J. Bacteriol. 176, 269–275. - PMC - PubMed

Publication types

MeSH terms

LinkOut - more resources