

Influence of environmental information in natural scenes and the effects of motion adaptation on a fly motion-sensitive neuron during simulated flight
- PMID: 25505148
- PMCID: PMC4295162
- DOI: 10.1242/bio.20149449
Influence of environmental information in natural scenes and the effects of motion adaptation on a fly motion-sensitive neuron during simulated flight
Abstract
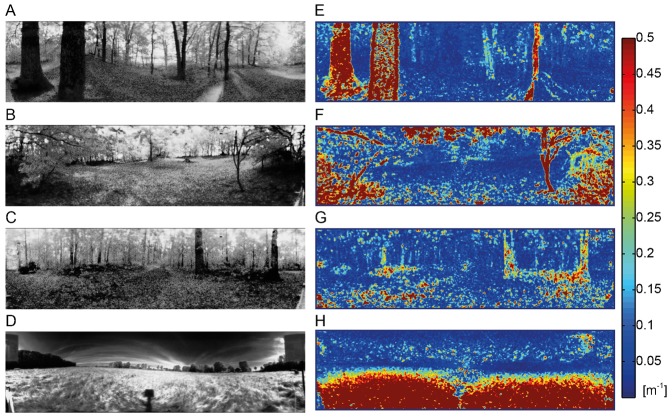
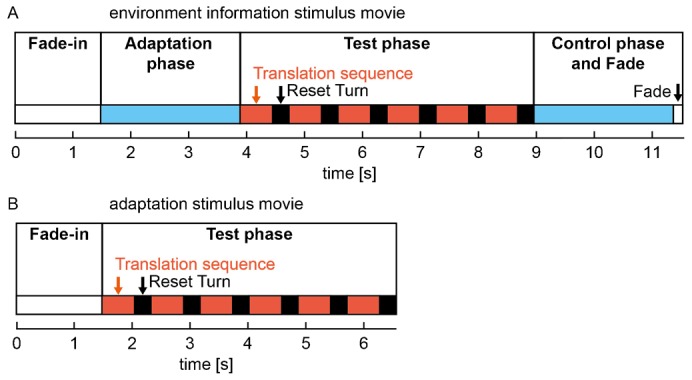
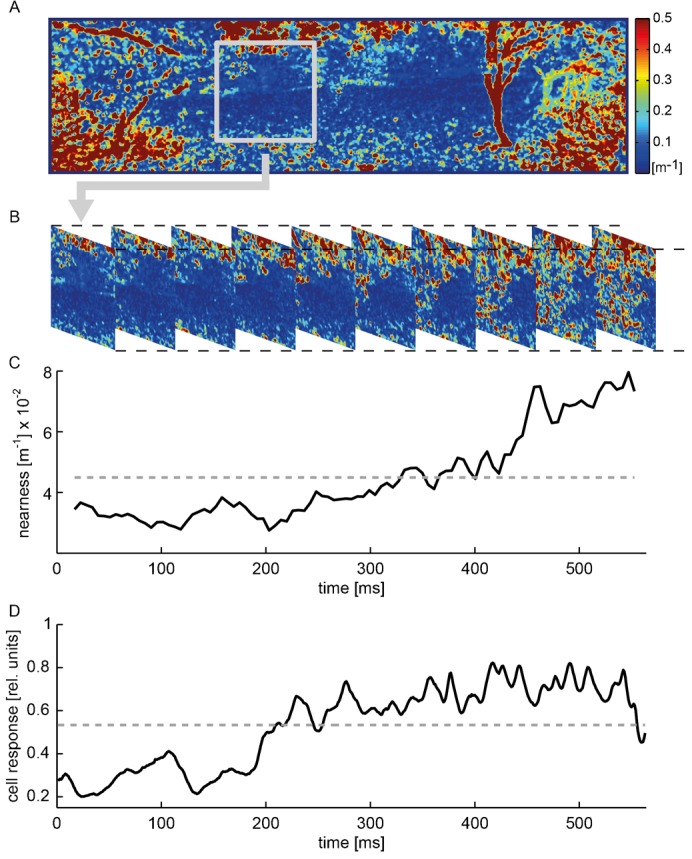
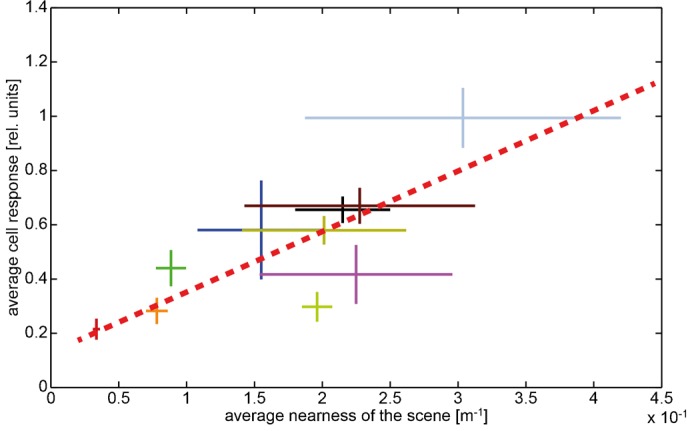
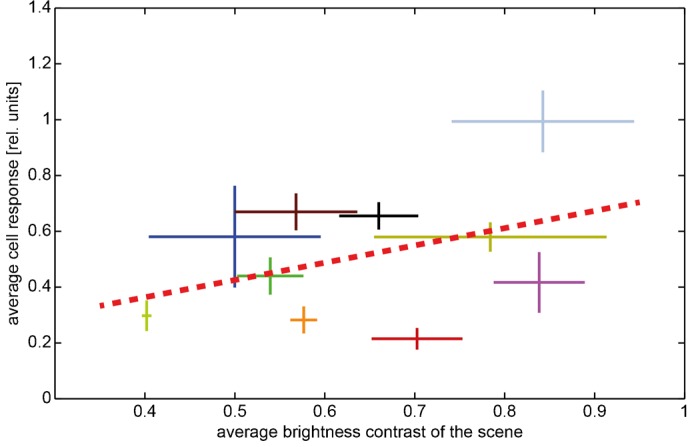
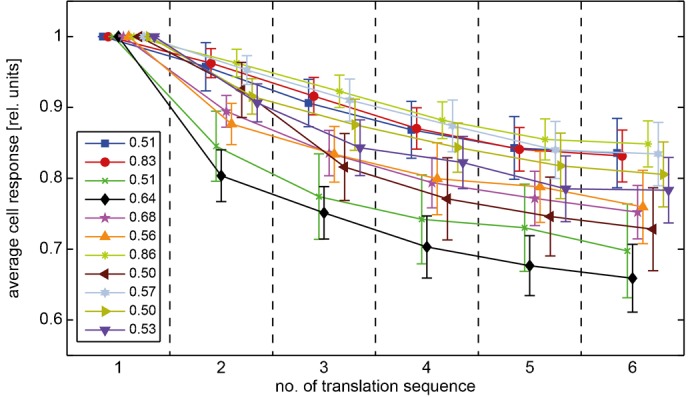
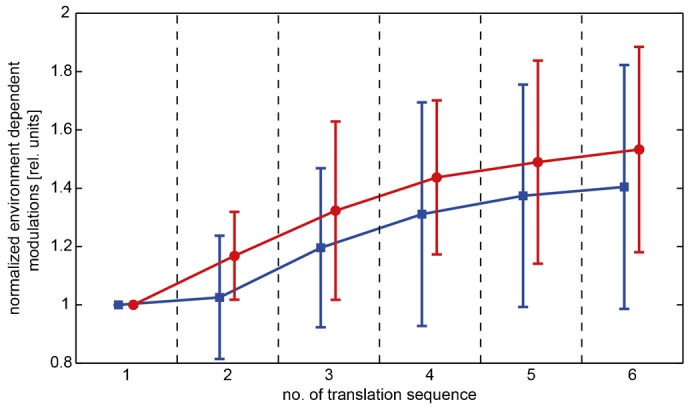
Gaining information about the spatial layout of natural scenes is a challenging task that flies need to solve, especially when moving at high velocities. A group of motion sensitive cells in the lobula plate of flies is supposed to represent information about self-motion as well as the environment. Relevant environmental features might be the nearness of structures, influencing retinal velocity during translational self-motion, and the brightness contrast. We recorded the responses of the H1 cell, an individually identifiable lobula plate tangential cell, during stimulation with image sequences, simulating translational motion through natural sceneries with a variety of differing depth structures. A correlation was found between the average nearness of environmental structures within large parts of the cell's receptive field and its response across a variety of scenes, but no correlation was found between the brightness contrast of the stimuli and the cell response. As a consequence of motion adaptation resulting from repeated translation through the environment, the time-dependent response modulations induced by the spatial structure of the environment were increased relatively to the background activity of the cell. These results support the hypothesis that some lobula plate tangential cells do not only serve as sensors of self-motion, but also as a part of a neural system that processes information about the spatial layout of natural scenes.
Keywords: Adaptation; Contrast; Fly; Natural images; Nearness; Neural activity; Spatial vision.
© 2015. Published by The Company of Biologists Ltd.
Conflict of interest statement
Figures
Similar articles
-
Motion adaptation and the velocity coding of natural scenes.Curr Biol. 2010 Jun 8;20(11):994-9. doi: 10.1016/j.cub.2010.03.072. Epub 2010 May 27. Curr Biol. 2010. PMID: 20537540
-
Velocity constancy and models for wide-field visual motion detection in insects.Biol Cybern. 2005 Oct;93(4):275-87. doi: 10.1007/s00422-005-0007-y. Epub 2005 Oct 19. Biol Cybern. 2005. PMID: 16151841
-
Contrast sensitivity of insect motion detectors to natural images.J Vis. 2008 Mar 28;8(3):32.1-9. doi: 10.1167/8.3.32. J Vis. 2008. PMID: 18484838
-
Depth information in natural environments derived from optic flow by insect motion detection system: a model analysis.Front Comput Neurosci. 2014 Aug 1;8:83. doi: 10.3389/fncom.2014.00083. eCollection 2014. Front Comput Neurosci. 2014. PMID: 25136314 Free PMC article.
-
Fly motion vision.Annu Rev Neurosci. 2010;33:49-70. doi: 10.1146/annurev-neuro-060909-153155. Annu Rev Neurosci. 2010. PMID: 20225934 Review.
Cited by
-
Contrast independent biologically inspired translational optic flow estimation.Biol Cybern. 2022 Dec;116(5-6):635-660. doi: 10.1007/s00422-022-00948-3. Epub 2022 Oct 27. Biol Cybern. 2022. PMID: 36303043 Free PMC article.
-
Motion as a source of environmental information: a fresh view on biological motion computation by insect brains.Front Neural Circuits. 2014 Oct 28;8:127. doi: 10.3389/fncir.2014.00127. eCollection 2014. Front Neural Circuits. 2014. PMID: 25389392 Free PMC article. Review.
-
Insect-Inspired Self-Motion Estimation with Dense Flow Fields--An Adaptive Matched Filter Approach.PLoS One. 2015 Aug 26;10(8):e0128413. doi: 10.1371/journal.pone.0128413. eCollection 2015. PLoS One. 2015. PMID: 26308839 Free PMC article.
-
Path integration and optic flow in flying insects: a review of current evidence.J Comp Physiol A Neuroethol Sens Neural Behav Physiol. 2025 May;211(3):375-401. doi: 10.1007/s00359-025-01734-9. Epub 2025 Mar 7. J Comp Physiol A Neuroethol Sens Neural Behav Physiol. 2025. PMID: 40053081 Free PMC article. Review.
-
Quantitative Characterization of Output from the Directionally Selective Visual Interneuron H1 in the Grey Flesh Fly Sarcophaga bullata.J Undergrad Neurosci Educ. 2021 Dec 24;20(1):A88-A99. eCollection 2021 Fall. J Undergrad Neurosci Educ. 2021. PMID: 35540945 Free PMC article.
References
LinkOut - more resources
Full Text Sources
Other Literature Sources
Research Materials
