. 2015 Jan 30;290(5):2902-18.
doi: 10.1074/jbc.M114.610733. Epub 2014 Dec 10.

A gut microbial metabolite of linoleic acid, 10-hydroxy-cis-12-octadecenoic acid, ameliorates intestinal epithelial barrier impairment partially via GPR40-MEK-ERK pathway

Affiliations

A gut microbial metabolite of linoleic acid, 10-hydroxy-cis-12-octadecenoic acid, ameliorates intestinal epithelial barrier impairment partially via GPR40-MEK-ERK pathway

Junki Miyamoto et al. J Biol Chem. .

Abstract

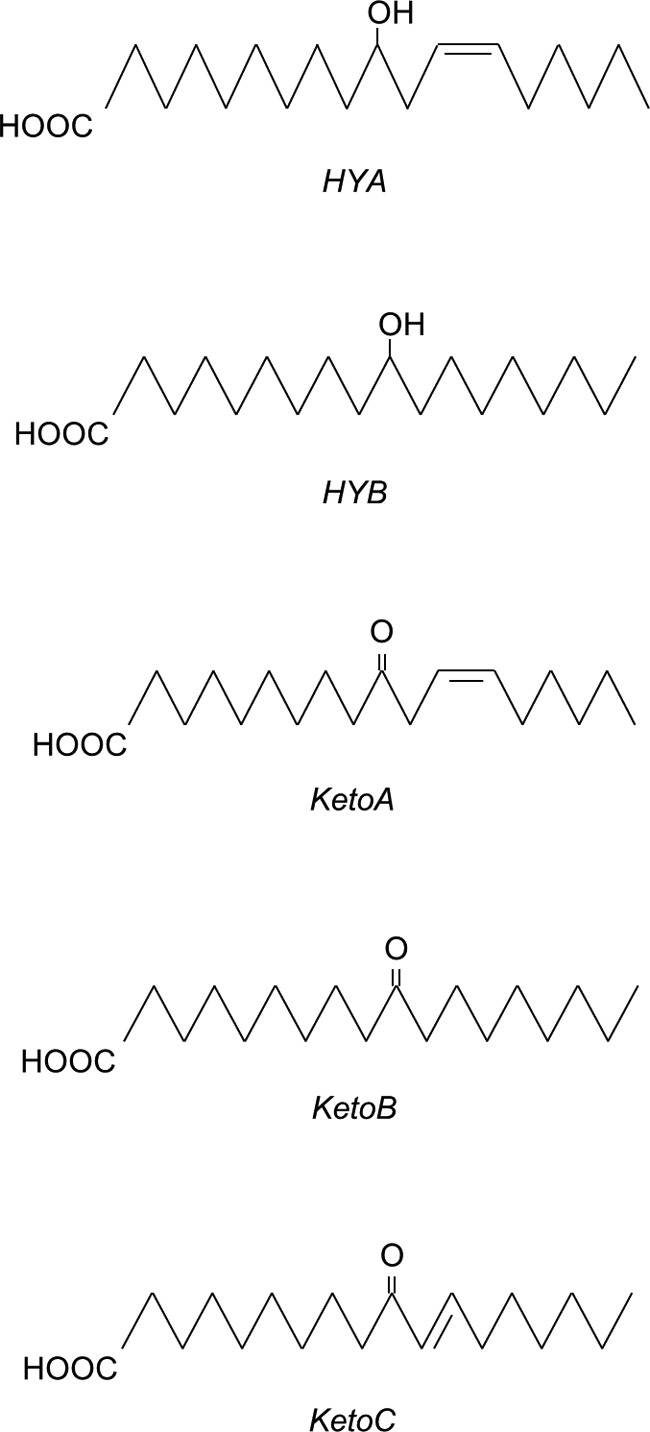
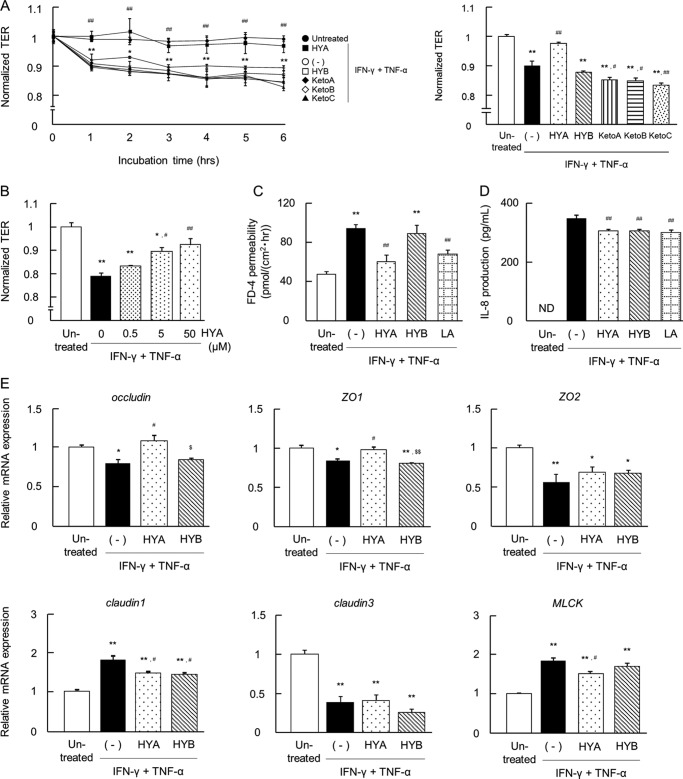
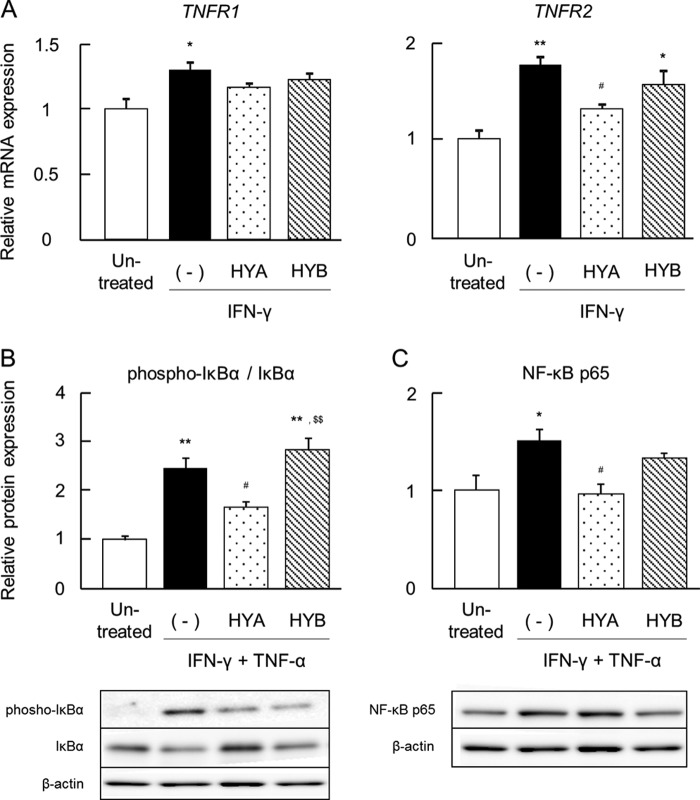
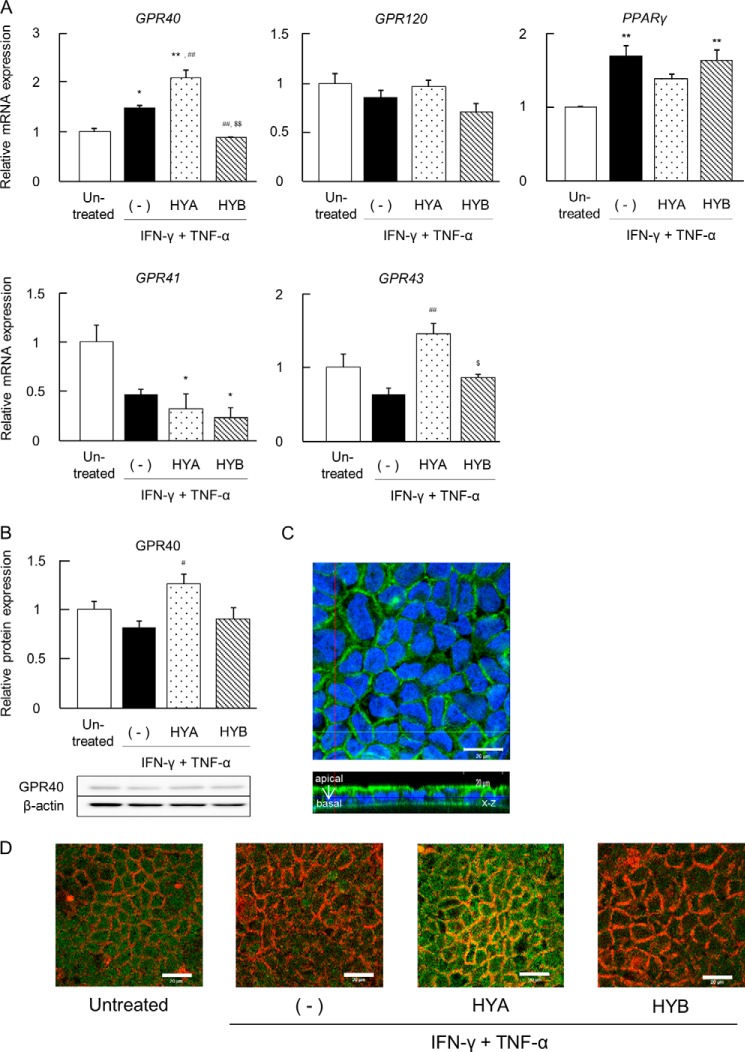
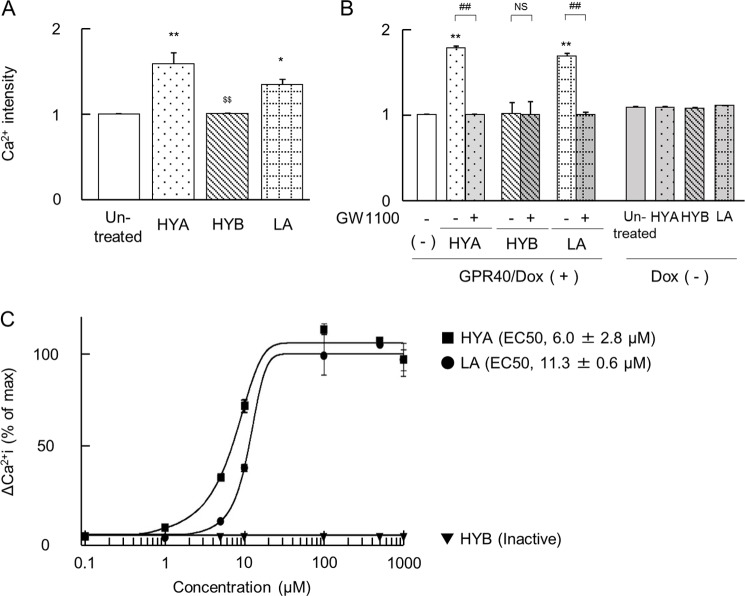
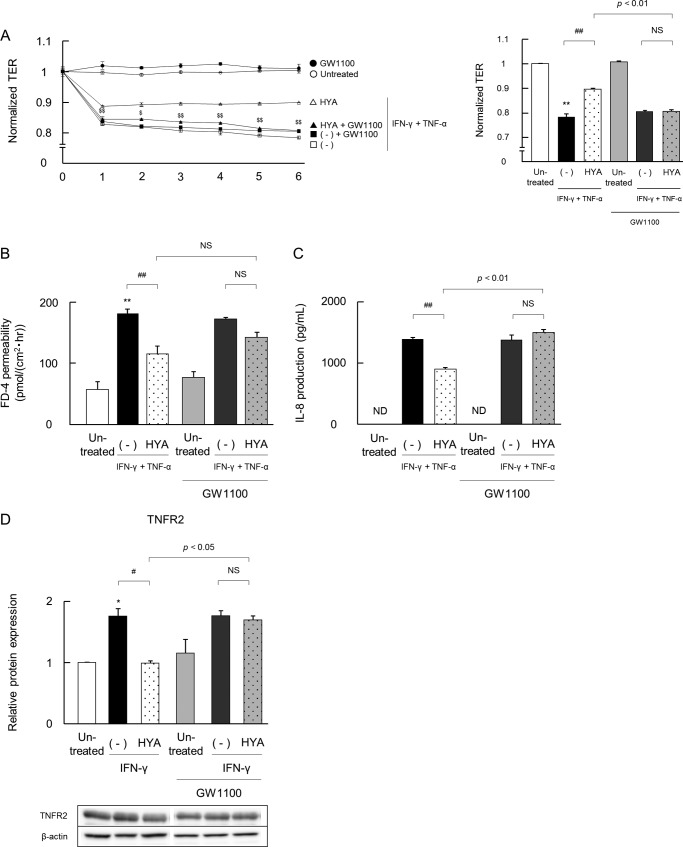
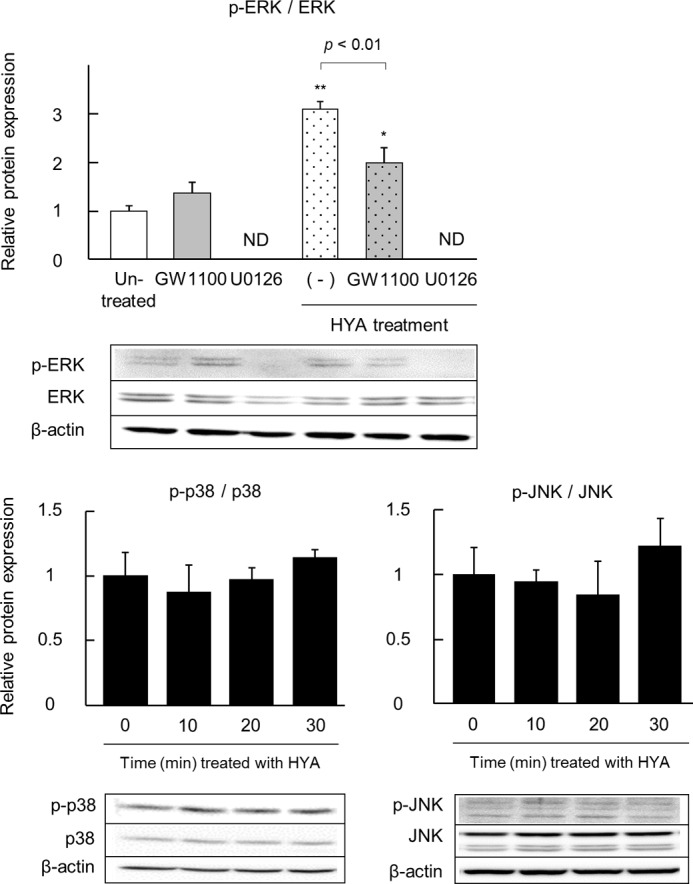
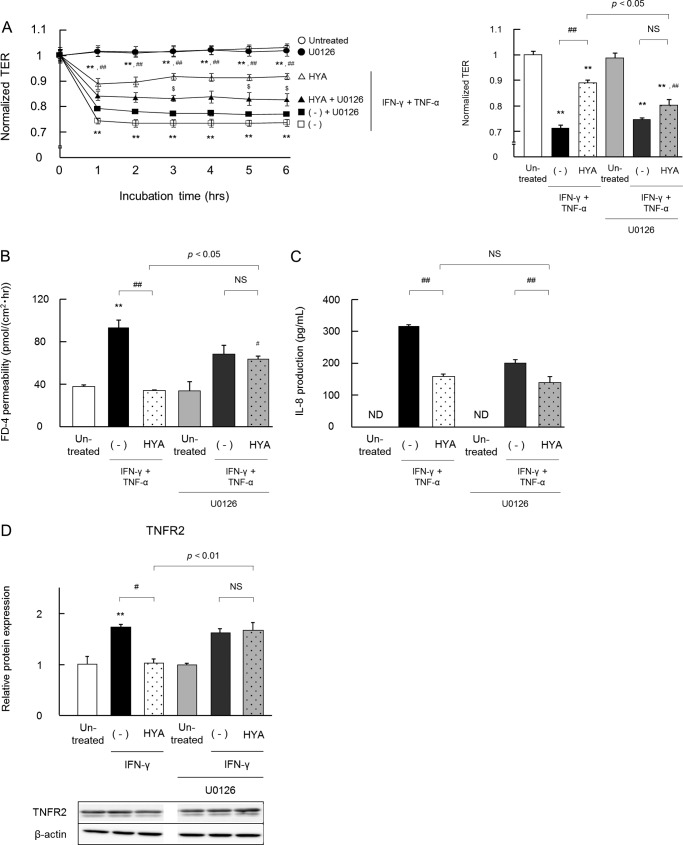
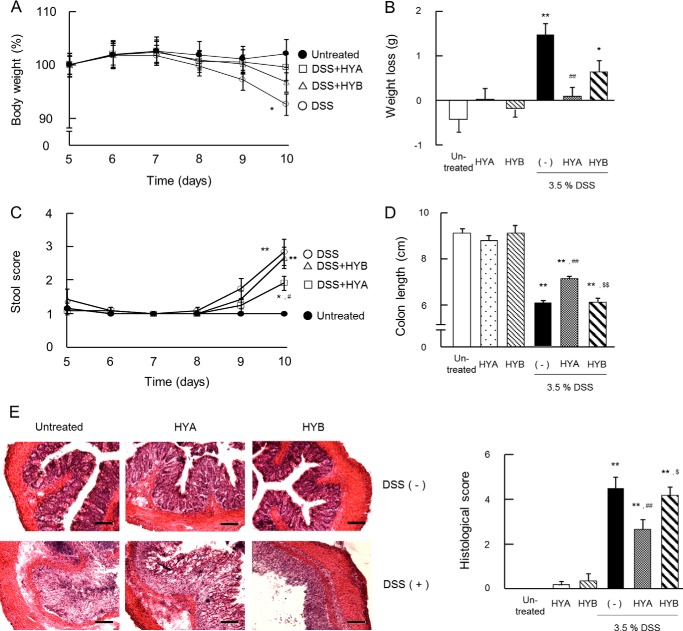
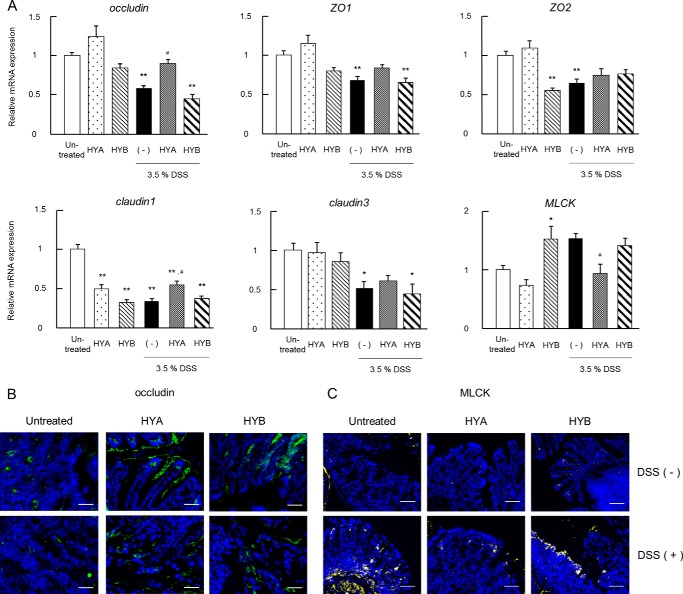
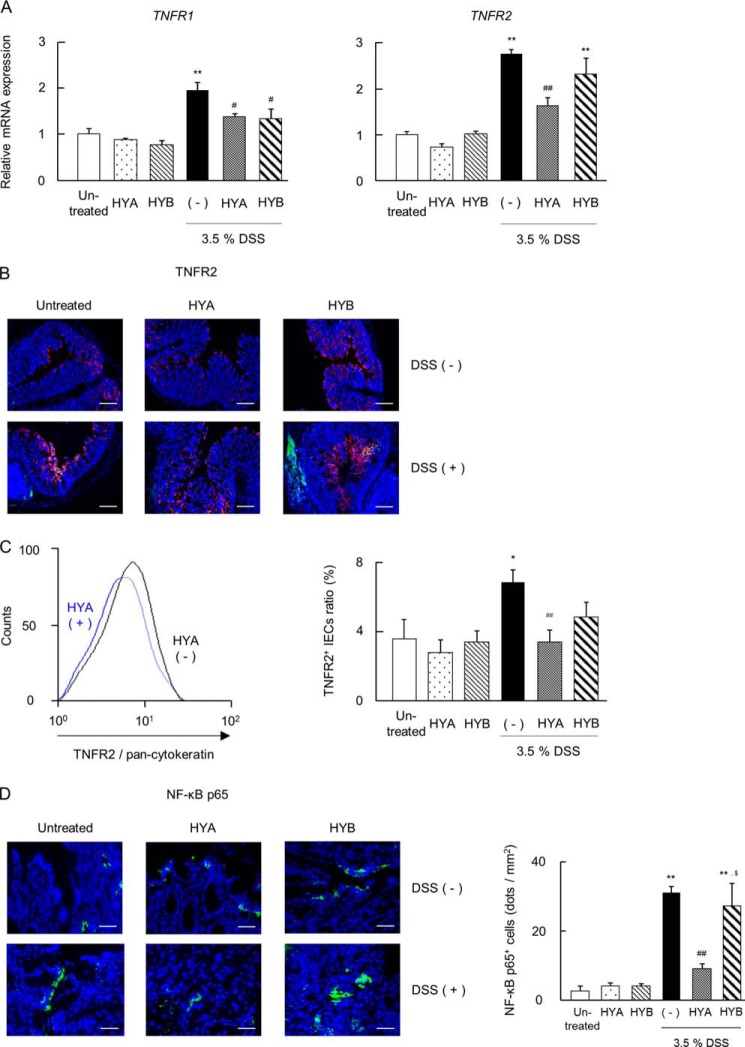
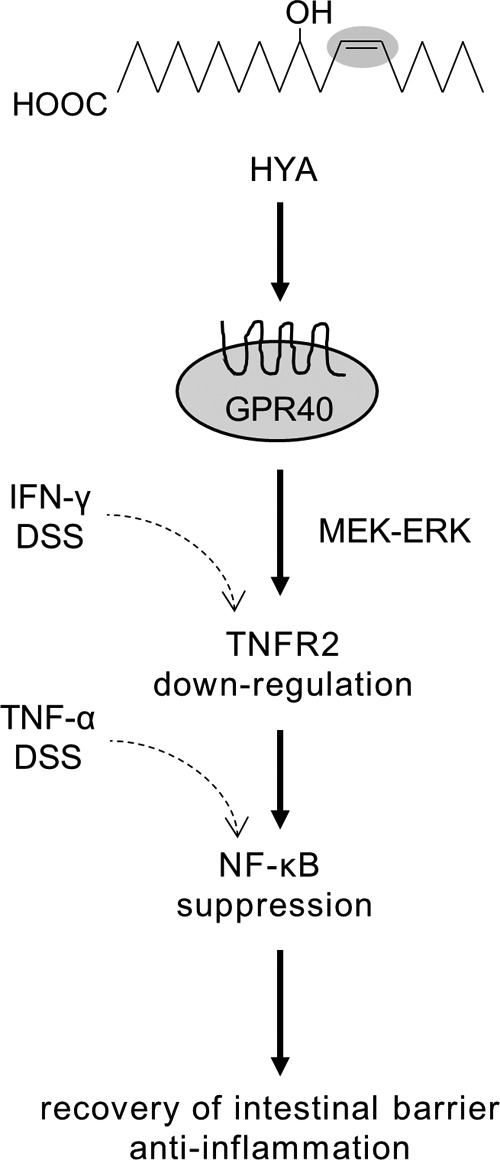
Gut microbial metabolites of polyunsaturated fatty acids have attracted much attention because of their various physiological properties. Dysfunction of tight junction (TJ) in the intestine contributes to the pathogenesis of many disorders such as inflammatory bowel disease. We evaluated the effects of five novel gut microbial metabolites on tumor necrosis factor (TNF)-α-induced barrier impairment in Caco-2 cells and dextran sulfate sodium-induced colitis in mice. 10-Hydroxy-cis-12-octadecenoic acid (HYA), a gut microbial metabolite of linoleic acid, suppressed TNF-α and dextran sulfate sodium-induced changes in the expression of TJ-related molecules, occludin, zonula occludens-1, and myosin light chain kinase. HYA also suppressed the expression of TNF receptor 2 (TNFR2) mRNA and protein expression in Caco-2 cells and colonic tissue. In addition, HYA suppressed the protein expression of TNFR2 in murine intestinal epithelial cells. Furthermore, HYA significantly up-regulated G protein-coupled receptor (GPR) 40 expression in Caco-2 cells. It also induced [Ca(2+)]i responses in HEK293 cells expressing human GPR40 with higher sensitivity than linoleic acid, its metabolic precursor. The barrier-recovering effects of HYA were abrogated by a GPR40 antagonist and MEK inhibitor in Caco-2 cells. Conversely, 10-hydroxyoctadacanoic acid, which is a gut microbial metabolite of oleic acid and lacks a carbon-carbon double bond at Δ12 position, did not show these TJ-restoring activities and down-regulated GPR40 expression. Therefore, HYA modulates TNFR2 expression, at least partially, via the GPR40-MEK-ERK pathway and may be useful in the treatment of TJ-related disorders such as inflammatory bowel disease.

Keywords: Caco-2; Colitis; Epithelial Cell; G Protein-coupled Receptor; Linoleic Acid; Metabolite; Microbiome; Tight Junction; Tumor Necrosis Factor (TNF).


Figures

FIGURE 1.
FIGURE 1.
Structures of fatty acids used in this study. HYA, 10-hydroxy-cis-12-octadecenoic acid; HYB, 10-hydroxyoctadecanoic acid; KetoA, 10-oxo-cis-12-octadecenoic acid; KetoB, 10-oxo-octadecanoic acid; KetoC, 10-oxo-trans-11-octadecenoic acid. These fatty acids were synthesized by our previously published method (4).
FIGURE 2.
FIGURE 2.
Effects of fatty acids on IFN-γ + TNF-α-induced barrier impairment in Caco-2 cells. A, Caco-2 cells were treated with the fatty acids (50 μm each) for 24 h and then stimulated with IFN-γ + TNF-α. Time course changes in TER were monitored (n = 3) (left). ●, untreated; ○, IFN-γ + TNF-α (−); ■, IFN-γ + TNF-α + HYA; □, IFN-γ + TNF-α + HYB; ♦, IFN-γ + TNF-α + KetoA; ♢, IFN-γ + TNF-α + KetoB; ▴, IFN-γ + TNF-α + KetoC. The data on TER at 6 h is shown (right). p < 0.05 and **, p < 0.01, compared between untreated (●) and IFN-γ + TNF-α (−); #, p < 0.05 and ##, p < 0.01, compared between IFN-γ + TNF-α + HYA (■) and IFN-γ + TNF-α (−) (Tukey-Kramer). B, recovery of TER at 6 h was examined with varying concentrations of HYA (0, 0.5, 5, and 50 μm) (n = 3). *, p < 0.05, and **, p < 0.01, compared with untreated; #, p < 0.05, and ##, p < 0.01, compared with IFN-γ + TNF-α (without HYA) (Tukey-Kramer). C, FD-4 permeability into the basal wells was assessed for 6 h (n = 3). LA, linoleic acid. D, after TER measurement at 6 h, the basal medium was collected and the IL-8 concentration was determined (n = 3). LA, linoleic acid. E, total RNA was extracted from Caco-2 cells at 6 h, and mRNA expression was examined by real time RT-PCR. Data are presented as the fold change in gene expression from the control (untreated), after normalization to the β-actin gene (n = 3). *, p < 0.05, and **, p < 0.01, compared with untreated; ##, p < 0.01, compared with IFN-γ + TNF-α (−); $, p < 0.05, and $$, p < 0.01, compared with HYA (Tukey-Kramer). Results are expressed as means ± S.E. Each result (in A–E) is representative of three independent similar experiments.
FIGURE 3.
FIGURE 3.
Effects of HYA and HYB on the expression of TNFRs. A, after stimulation with IFN-γ for 24 h, total RNA was extracted from Caco-2 cells, and the mRNA expression of TNFRs was examined by real time RT-PCR (n = 3). B and C, protein was extracted from Caco-2 cells, and protein expression of phospho-IκBα/IκBα (B) and NF-κB p65 (C) was examined by immunoblotting (n = 3). Results are expressed as means ± S.E. *, p < 0.05, and **, p < 0.01, compared with untreated; #, p < 0.05, compared with IFN-γ (A), IFN-γ + TNF-α (B and C) (−); $$, p < 0.01, compared with HYA (Tukey-Kramer). Data (in A–C) are representative of three independent similar experiments.
FIGURE 4.
FIGURE 4.
Effects of HYA and HYB on expression of fatty acid receptors. A, after stimulation with TNF-α for 6 h, total RNA was extracted from Caco-2 cells, and the mRNA expression of fatty acid receptors (GPR40, GPR120, PPARγ, GPR41, and GPR43) was examined by real time RT-PCR (n = 3). B, protein was extracted from Caco-2 cells (n = 3), and expression of GPR40 was examined by immunoblotting. Results are expressed as means ± S.E. *, p < 0.05, and **, p < 0.01, compared with untreated; #, p < 0.05, and ##, p < 0.01, compared with IFN-γ + TNF-α (−); $, p < 0.05, and $$, p < 0.01, compared with HYA (Tukey-Kramer). Each result (A and B) is representative of three independent similar experiments. C and D, after stimulation with IFN-γ + TNF-α, Caco-2 cells were labeled for GPR40 (green) and DAPI (blue) (C) or GPR40 (green) and rhodamine-phalloidin (red) (D). The x-z as well as x-y fluorescence images of HYA-treated cells were obtained (C). Scale bars, 20 μm. Each image (C and D) is representative of two independent similar experiments.
FIGURE 5.
FIGURE 5.
Induction of [Ca2+]i rise by HYA in Caco-2 cells and HEK293 cells expressing human GPR40. A, mobilization of [Ca2+]i induced by HYA, HYB, and linoleic acid (100 μm each) was monitored in Caco-2 cells, and data are presented as relative Ca2+ intensity (n = 3). LA, linoleic acid. **, p < 0.01, and *, p < 0.05, compared with untreated; $$, p < 0.01, compared with HYA (Tukey-Kramer). B, mobilization of [Ca2+]i induced by HYA, HYB, and linoleic acid (10 μm each) was monitored in GPR40-expressing HEK293 cells. The cells were pretreated with or without the GPR40 antagonist GW1100 for 15 min prior to the addition of the fatty acids. HEK293 cells not expressing GPR40 were used as negative controls (doxycycline (Dox (−)) (n = 3).**, p < 0.01, compared with untreated; ##, p < 0.01, compared with GW1100 (+). NS, not significant (Tukey-Kramer). C, representative dose-response curve of HYA-induced [Ca2+]i rise in HEK293-hGPR40 cells (n = 3). ●, linoleic acid; ■, HYA; ▾, HYB. Inactive, no response at 1,000 μm. EC50 indicates the concentration of a sample that produces 50% of the maximal response and was calculated from dose-response curves. Results are expressed as means ± S.E. Each result (A–C) is representative of three similar experiments.
FIGURE 6.
FIGURE 6.
Inhibitory effects of a GPR40 antagonist on the barrier-recovering and TNFR2-suppressive activity of HYA. Caco-2 cells were pretreated with the GPR40 antagonist GW1100 for 30 min, and then the barrier-recovering effects of HYA were evaluated as per Fig. 2. A, time course of changes in TER. Open symbols are values from cells without GW1100 treatment, and closed symbols are with GW1100 treatment (left). ○ and ●, untreated; □ and ■, IFN-γ + TNF-α; ▵ and ▴, IFN-γ + TNF-α + HYA. The data on TER at 6 h is shown (right). B and C, evaluation of FD-4 permeability and IL-8 concentration. D, effects of HYA on TNFR2 expression were evaluated as per Fig. 3 by immunoblotting. *, p < 0.05, and **, p < 0.01, compared with untreated; #, p < 0.05, and ##, p < 0.01, compared with IFN-γ + TNF-α (−) or IFN-γ (−);$, p < 0.05, and $$, p < 0.01, compared with HYA (Tukey-Kramer). ND, not detected. NS, not significant. Data represent the means ± S.E. Each result (A–D) is representative of three independent similar experiments.
FIGURE 7.
FIGURE 7.
Effect of HYA on the phosphorylation of MAPK. Caco-2 cells were treated with HYA (50 μm) for 0-30 min (p38 and JNK) or 20 min (ERK). Also, some cells were pretreated with the GPR40 antagonist GW1100 or the MEK inhibitor U0126 for 30 min (ERK). Protein was extracted from Caco-2 cells, and phosphorylated and total protein expression of ERK, p38, and JNK was examined by immunoblotting (n = 3). *, p < 0.05, and **, p < 0.01, compared with untreated (Tukey-Kramer). Each result is representative of two similar experiments. ND, not detected.
FIGURE 8.
FIGURE 8.
Inhibitory effects of a MEK inhibitor on the barrier-recovering activity of HYA. Caco-2 cells were pretreated with the MEK inhibitor U0126 for 30 min and then the barrier-recovering effects of HYA and TNFR2 expression were evaluated as per Figs. 2 and 3, respectively. A, time course of changes in TER. Open symbols are values from cells without U0126 treatment, and closed symbols are with U0126 treatment (left). ○ and ●, untreated; □ and ■, IFN-γ + TNF-α; ▵ and ▴, IFN-γ + TNF-α + HYA. The data on TER at 6 h is shown (right). B–D, evaluation of FD-4 permeability, IL-8 concentration, and TNFR2 expression (n = 3). **, p < 0.01, compared with untreated; #, p < 0.05, and ##, p < 0.01, compared with IFN-γ + TNF-α with or without U0126 (−); $, p < 0.05, and $$, p < 0.01, compared with HYA without U0126 (Tukey-Kramer). ND, not detected. NS, not significant. Results are expressed as means ± S.E. Each result (A–C) is representative of two similar experiments.
FIGURE 9.
FIGURE 9.
Anti-inflammatory effects of HYA in DSS-induced colitis in mice. A and C, mice were monitored daily for weight (A) and stool score (C), which ranges from 1 to 4 (total) representing the average of scores from 1 to 4 for rectal bleeding (1 = normal, 2 = loose stools, 3 = diarrhea, 4 = watery diarrhea) and stool consistency (1 = normal, 2 = slight bleeding, 3 = severe bleeding, 4 = gross bleeding). The data from the last 5 days of the experimental period are shown. ●, untreated; ○, DSS-treated mice; □, DSS-treated mice with HYA administration; and ▵, DSS-treated mice with HYB administration (n = 6). The data for HYA or HYB alone groups were similar to the untreated group. Weight loss was calculated (B) and the colon length was measured on day 10 (D). E, colonic tissue sections were stained with hematoxylin and eosin for histological examination. Scale bars, 100 μm. Histological examination was performed by assigning a score for epithelial damage and leukocyte infiltration on microscopic cross-sections of the colon in each mice. *, p < 0.05, and **, p < 0.01, compared with untreated; #, p < 0.05, and ##, p < 0.01, compared with DSS-treated mice without HYA and HYB administration (−); $, p < 0.05, and $$, p < 0.01, compared with DSS+HYA (Tukey-Kramer). Each result (A–E) is representative of two independent similar experiments.
FIGURE 10.
FIGURE 10.
Recovering effects of HYA on DSS-induced TJ impairment. A, total RNA was extracted from colonic tissue of DSS-induced colitis mice, and the mRNA expression of TJ-related molecules were examined by real time RT-PCR. Data are presented as the fold change in gene expression from the control (untreated), after normalization to the GAPDH gene (n = 6). B and C, cryosections of colonic tissue were immunolabeled for occludin (green) (B) or MLCK (yellow) (C), and DAPI (blue). Scale bars, 50 μm (B) or 100 μm (C). Results are expressed as means ± S.E. *, p < 0.05, and **, p < 0.01, compared with untreated; #, p < 0.05, and ##, p < 0.01, compared with DSS-treated mice without HYA and HYB administration (−) (Tukey-Kramer). Each result (A–C) is representative of two independent similar experiments.
FIGURE 11.
FIGURE 11.
Effects of HYA on the TNFR expression in DSS-induced colitis mice. A, total RNA was extracted from colonic tissue of DSS-induced colitis mice, and the mRNA expression of TNFRs was examined by real time RT-PCR (n = 6). B, cryosections of colonic tissue were immunolabeled for TNFR2 (green), DAPI (blue), and CD326 (red). Scale bars, 100 μm. C, intestinal epithelial cells were stained for pan-cytokeratin and TNFR2 and analyzed by flow cytometry. The representative histogram analysis (left) and the percentage of TNFR2-positive IECs (right) are shown. D, cryosections of colonic tissue were immunolabeled for NF-κB p65 (green) and DAPI (blue) (left). Scale bars, 50 μm. The number of NF-κB p65-positive cells were counted (right). *, p < 0.05, and **, p < 0.01, compared with untreated; #, p < 0.05, and ##, p < 0.01, compared with DSS-treated mice without HYA and HYB administration (−) (Tukey-Kramer). Each result (A–D) is representative of two independent similar experiments.
FIGURE 12.
FIGURE 12.
Schematic showing the association between the barrier recovering activity of HYA and GPR40 signaling.

References

    1. Gerasimenko J. V., Gryshchenko O., Ferdek P. E., Stapleton E., Hébert T. O., Bychkova S., Peng S., Begg M., Gerasimenko O. V., Petersen O. H. (2013) Ca2+ release-activated Ca2+ channel blockade as a potential tool in antipancreatitis therapy. Proc. Natl. Acad. Sci. U.S.A. 110, 13186–13191 - PMC - PubMed
    1. Cao Z., Mulvihill M. M., Mukhopadhyay P., Xu H., Erdélyi K., Hao E., Holovac E., Haskó G., Cravatt B. F., Nomura D. K., Pacher P. (2013) Monoacylglycerol lipase controls endocannabinoid and eicosanoid signaling and hepatic injury in mice. Gastroenterology 144, 808–817 - PMC - PubMed
    1. von Moltke J., Trinidad N. J., Moayeri M., Kintzer A. F., Wang S. B., van Rooijen N., Brown C. R., Krantz B. A., Leppla S. H., Gronert K., Vance R. E. (2012) Rapid induction of inflammatory lipid mediators by the inflammasome in vivo. Nature 490, 107–111 - PMC - PubMed
    1. Kishino S., Takeuchi M., Park S. B., Hirata A., Kitamura N., Kunisawa J., Kiyono H., Iwamoto R., Isobe Y., Arita M., Arai H., Ueda K., Shima J., Takahashi S., Yokozeki K., Shimizu S., Ogawa J. (2013) Polyunsaturated fatty acid saturation by gut lactic acid bacteria affecting host lipid composition. Proc. Natl. Acad. Sci. U.S.A. 110, 17808–17813 - PMC - PubMed
    1. Ogawa J., Kishino S., Ando A., Sugimoto S., Mihara K., Shimizu S. (2005) Production of conjugated fatty acids by lactic acid bacteria. J. Biosci. Bioeng. 100, 355–364 - PubMed

Publication types