. 2015 Jan 30;290(5):2715-27.
doi: 10.1074/jbc.M114.619536. Epub 2014 Dec 12.

Fancd2 is required for nuclear retention of Foxo3a in hematopoietic stem cell maintenance

Affiliations

Fancd2 is required for nuclear retention of Foxo3a in hematopoietic stem cell maintenance

Xiaoli Li et al. J Biol Chem. .

Abstract

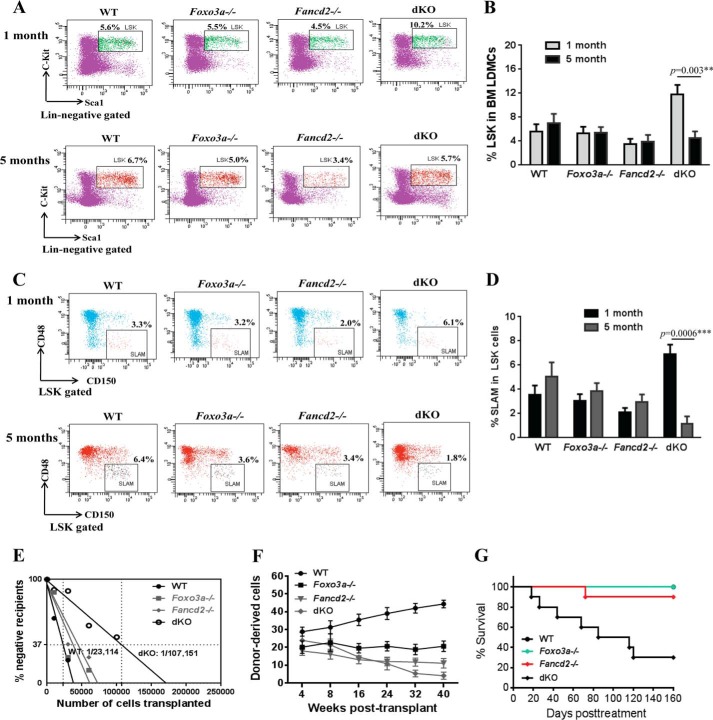
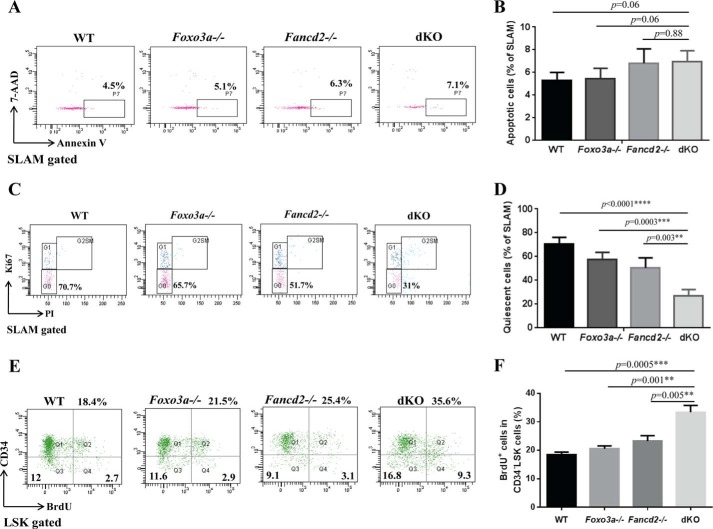
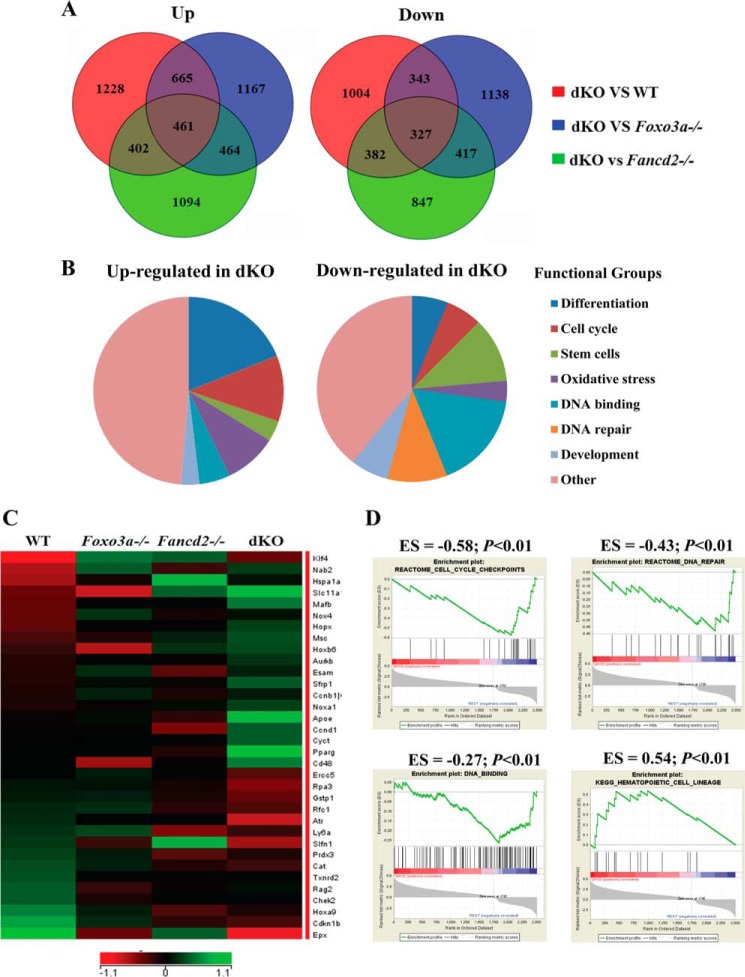
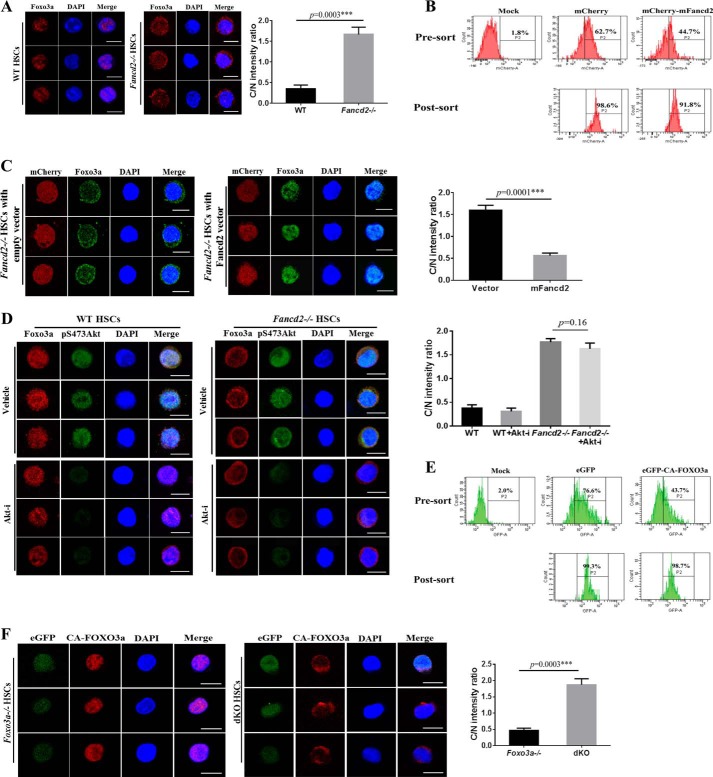
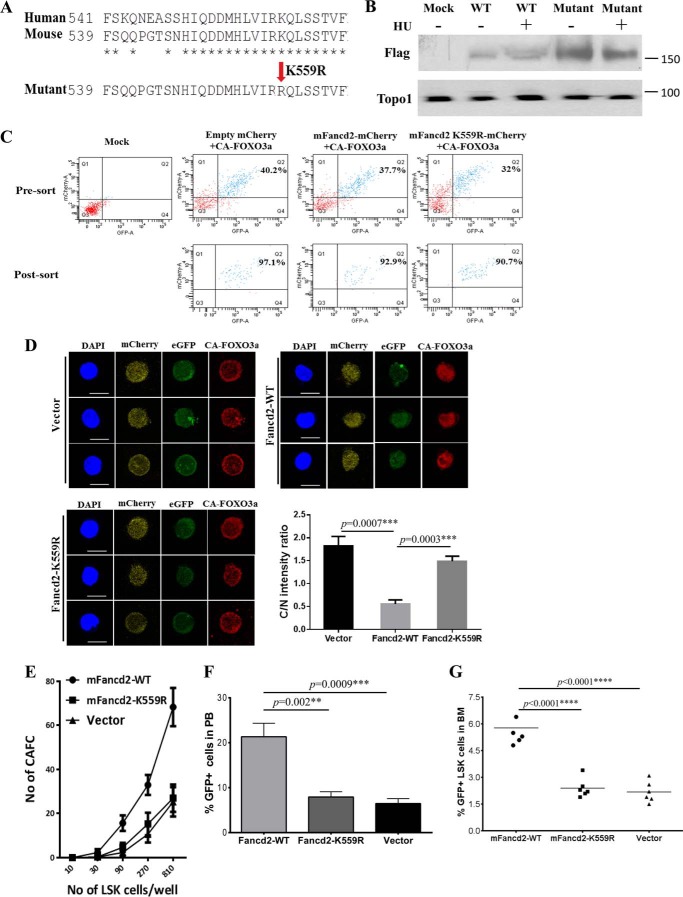
Functional maintenance of hematopoietic stem cells (HSCs) is constantly challenged by stresses like DNA damage and oxidative stress. Here we show that the Fanconi anemia protein Fancd2 and stress transcriptional factor Foxo3a cooperate to prevent HSC exhaustion in mice. Deletion of both Fancd2 and Foxo3a led to an initial expansion followed by a progressive decline of bone marrow stem and progenitor cells. Limiting dilution transplantation and competitive repopulating experiments demonstrated a dramatic reduction of competitive repopulating units and progressive decline in hematopoietic repopulating ability of double-knockout (dKO) HSCs. Analysis of the transcriptome of dKO HSCs revealed perturbation of multiple pathways implicated in HSC exhaustion. Fancd2 deficiency strongly promoted cytoplasmic localization of Foxo3a in HSCs, and re-expression of Fancd2 completely restored nuclear Foxo3a localization. By co-expressing a constitutively active CA-FOXO3a and WT or a nonubiquitinated Fancd2 in dKO bone marrow stem/progenitor cells, we demonstrated that Fancd2 was required for nuclear retention of CA-FOXO3a and for maintaining hematopoietic repopulation of the HSCs. Collectively, these results implicate a functional interaction between the Fanconi anemia DNA repair and FOXO3a pathways in HSC maintenance.

Keywords: DNA Damage; DNA Repair; FOXO; Fancd2; Hematopoietic Stem Cells; Oxidative Stress.


Figures

FIGURE 1.
FIGURE 1.
Deletion of Fancd2 and Foxo3a causes HSC exhaustion. A, frequency of LSK (Lin c-Kit+ Sca-1+) cells in the BM of WT, Foxo3a−/−, Fancd2−/−, and dKO mice at 1 and 5 months of age. Shown are representative flow plots. B, quantitation of BM LSK cells in WT, Foxo3a−/−, Fancd2−/−, and dKO mice at 1 and 5 months old. Each group comprises four to six mice. C, frequency of SLAM (LSK CD150+ CD48) cells in BM LSK cells from WT, Foxo3a−/−, Fancd2−/−, and dKO mice at 1 and 5 months of age. Shown are representative flow plots. D, quantitation of BM SLAM cells in WT, Foxo3a−/−, Fancd2−/−, and dKO mice at 1 and 5 months old. Each group comprises four to six mice. E, competitive repopulating units determined by limiting dilution BM transplantation assay. Graded numbers of test BM cells (CD45.2+) were mixed with 2 × 10⁵ protector BM cells (CD45.1+) and transplanted into irradiated congenic recipients (CD45.1+). Plotted are the percentages of recipient mice containing less than 1% CD45.2+ blood nucleated cells at 16 weeks after transplantation. Frequency of functional HSCs was calculated according to Poisson statistics. F, competitive repopulation assay. 50 SLAM test (CD45.2+) and 4 × 10⁵ competitor (CD45.1+) whole BM cells were mixed and transplanted into irradiated CD45.1+ recipients. Donor-derived cells (CD45.2+) in the peripheral blood were determined at 4–40 weeks post-transplantation. The data are means ± S.E. (n = 8–10 from two independent experiments). G, Kaplan-Meier survival curves of secondary recipients (n = 8–10). 2,000 sorted LSKs from the indicated mice were transplanted into sublethally irradiated CD45.1+ mice, and 8 weeks later, the primary recipient mice were sacrificed, and CD45.2+ LSKs were sorted again and transplanted into lethally irradiated secondary recipients at 1,500 cells/mouse. The data shown are the survival rates expressed as a percentage. **, p < 0.01; ***, p < 0.001.
FIGURE 2.
FIGURE 2.
Loss of Fancd2 and Foxo3a increases proliferation of HSCs. A, flow cytometric analysis of apoptotic cells within the phenotypic HSC (SLAM) population. BM cells of WT, Foxo3a−/−, Fancd2−/−, and Foxo3a−/− Fancd2−/− dKO mice were gated for the SLAM population and analyzed for annexin V-positive cells. 7-AAD, 7-aminoactinomycin D. B, quantification of annexin V-positive cells within the SLAM population. Each group comprises six mice. C, cell cycle analysis of SLAM cells. BM cells of WT, Foxo3a−/−, Fancd2−/−, and Foxo3a−/− Fancd2−/− dKO mice were gated for the SLAM population and analyzed for cell cycle phases by flow cytometry. Representative dot plots of DNA content (PI) were plotted versus Ki-67 staining. G0, Ki-67 and 2n DNA; G1, Ki-67+ and 2n DNA; G2SM, Ki67+ and DNA>2n. D, quantification of quiescent (G0) cells within the SLAM population. Each group comprised six mice. E, BrdUrd incorporation analysis of CD34LSK cells. WT, Foxo3a−/−, Fancd2−/−, and Foxo3a−/− Fancd2−/− dKO mice at the age of 4–6 weeks were injected with a single dose of BrdUrd. 48 h later, the mice were sacrificed, and BM cells were analyzed for BrdUrd positive cells by flow cytometry. F, quantification of BrdUrd positive cells in the CD34LSK cells. Each group comprises four to six mice. **, p < 0.01; ***, p < 0.001; ****, p < 0.0001.
FIGURE 3.
FIGURE 3.
Global gene expression analysis of phenotypic HSCs. Whole genome microarray data were obtained from freshly isolated SLAM (LSK CD150+CD48) cells from WT, Foxo3a−/−, Fancd2−/−, and dKO mice. A, Venn diagrams illustrating the overlap between genes up-regulated and down-regulated in WT, Foxo3a−/−, Fancd2−/−, and dKO SLAM cells. B, pie charts show the distribution of the 461 up-regulated and the 327 down-regulated genes in dKO SLAM cells into functional groups. C, heat map displays the expression of genes with cell cycle checkpoint, DNA repair, oxidative stress, and HSC differentiation-related functional annotations that are significantly down-regulated and up-regulated in dKO SLAM cells. The rows correspond to genes, and the columns correspond to samples. Gene expression values are indicated on a log2 scale according to the color scheme shown. Unregulated and down-regulated genes are presented in green and red, respectively. D, GSEA analyses are shown for gene sets identified for cell cycle checkpoints, DNA repair, DNA binding, and HSC differentiation pathways. For each GSEA, the p value and enrichment score (ES) are shown above each pathway graph.
FIGURE 4.
FIGURE 4.
Fancd2 is required for nuclear localization of Foxo3a in HSCs. A, increased cytoplasmic Foxo3a staining in Fancd2−/− HSCs. Left panel, freshly isolated CD34LSK cells from WT and Fancd2−/− BM were immunostained to detect Foxo3a (red). Nuclei were visualized using DAPI (blue). Scale bar, 10 μm. Right panel, ratio of fluorescence intensity of anti-Foxo3a staining in cytoplasm (C) and the nucleus (N). B, flow cytometry of mCherry-positive cells before and after sorting. Mock, samples without virus. C, re-expression of Fancd2 restores Foxo3a nuclear localization. Left panel, mFancd2-mCherry or empty-mCherry lentivirus transduced Fancd2−/− CD34LSK cells were stained with anti-Foxo3a antibody (green) and DAPI (blue). Scale bar, 10 μm. Right panel, ratio of fluorescence intensity of anti-Foxo3a staining in cytoplasm (C) and the nucleus (N). D, enhanced cytoplasmic localization of Foxo3a in Fancd2−/− HSCs is independent of Akt activation. Left panel, CD34LSK cells from the WT and Fancd2−/− BM were treated with AKT inhibitor (5 μm) for 2 h. Foxo3a, pS473AKT, and nuclear DNA were visualized by red, green, and blue, respectively. Scale bar, 10 μm. Right panel, quantification of the fluorescence intensity of anti-Foxo3a staining in cytoplasm (C) and the nucleus (N). E, flow cytometry of GFP-positive cells before and after sorting. Mock, samples without virus. F, Fancd2 is required for nuclear retention of the constitutively active CA-FOXO3a in HSCs. Left panel, Foxo3a−/− and Fancd2−/− Foxo3a−/− dKO CD34LSK cells were transduced with lentivirus expressing the active CA-FOXO3a and eGFP (green). Transduced CD34LSK cells were staining by anti-FOXO3a antibody (red). Nuclei were visualized by DAPI (blue). Scale bar, 10 μm. Right panel, quantification of the fluorescence intensity of anti-FOXO3a staining in the nucleus (N) and cytoplasm (C). Each group comprises three to four mice and 20 cells per sample. Akt-i, Akt inhibitor; ***, p < 0.001.
FIGURE 5.
FIGURE 5.
Fancd2 and Foxo3a cooperate to maintain HSC function. A, protein sequence alignment of human and mouse Fancd2 and generation of a mutant mFancd2 that had arginine residue substituted for the lysine residue at position 559. B, WT murine embryonic fibroblast cells were transduced with lentivirus carrying empty vector, mFancd2-WT, or mFancd2-K559R and then treated with or without hydrourea (HU) for 24 h. Cell lysis were separated by SDS-PAGE gel and immunoblotted with antibodies against Flag (mFancd2) and Topo1 (loading control). C, the dKO LSK cells were co-transduced with lentivirus expressing the CA-FOXO3a-eGFP and mFancd2 WT-mCherry or mFancd2 K559R-mCherry and then sorted for double-positive (eGFP+ mcherry+) CD34LSK cells. Shown is flow cytometry analysis of the double-positive cells before and after sorting. Mock, samples without virus. D, monoubiquitination is essential for the effect of Fancd2 on FOXO3a nuclear retention. dKO LSK cells were co-transduced with lentivirus expressing the constitutively active CA-FOXO3a with an eGFP marker (CA-FOXO3a-eGFP) (green) and the WT mouse Fancd2 with a mCherry marker (mFancd2 WT-mCherry) or its nonmonoubiquitinated mutant (mFancd2 K559R-mCherry) (yellow). Transduced CD34LSK cells were staining by anti-FOXO3a antibody (red). Nuclei were visualized by DAPI (blue). Scale bar, 10 μm. Right panel, quantification of the fluorescence intensity of anti-Foxo3a staining in the nucleus (N) and cytoplasm (C). Each group comprises three to four mice, and 20 cells per sample. E, limiting dilution CAFC assay. dKO LSK cells were co-transduced with lentivirus expressing the WT FOXO3a with an eGFP marker and the WT mouse Fancd2 with a mCherry marker (mFancd2-WT) or its nonmonoubiquitinated mutant (mFancd2-K559R) or an empty vector. Graded numbers of double-positive (eGFP+ mcherry+) LSK cells were plated on confluent OP9 stromal cells in 96-well plates, and numbers of CAFC were counted after 4 weeks. F and G, BM transplantation assay to determine the long term hematopoietic repopulating ability. 1,000 double-positive (eGFP+ mCherry+) LSK cells (CD45.2) co-transduced with FOXO3a-eGFP and mFancd2 WT-mCherry or mFancd2 K559R-mCherry or empty-mCherry lentivirus, along with 4 × 10⁵ recipient BM cells (CD45.1) were transplanted into lethally irradiated recipient mice. The repopulating capacity of donor HSCs was monitored by measuring percentage of GFP positive cells in the peripheral blood of the transplant recipients at 4 months post-transplantation (F). The percentage of GFP-positive LSK cells in the BM of the transplant recipients was determined at 4 months post-transplantation (G). **, p < 0.01; ***, p < 0.001; ****, p < 0.0001.

References

    1. Wilson A., Trumpp A. (2006) Bone-marrow hematopoietic-stem-cell niches. Nat. Rev. Immunol. 6, 93–106 - PubMed
    1. Orford K. W., Scadden D. T. (2008) Deconstructing stem cell self-renewal: genetic insights into cell-cycle regulation. Nat. Rev. Genet. 9, 115–128 - PubMed
    1. Orkin S. H., Zon L. I. (2008) Hematopoiesis: an evolving paradigm for stem cell biology. Cell 132, 631–644 - PMC - PubMed
    1. Wilson A., Laurenti E., Oser G., van der Wath R. C., Blanco-Bose W., Jaworski M., Offner S., Dunant C. F., Eshkind L., Bockamp E., Lió P., Macdonald H. R., Trumpp A. (2008) Hematopoietic stem cells reversibly switch from dormancy to self-renewal during homeostasis and repair. Cell 135, 1118–1129 - PubMed
    1. Parmar K., Kim J., Sykes S. M., Shimamura A., Stuckert P., Zhu K., Hamilton A., Deloach M. K., Kutok J. L., Akashi K., Gilliland D. G., D'Andrea A. (2010) Hematopoietic stem cell defects in mice with deficiency of Fancd2 or Usp1. Stem Cells 28, 1186–1195 - PMC - PubMed

Publication types

MeSH terms

Substances