. 2014 Dec 10;34(50):16581-93.
doi: 10.1523/JNEUROSCI.2319-14.2014.

Odorant concentration differentiator for intermittent olfactory signals

Affiliations

Odorant concentration differentiator for intermittent olfactory signals

Terufumi Fujiwara et al. J Neurosci. .

Abstract

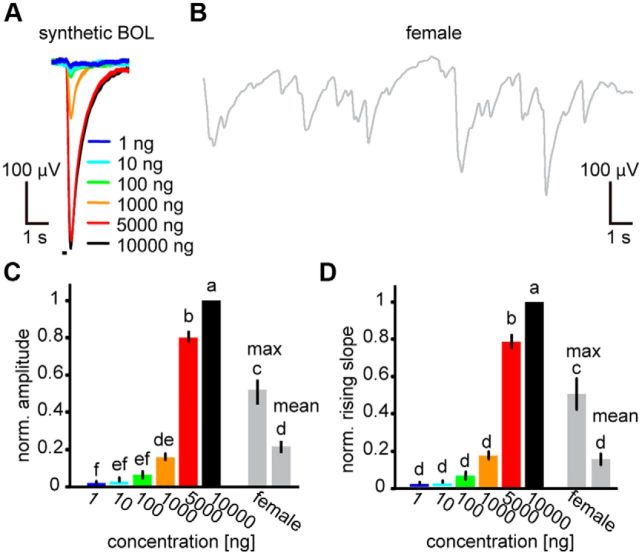
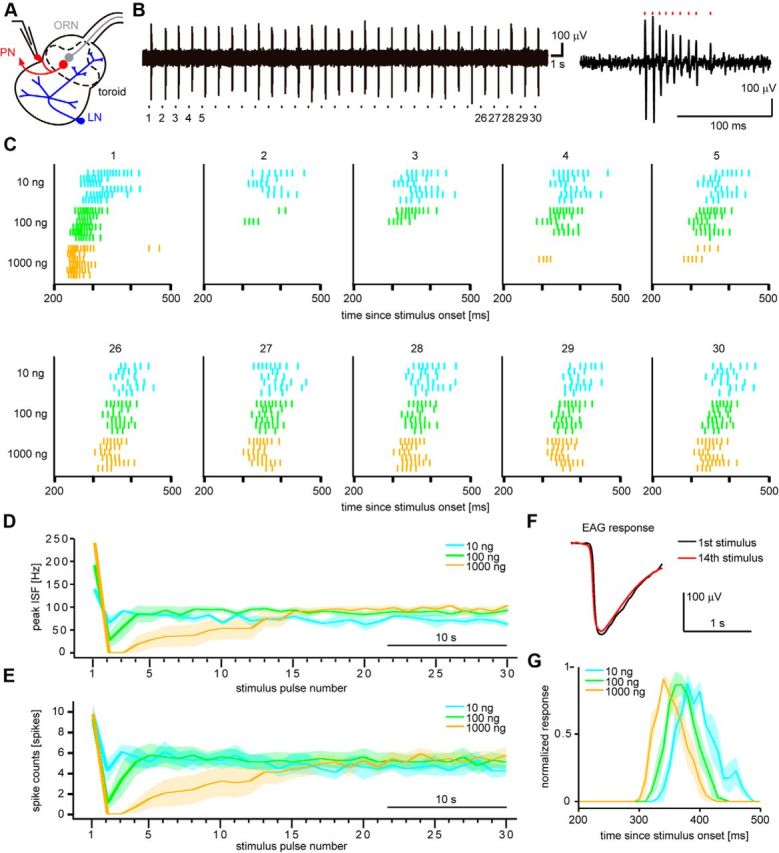
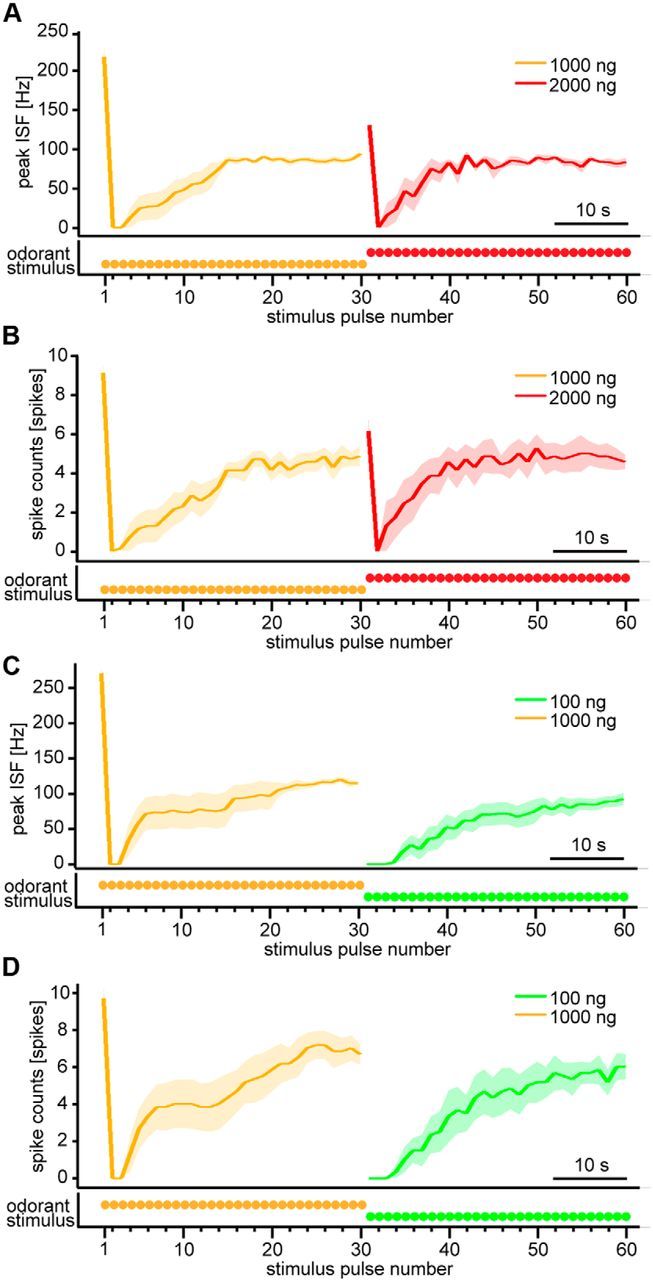
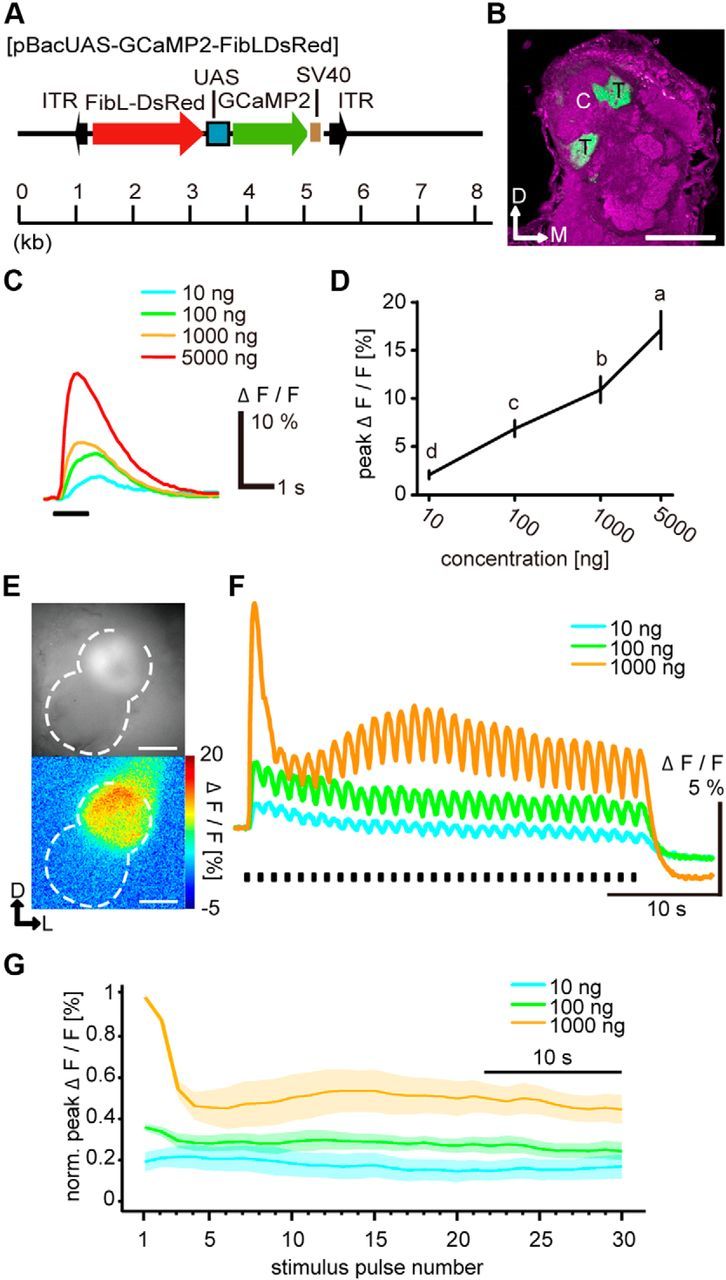
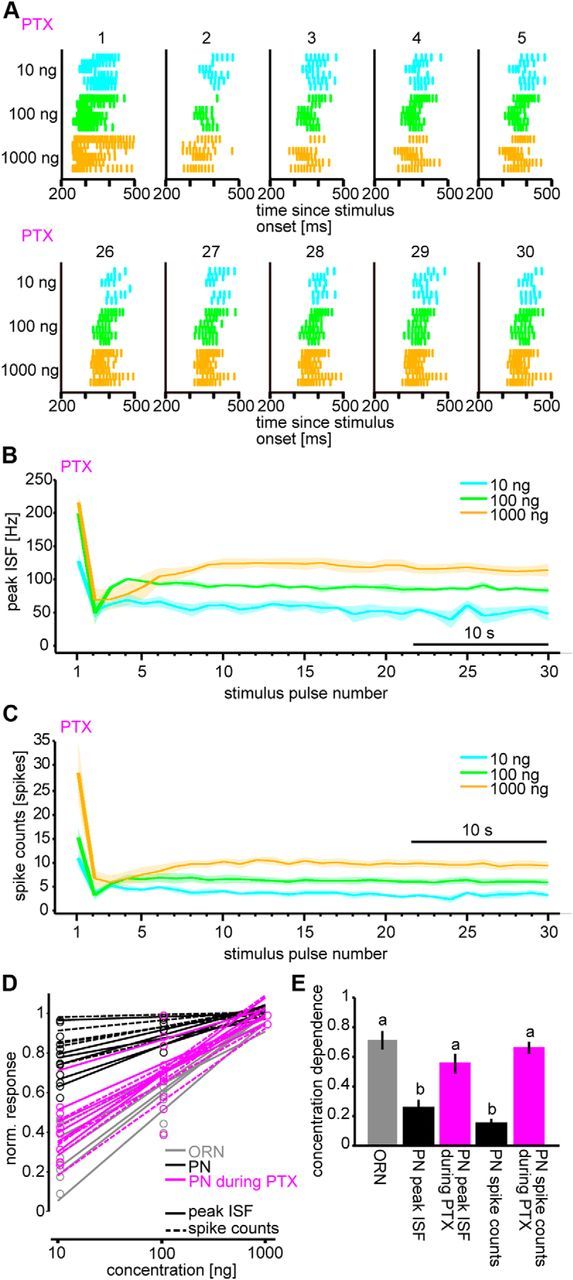
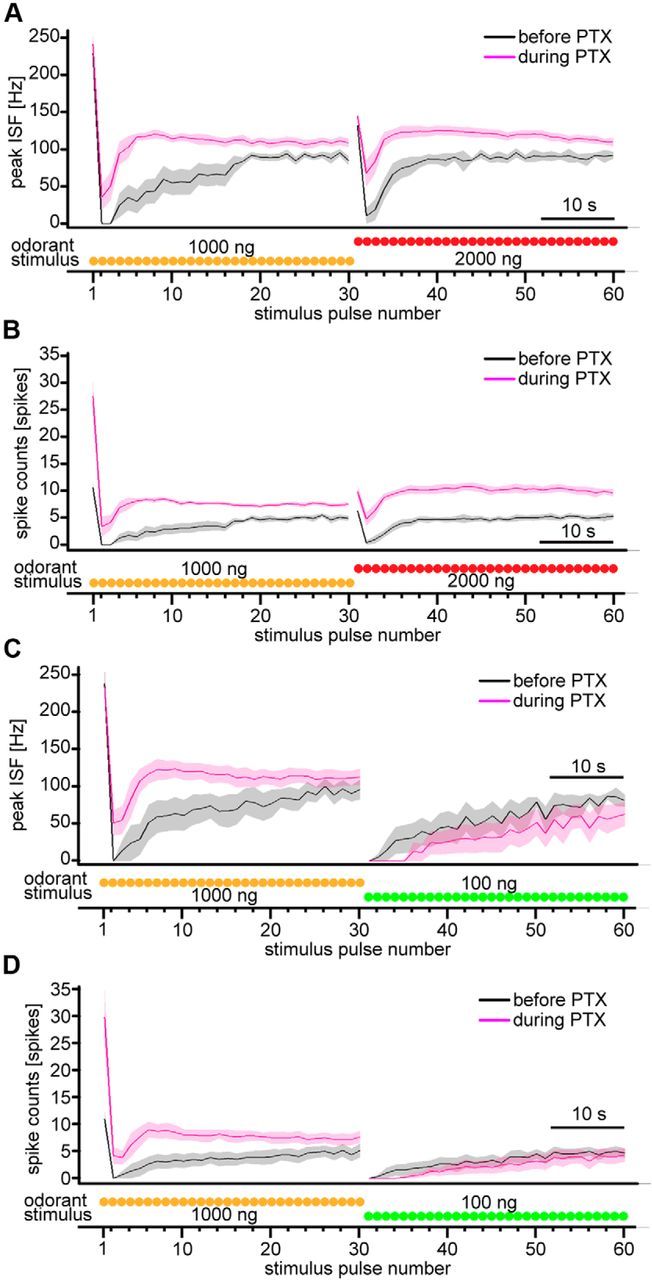
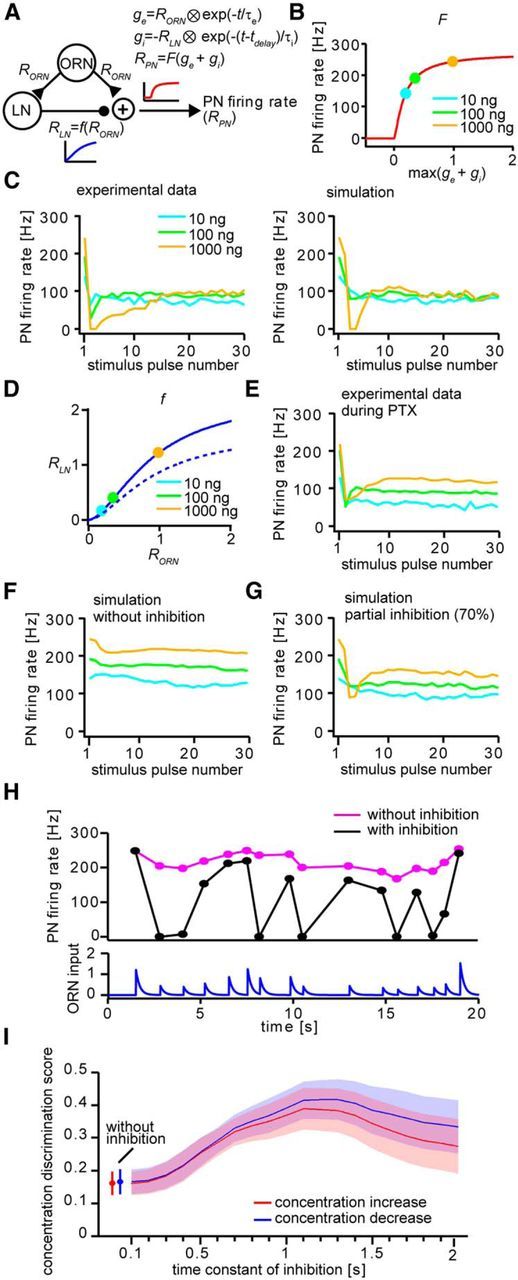
Animals need to discriminate differences in spatiotemporally distributed sensory signals in terms of quality as well as quantity for generating adaptive behavior. Olfactory signals characterized by odor identity and concentration are intermittently distributed in the environment. From these intervals of stimulation, animals process odorant concentration to localize partners or food sources. Although concentration-response characteristics in olfactory neurons have traditionally been investigated using single stimulus pulses, their behavior under intermittent stimulus regimens remains largely elusive. Using the silkmoth (Bombyx mori) pheromone processing system, a simple and behaviorally well-defined model for olfaction, we investigated the neuronal representation of odorant concentration upon intermittent stimulation in the naturally occurring range. To the first stimulus in a series, the responses of antennal lobe (AL) projection neurons (PNs) showed a concentration dependence as previously shown in many olfactory systems. However, PN response amplitudes dynamically changed upon exposure to intermittent stimuli of the same odorant concentration and settled to a constant, largely concentration-independent level. As a result, PN responses emphasized odorant concentration changes rather than encoding absolute concentration in pulse trains of stimuli. Olfactory receptor neurons did not contribute to this response transformation which was due to long-lasting inhibition affecting PNs in the AL. Simulations confirmed that inhibition also provides advantages when stimuli have naturalistic properties. The primary olfactory center thus functions as an odorant concentration differentiator to efficiently detect concentration changes, thereby improving odorant source orientation over a wide concentration range.

Keywords: adaptation; insect; olfaction; sensory intensity.


Figures

Figure 1.
Figure 1.
EAG responses to synthetic bombykol and females emitting pheromones. A, EAG responses to synthetic bombykol pulses of different odorant concentrations and 200 ms duration. B, EAG response from the same antenna as in A to pheromones emitted by a female in a wind tunnel. C, D, Normalized EAG amplitudes (C) and rising slopes (D) of responses to synthetic bombykol and pheromones emitted by females. For pheromones emitted by females, maximum and mean responses of the single EAG components are shown (one-way repeated-measures ANOVA): for amplitudes, F(7,7) = 170.28, p < 0.001; for rising slopes, F(7,7) = 119.00, p < 0.001. p < 0.05, significant differences indicated by different letters associated with the data groups (Tukey–Kramer test). Data are means; error bars indicate SEM; n = 8.
Figure 2.
Figure 2.
PN responses to intermittent bombykol stimuli. A, Schematic diagram of the antennal lobe of the male silkmoth showing bombykol-responsive ORNs (gray), bombykol-responsive PNs (red), and local interneurons (LNs, blue). Dashed line indicates the toroid glomerulus processing bombykol information. Loose-patch recording was performed at PN somata. B, Representative example of PN responses to 10 ng bombykol intermittent stimuli (left). Stimulus pulse numbers corresponding to the raster plots in C are indicated under the recording trace. The response to the first stimulus pulse is shown in the rightmost panel. Red markers indicate the occurrences of spikes. The stimulus duration of the pheromone pulses was 200 ms at 1.2 s period. C, Raster plots of PN responses to the first to fifth stimulus pulses (top) and to the 26th to 30th pulses (bottom) (n = 6). D, E, Dynamics of average peak ISF (D) and average spike counts (E) of PN responses (n = 6). F, Representative example of EAG responses to the first stimulus pulse (black) and to the 14th stimulus pulse (red) of a series of 1000 ng bombykol pulses. To prevent adaptation, antennae were covered by a slide glass between the two recordings while stimuli were continuously delivered at 1.2 s interval. G, Peristimulus time histograms (10 ms bins) of PN responses in the settled state (n = 6). Responses to last 10 stimuli were averaged and normalized for each concentration within preparations. Shaded areas represent SEM.
Figure 3.
Figure 3.
PN responses to intermittent bombykol stimuli upon odorant concentration changes in pulse trains. A, B, Dynamics of average peak ISF (A) and average spike counts (B) of PN responses with odorant concentration increase (n = 7). Odorant concentration was increased from 1000 to 2000 ng after the 30th stimulus pulse. C, D, Dynamics of peak ISF (C) and spike counts (D) of PN responses with odorant concentration decrease (n = 6). Odorant concentration was decreased from 1000 to 100 ng after the 30th stimulus pulse. The stimulus duration of the pheromone pulses was 200 ms at 1.2 s period. Traces below the figures represent stimulus timing and odorant concentration schematically. Shaded areas represent SEM of the responses.
Figure 4.
Figure 4.
ORN responses to intermittent bombykol stimuli. A, Schematic diagrams of the piggyBac vector, pBacUAS-GCaMP2, used to generate UAS-GCaMP2. FibL-DsRed indicates a screening marker that drives DsRed expression in silk glands. ITR, Inverted terminal repeats of the piggyBac transposon; SV40, SV40 polyadenylation signal. B, Representative confocal image of the AL of a BmOR1-GAL4/UAS-GCaMP2 male moth. The axon terminals of bombykol receptor neurons expressing GCaMP (green) were localized in the toroid. Background staining was performed with an anti-synaptotagmin antibody to visualize neuropil structures (magenta). Representative confocal sections are shown. C, Cumulus; T, toroid; D, dorsal; M, medial. Scale bar, 100 μm. C, Representative GCaMP-expressing neuronal responses to single-pulse bombykol stimulus. Stimulus duration was 1 s. D, Concentration–response characteristics of GCaMP-expressing neurons to single-pulse bombykol stimulus (one-way repeated-measures ANOVA, F(3,5) = 48.33, p < 0.001) followed by Tukey–Kramer test (p < 0.05 for significant differences indicated by different letters associated with the data groups. Data are means. Error bars indicate SEM; n = 6. E, Fluorescence images of the terminal axonal arborization of GCaMP-expressing ORNs (top, averaged for 10 baseline frames) and their responses to 1000 ng bombykol in false colors (bottom). Dashed line indicates the outline of the AL. D, Dorsal; L, lateral. Scale bar, 100 μm. F, Representative time courses of ORN responses to intermittent bombykol stimuli. The stimulus duration of bombykol pulses was 200 ms at 1.2 s period. G, Dynamics of average normalized peak amplitudes of ORN responses (n = 6). Shaded areas represent SEM of the peak amplitudes.
Figure 5.
Figure 5.
Responses of PNs to intermittent bombykol stimuli under GABAA receptor blockage with PTX. A, Raster plots of PN responses to the first through fifth stimulus pulses (top) and to the 26th through 30th pulses (bottom) during application of PTX (n = 6). B, C, Dynamics of average peak ISF (B) and average spike counts (C) in PN responses during application of PTX (n = 6; shaded areas represent SEM). D, Linear fits of normalized ORN responses from imaging data (gray) and normalized PN responses described by peak ISF (solid line) and spike counts (dashed line) before (black) and during application of PTX (magenta). The normalized responses calculated from average settled response levels to last 10 stimulus pulses at each odorant concentration are shown as circles. Values were normalized within each set of odorant concentrations for each parameter and pharmacological condition. E, Odorant concentration dependencies corresponding to the slopes of fitted curves in D. p < 0.05, significant differences indicated by different letters associated with the data groups (one-way ANOVA followed by Tukey–Kramer test). n = 6; data are mean ± SEM.
Figure 6.
Figure 6.
PN responses to intermittent bombykol stimuli upon odorant concentration change in pulse trains and the effect of GABAAR blockade with PTX. A, B, Dynamics of average peak ISF (A) and average spike counts (B) of PN responses with odorant concentration increase before (black) and during (magenta) application of PTX (n = 8; shaded areas represent SEM). Odorant concentration was increased from 1000 to 2000 ng after the 30th stimulus pulse. C, D, Dynamics of average peak ISF (C) and average spike counts (D) of PN responses with odorant concentration decrease before (black) and during (magenta) application of PTX (n = 6; shaded areas represent SEM). Odorant concentration was decreased from 1000 to 100 ng after the 30th stimulus pulse. Traces below the figures represent stimulus timing and odorant concentration schematically.
Figure 7.
Figure 7.
Simulation of PN responses. A, Schematic diagram of the model. RORN, RLN, and RPN, Response amplitudes of ORN, LN, and PN, respectively; ge, excitatory synaptic conductance of LN and PN activated by ORN input; gi, inhibitory synaptic conductance of PN activated by LN; τe and τi, time constants of excitatory and inhibitory conductances; tdelay, onset delay of inhibitory conductance; t, time; F, transfer function of PN from synaptic conductance to firing rate (shown in B); f, transfer function to determine LN response amplitude (shown in D). B, Transfer function of PN from synaptic conductance to firing rate. Markers indicate the corresponding odorant concentrations used in the actual experiments at gi = 0. max(ge + gi), the local maximum of ge + gi for a stimulus. C, PN responses in the actual experiment (left, same as Fig. 2D) and fitted PN responses in the simulation (right) to intermittent odorant stimuli. D, Transfer function to determine LN response amplitude (solid curve). Markers indicate the corresponding odorant concentrations used in the actual experiments. The transfer function for partial inhibition (dashed curve, corresponding to the result shown in G) was generated by decreasing the maximum amplitude (RLNmax) by 30%. E, Electrophysiologically recorded PN responses to intermittent odorant stimuli during application of PTX in the actual experiment to intermittent odorant stimuli (same as Fig. 5B). F, Simulated PN responses in the simulation to intermittent odorant stimuli without inhibition. G, Simulated PN responses in the simulation to intermittent odorant stimuli with partial inhibition (70%). H, Representative simulated PN responses to naturalistic odorant stimuli with (black) and without (magenta) inhibition. Traces below the figures show the time course of ORN input to the PN and LN. I, Effect of inhibition time constant on odorant discrimination performance. Shown are average odorant concentration discrimination scores (error bars or shaded areas represent SEM; n = 8) for concentration increase (red) and decrease (blue) for inhibition time constants in the range of 0.1–2 s.

Similar articles

Cited by

References

    1. Asahina K, Louis M, Piccinotti S, Vosshall LB. A circuit supporting concentration-invariant odor perception in Drosophila. J Biol. 2009;8:9. doi: 10.1186/jbiol108. - DOI - PMC - PubMed
    1. Baker TC, Roelofs WL. Initiation and termination of oriental fruit moth male response to pheromone concentrations in the field. Environ Entomol. 1981;10:211–218.
    1. Baker TC, Willis MA, Haynes KF, Phelan PL. A pulsed cloud of sex-pheromone elicits upwind flight in male moths. Physiol Entomol. 1985;10:257–265. doi: 10.1111/j.1365-3032.1985.tb00045.x. - DOI
    1. Barbour DL. Intensity-invariant coding in the auditory system. Neurosci Biobehav Rev. 2011;35:2064–2072. doi: 10.1016/j.neubiorev.2011.04.009. - DOI - PMC - PubMed
    1. Bathellier B, Buhl DL, Accolla R, Carleton A. Dynamic ensemble odor coding in the mammalian olfactory bulb: sensory information at different timescales. Neuron. 2008;57:586–598. doi: 10.1016/j.neuron.2008.02.011. - DOI - PubMed

Publication types

LinkOut - more resources