. 2014 Dec 10;34(50):16671-87.
doi: 10.1523/JNEUROSCI.0584-14.2014.

Preictal activity of subicular, CA1, and dentate gyrus principal neurons in the dorsal hippocampus before spontaneous seizures in a rat model of temporal lobe epilepsy

Affiliations

Preictal activity of subicular, CA1, and dentate gyrus principal neurons in the dorsal hippocampus before spontaneous seizures in a rat model of temporal lobe epilepsy

Satoshi Fujita et al. J Neurosci. .

Abstract

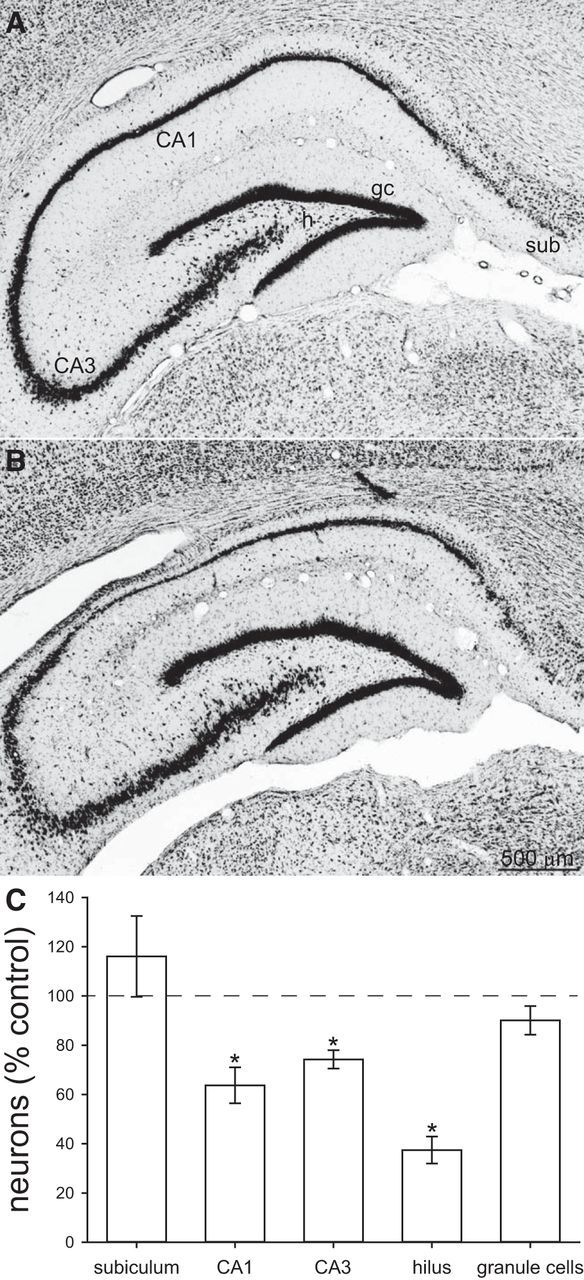
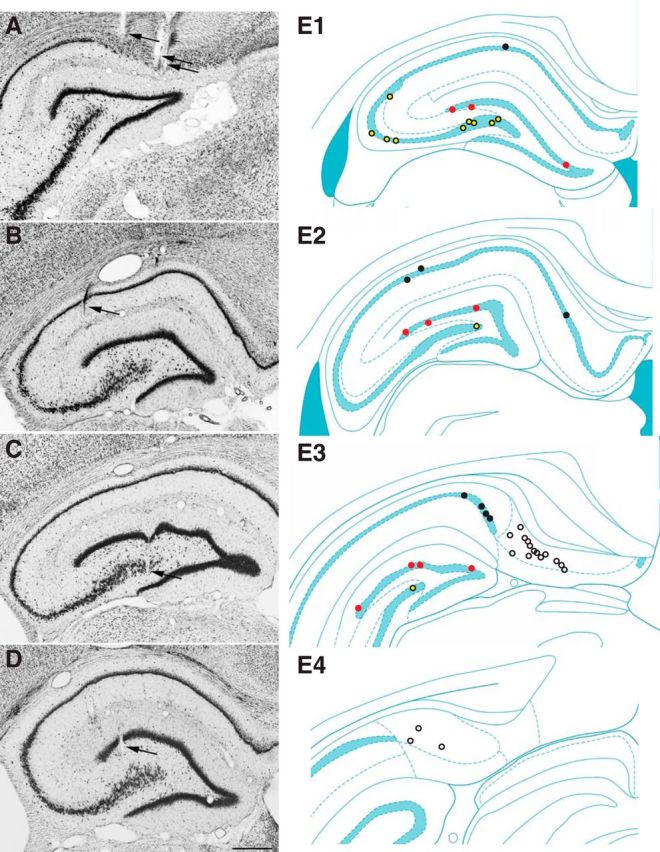
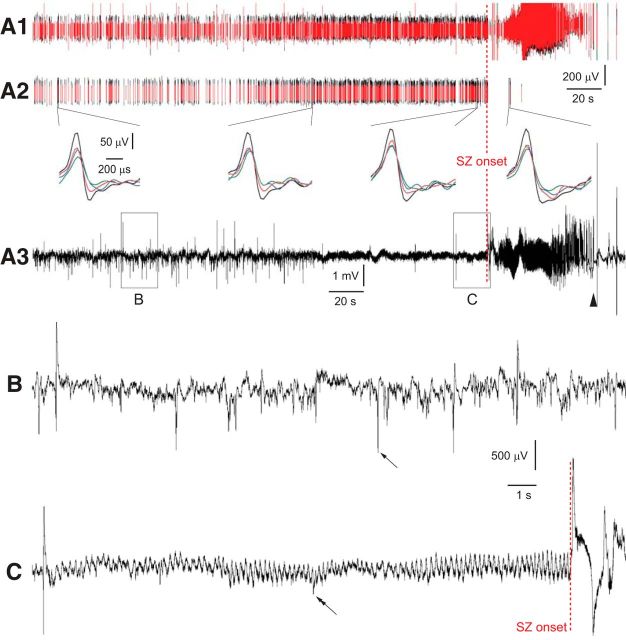
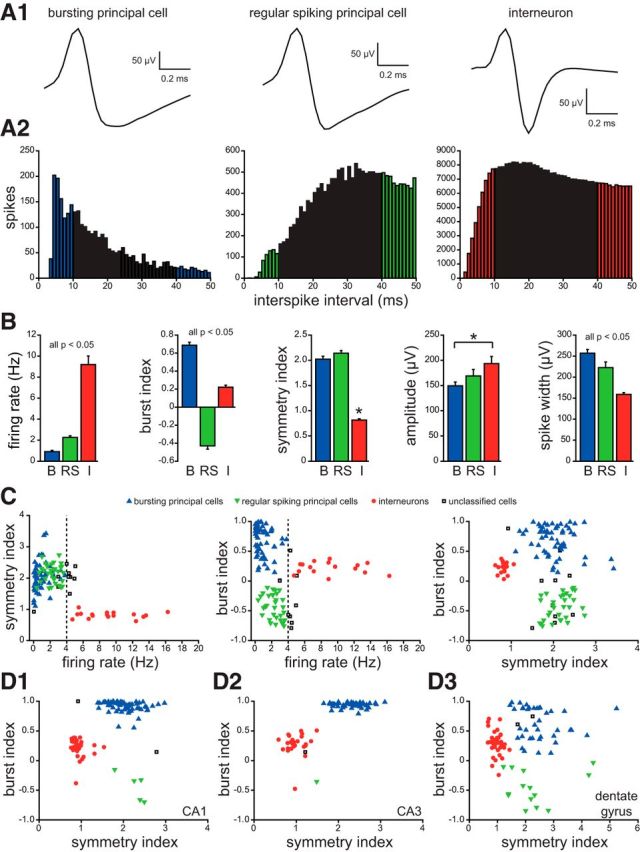
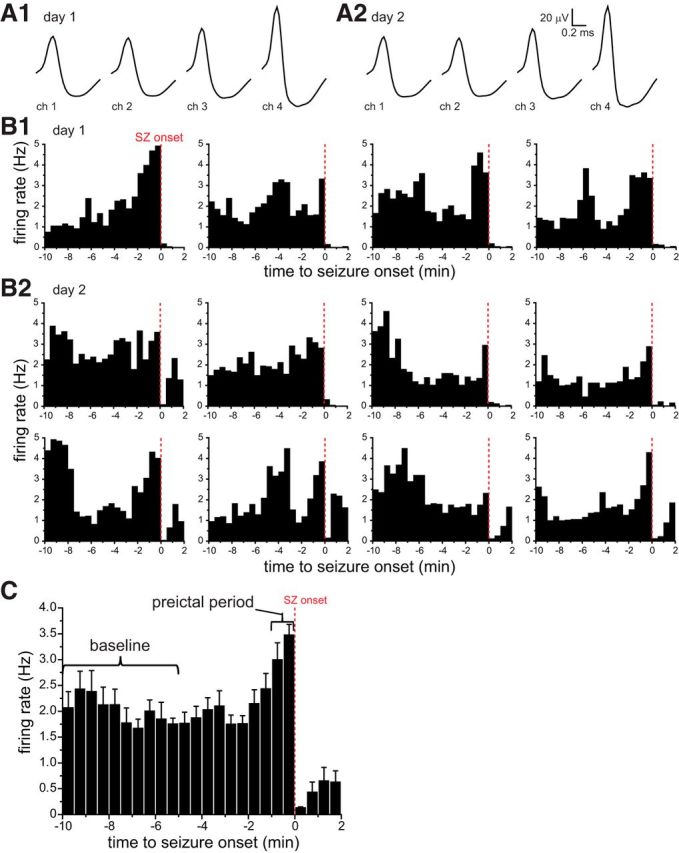
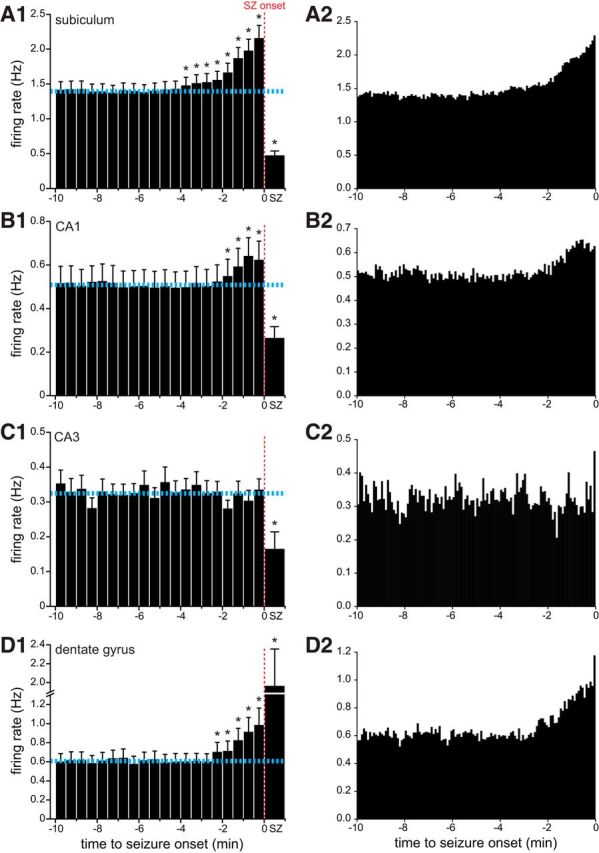
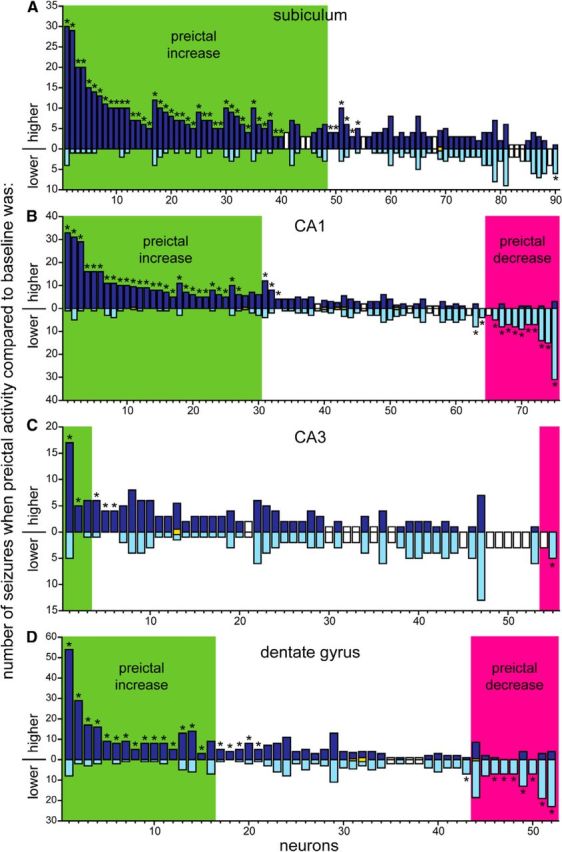
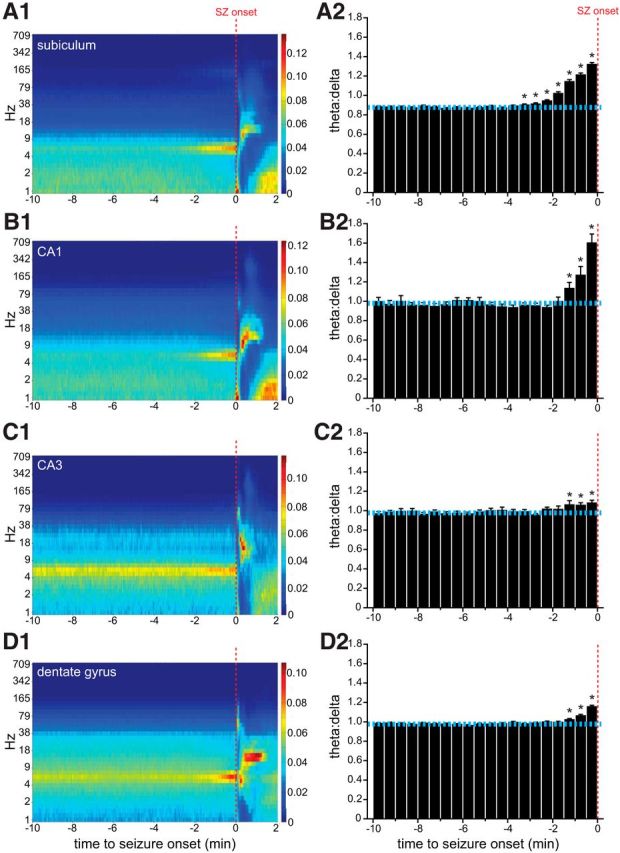
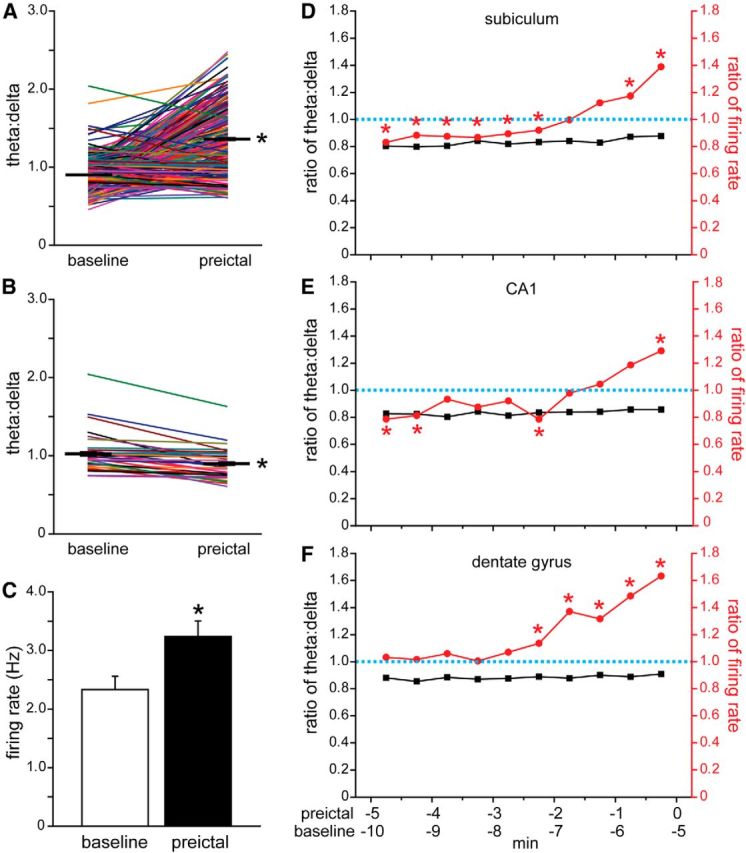
Previous studies suggest that spontaneous seizures in patients with temporal lobe epilepsy might be preceded by increased action potential firing of hippocampal neurons. Preictal activity is potentially important because it might provide new opportunities for predicting when a seizure is about to occur and insight into how spontaneous seizures are generated. We evaluated local field potentials and unit activity of single, putative excitatory neurons in the subiculum, CA1, CA3, and dentate gyrus of the dorsal hippocampus in epileptic pilocarpine-treated rats as they experienced spontaneous seizures. Average action potential firing rates of neurons in the subiculum, CA1, and dentate gyrus, but not CA3, increased significantly and progressively beginning 2-4 min before locally recorded spontaneous seizures. In the subiculum, CA1, and dentate gyrus, but not CA3, 41-57% of neurons displayed increased preictal activity with significant consistency across multiple seizures. Much of the increased preictal firing of neurons in the subiculum and CA1 correlated with preictal theta activity, whereas preictal firing of neurons in the dentate gyrus was independent of theta. In addition, some CA1 and dentate gyrus neurons displayed reduced firing rates preictally. These results reveal that different hippocampal subregions exhibit differences in the extent and potential underlying mechanisms of preictal activity. The finding of robust and significantly consistent preictal activity of subicular, CA1, and dentate neurons in the dorsal hippocampus, despite the likelihood that many seizures initiated in other brain regions, suggests the existence of a broader neuronal network whose activity changes minutes before spontaneous seizures initiate.

Keywords: hippocampus; subiculum; unit recording.


Figures

Figure 1.
Figure 1.
Nissl-stained hippocampi from a control (A) and epileptic pilocarpine-treated (B) rat. sub, Subiculum; h, hilus; gc, granule cells. C, Number of neurons in the subiculum, CA1 cell layer, CA3 cell layer, hilus, and granule cell layer of the dorsal hippocampus. Values represent mean ± SEM of epileptic rats (n = 13) relative to average values of controls (n = 4). *p < 0.05, two-tailed t test.
Figure 2.
Figure 2.
Recording sites. Tetrode track (arrows) localization in the subiculum (A), CA1 (B), CA3 (C), and dentate gyrus (D) in Nissl-stained coronal sections. E, Recording sites in the subiculum (white markers), CA1 (black), CA3 (yellow), and dentate gyrus (red) at rostral (E1) to caudal (E4) levels. Hippocampal schematic diagrams from Paxinos and Watson (2009). Scale bar, 500 μm.
Figure 3.
Figure 3.
Unit and LFP recording from the subiculum before and during a spontaneous seizure in an epileptic pilocarpine-treated rat. Multiunit (A1), sorted single-unit (A2), and LFP (A3) recordings. Lines in A1 and A2 are time-compressed 1-ms-duration waveforms of events that surpassed an amplitude threshold. Four colors, one for each tetrode channel, are included, but red and black are most evident. Apparent lack of single-unit activity during the seizure (SZ) is likely an artifact (see Results). Insets show single action potentials recorded by four channels (different colors) of a tetrode at three time points before the seizure and one during the seizure. The abrupt ending of large amplitude field potentials, which signify the seizure offset, is indicated by an arrowhead. Boxed regions in the LFP (A3) are non-theta (B) and preictal theta (C) periods that are shown at higher resolution below. Note the amplitude difference between electrographic spikes (arrow in B) and action potential spikes (double arrow in C). Up is negative in A1 and A2. Up is positive in A3, B, and C.
Figure 4.
Figure 4.
Subicular units classified as bursting principal cells, regular spiking principal cells, or interneurons. A1, Average waveforms of typical examples of each. A2, Autocorrelograms of same cells as in A1. Colored bars indicate parts used to calculate burst index. B, Baseline firing rate, burst index, symmetry index, spike amplitude, and spike width group data from bursting principal cells (B), regular spiking principal cells (RS), and interneurons (I). Burst index is the peak measured from 0 to 10 ms (colored bars in A2) minus mean baseline value measured from 40 to 50 ms (colored bars in A2). The resulting value was normalized to the peak if positive or to the baseline if negative, which yielded burst indices ranging from −1 (tonic firing) to 1 (bursting). Symmetry index is the ratio of waveform peak/valley. Amplitude and spike width were measured from waveform peak to valley. Values indicate mean ± SEM. *p < 0.05, ANOVA with Dunn's test. C, Plots of symmetry index, baseline firing rate, and burst index, which were used for neuron classification. A firing rate of 4 Hz was a defining feature. Units that did not clearly fit into a category were unclassified and omitted from additional analysis. D, Plots of burst index versus symmetry index of cells in CA1 (D1), CA3 (D2), and dentate gyrus (D3).
Figure 5.
Figure 5.
Preictal activity of a bursting subicular neuron that was recorded during 12 seizures over 2 d. Waveforms (A1, A2) and PETHs (B1, B2) of four seizures on 1 d (A1, B1) and eight seizures on the next day (A2, B2). The tetrode was not moved between days. On the first and second days, waveforms (A1, A2), baseline firing rates (1.8 and 2.1 Hz, respectively), symmetry indices (2.3 and 2.4), and burst indices (0.93 and 0.83) were similar. C, Average PETH of all 12 seizures for this unit. Error bars indicate SEM. Preictal activity classification was based on comparing average firing rate during the baseline period (10–5 min before seizure onset) with that of the preictal period (last minute before seizure onset). Apparent reduced firing rates during seizures are likely an artifact because of limits of recording and sorting single-unit activity during periods of high activity (see Results). ch, Channel; SZ, seizure.
Figure 6.
Figure 6.
Average preictal activity of subicular (A), CA1 (B), CA3 (C), and dentate gyrus (D) principal neurons (n = 90, 75, 55, and 52, respectively). A1–D1, Dashed horizontal cyan lines indicate average baseline firing rate. Error bars indicate SEM. * indicates >3 or <3 SDs from the baseline firing rate, which was the average during the 10–5 min period before seizure onset. Bin size was 30 s, except seizure (SZ) bins, which represent average firing rate during the entire seizure duration. Apparent reduced firing rates during seizures are likely an artifact because of limits of recording and sorting single-unit activity during periods of high activity (see Results). A2–D2, 5 s bins.
Figure 7.
Figure 7.
Number of subicular (A), CA1 (B), CA3 (C), and dentate gyrus (D) principal neurons classified as preictal-increase, unchanged, or preictal-decrease. In these plots, each bar represents a single neuron and indicates the number of seizures when its firing rate during the last minute before seizure onset was greater than the average baseline firing rate for that seizure (upward, dark blue part of bar) and the number of seizures when its preictal firing rate was less than baseline (downward light blue part of bar). For example, the first neuron in the subiculum was recorded during 34 seizures, 30 of which had higher preictal than baseline firing rates and four with lower preictal than baseline firing rates. Green and magenta shading indicate neurons classified as preictal-increase or preictal-decrease, respectively, depending on whether the preictal firing rate was >3 or <3 SDs from the baseline averaged across all seizures for that neuron. * indicates neurons with significantly consistent higher or lower preictal activity based on a scrambling test. Yellow bars centered on the 0-axis indicate rare cases when preictal and baseline firing rates were equal. White bars depict neurons for which the scrambling test could not be performed, because firing rate variability was too high for the number of seizures recorded.
Figure 8.
Figure 8.
Theta activity increases preictally. Spectrograms (left column) and PETHs of average theta/delta ratios (right column) of seizures (SZ) recorded in the subiculum (A), CA1 (B), CA3 (C), and dentate gyrus (D) (n = 401, 26, 94, and 269 seizures, respectively). Spectrogram color indicates normalized power. In histograms, dashed horizontal cyan lines indicate average baseline theta/delta ratios. Error bars indicate SEM. * indicates >3 SDs from the average theta/delta ratio during the baseline period (10–5 min before seizure onset).
Figure 9.
Figure 9.
Some increased preictal firing is not correlated with theta activity. A, Theta/delta ratios of all seizures during which subicular neurons with increased preictal activity were recorded. Data from individual seizures are indicated by colored lines. Thick black horizontal lines with error bars (which are small) represent average theta/delta ratios 5.5–5.0 min (baseline) and 0.5–0 min before onset (preictal). *p < 0.001, Wilcoxon's signed-rank test. B, Seizures in which theta/delta ratios increased from baseline to preictal periods were excluded, leaving only those in which theta/delta ratios were unchanged or decreased preictally. *p < 0.001. C, Average firing rates of subicular neurons 5.5–5.0 min (baseline) and 0.5–0 min before onset (preictal) recorded during seizures without preictal theta (B). Values represent mean ± SEM. *p < 0.001. Average action potential firing rates increased preictally during seizures without preictal theta activity in the subiculum (D), CA1 (E), and dentate gyrus (F). D, The right-most marker in the theta/delta plot was calculated by dividing the average theta/delta ratio during the preictal period by that of the baseline period (values in B). Similarly, the right-most marker in the firing rate plot was calculated by dividing the preictal by the baseline average firing rate (values in C). The next set of markers to the left in D represent values calculated identically, expect the baseline period was 6.0–5.5 min and the preictal period was 1.0–0.5 min before seizure onset, and so on. * indicates significantly higher average preictal versus baseline firing rates, as shown, for example in C (p < 0.05, Wilcoxon's signed-rank test). All average preictal theta/delta ratios were significantly lower than baseline (p < 0.05, Wilcoxon's signed-rank test), as expected, because seizures with preictal theta were excluded.

References

    1. Alme CB, Buzzetti RA, Marrone DF, Leutgeb JK, Chawla MK, Schaner MJ, Bohanick JD, Khoboko T, Leutgeb S, Moser EI, Moser MB, McNaughton BL, Barnes CA. Hippocampal granule cells opt for early retirement. Hippocampus. 2010;20:1109–1123. doi: 10.1002/hipo.20810. - DOI - PubMed
    1. Alonso-Nanclares L, Kastanauskaite A, Rodriguez JR, Gonzalez-Soriano J, Defelipe J. A stereological study of synapse number in the epileptic human hippocampus. Front Neuroanat. 2011;5:8. doi: 10.3389/fnana.2011.00008. - DOI - PMC - PubMed
    1. Anderson MI, O'Mara SM. Analysis of recordings of single-unit firing and population activity in the dorsal subiculum of unrestrained, freely moving rats. J Neurophysiol. 2003;90:655–665. doi: 10.1152/jn.00723.2002. - DOI - PubMed
    1. Avoli M, Barbarosie M, Lücke A, Nagao T, Lopantsev V, Köhling R. Synchronous GABA-mediated potentials and epileptiform discharges in the rat limbic system in vitro. J Neurosci. 1996;16:3912–3924. - PMC - PubMed
    1. Babb TL, Crandall PH. Epileptogenesis of human limbic neurons in psychomotor epileptics. Electroencephalogr Clin Neurophysiol. 1976;40:225–243. doi: 10.1016/0013-4694(76)90147-4. - DOI - PubMed

Publication types