. 2014 Dec 10;34(50):16698-712.
doi: 10.1523/JNEUROSCI.3888-14.2014.

Live imaging of endogenous PSD-95 using ENABLED: a conditional strategy to fluorescently label endogenous proteins

Affiliations

Live imaging of endogenous PSD-95 using ENABLED: a conditional strategy to fluorescently label endogenous proteins

Dale A Fortin et al. J Neurosci. .

Abstract

Stoichiometric labeling of endogenous synaptic proteins for high-contrast live-cell imaging in brain tissue remains challenging. Here, we describe a conditional mouse genetic strategy termed endogenous labeling via exon duplication (ENABLED), which can be used to fluorescently label endogenous proteins with near ideal properties in all neurons, a sparse subset of neurons, or specific neuronal subtypes. We used this method to label the postsynaptic density protein PSD-95 with mVenus without overexpression side effects. We demonstrated that mVenus-tagged PSD-95 is functionally equivalent to wild-type PSD-95 and that PSD-95 is present in nearly all dendritic spines in CA1 neurons. Within spines, while PSD-95 exhibited low mobility under basal conditions, its levels could be regulated by chronic changes in neuronal activity. Notably, labeled PSD-95 also allowed us to visualize and unambiguously examine otherwise-unidentifiable excitatory shaft synapses in aspiny neurons, such as parvalbumin-positive interneurons and dopaminergic neurons. Our results demonstrate that the ENABLED strategy provides a valuable new approach to study the dynamics of endogenous synaptic proteins in vivo.

Keywords: PSD-95; cell-type-specific labeling; conditional knock-in; live imaging; protein labeling; sparse labeling.


Figures

Figure 1.
Figure 1.
The ENABLED strategy to fluorescently label endogenous PSD-95. A, Schematic illustration of the genetic strategy for creating the PSD-95-ENABLED and PSD-95-CreNABLED mouse lines. The Neo cassette was removed by crossing the PSD-95-ENABLED-Neo mouse to the FLPeR mouse. Subsequent Cre recombination resulted in the PSD-95-CreNABLED genotype with PSD-95mVenus being expressed under endogenous transcriptional and translational controls. B, Genotyping results from wild-type (WT), heterozygous (HE), and homozygous (HO) mice for PSD-95-ENABLED and PSD-95-CreENABLED mouse lines. C, Representative images of PSD-95 labeling (green) in all neurons (C1C3), a random sparse subset (C4C6), and specific neuronal subtypes (C7C9; using the DAT-Cre driver line). Magenta shows tdTomato signal resulting from Cre-dependent recombination of the Ai9 allele. For C7 and C8, fluorescent images were overlaid on the corresponding wide-field images to reveal the slice morphology. Only tdTomato fluorescence is shown in C4, C5, C7, and C8 because under a macroscope, the autofluorescence of fixed samples overwhelmed the green PSD-95mVenus fluorescence in sparsely labeled samples. Note that in C8, neurons in VTA and SNc but not the adjacent medial terminal nucleus (MT) were labeled. D, Representative image and quantification of immunogold EM using an anti-GFP antibody (Abcam, no. ab13970). Data were analyzed from 19 spines in five independent fields-of-view on ultrathin sections prepared from a mouse brain.
Figure 2.
Figure 2.
PSD-95mVenus expression in global and sparse CreNABLED brain slices. A, Macroscopic images of sagittal brain sections of the indicated genotypes. Green fluorescence is shown in grayscale. Zoom-in images for the global CreNABLED brain section are shown to the right (A3aA3d). B, Two-photon images from global PSD-95-CreNABLED mice. GL, Granule cell layer; PC, Purkinje cell layer; ML, molecular layer. Arrowheads indicate the pinceau structures. C, Representative two-photon images from acute brain slices prepared from PSD-95-ENALBED/Ai9 double-heterozygous mice that were in utero viral injected to express Cre in a sparse subset of neurons. L2/3, Cortical layer 2/3 pyramidal neuron, n = 8 mice; MSN, medium spiny neuron, n = 5; Purkinje, n = 6. Note that the low levels of green signal observed in neuronal soma and dendrites of the Purkinje neuron were due to bleedthrough from tdTomato because we made the contrast for green very high to see any possible mVenus fluorescence within individual spines. D, In vivo two-photon image of sparely labeled layer 2/3 pyramidal neuron. A side view of the imaged neuron and top views of the zoom-in dendrites are shown. Arrows indicate the approximate position where the zoom-in images were taken. E, A representative two-photon image from an acute brain slice showing two tdTomato positive dendrites in the stratum radiatum of the hippocampal CA1 region, one being positive for PSD-95mVenus, whereas the other was negative (arrows). F, The percentage of tdTomato positive neurons that were also positive for PSD-95mVenus. The brain region and neuronal types are indicated. Cre was introduced using either in utero viral infection or by crossing to the indicated Cre driver line. The quantification was done at P14–P21 for viral infected animals and at P30 for PV and dopaminergic neurons. Also, note that we rarely see systematic PSD-95mVenus fluorescence puncta outlining the shape of a dendrite or a neuron without tdTomato fluorescence, suggesting that nearly all PSD-95mVenus-positive neurons are also tdTomato-positive. Ctx, Cortex; hippo, hippocampus.
Figure 3.
Figure 3.
PSD-95-ENABLED and CreENABLED mice expressed normal LTP. A, Representative LTP experiment performed on a CA1 pyramidal neuron from a heterozygous PSD-95-CreNABLED mouse. LTP was induced using a pairing protocol (arrow). EPSC amplitudes and input resistances (Rm) are shown. Inset shows individual current traces before and after LTP induction indicated by the gray filled circles. B, Left, averaged LTP data for the indicated genotypes. Right, the percentage potentiation above baseline (averaged over last 10 min) is shown for individual experiments. C, Illustration of the experimental design in D. PSD-95mVenus (PSD-95mV) and DsRed Express were overexpressed in a sparse subset of neurons in PSD-95-CreNABLED homozygous mice using in utero electroporation. The epifluorescent DsRed Express image identifying the transfected neuron was overlaid on a Hoffman-modulated contrast image of the brain slice. Thus, the fluorescent neuron was electroporated to overexpress PSD-95mVenus. Untransfected neurons expressed PSD-95mVenus at endogenous levels via the ENABLED strategy (i.e., global CreNABLED). D, LTP measures from paired CA1 neurons expressing PSD-95mVenus at endogenous levels (black) or overexpressing PSD-95mVenus (red). Adjacent neurons were recorded sequentially from the same brain slices with alternating order; n = 6 slices from six animals. Only five pairs are shown on the right because one pair did not last all 40 min. * indicates statistically significant.
Figure 4.
Figure 4.
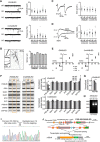
Characterizations of PSD-95-ENABLED and global CreNABLED mice. A, Representative traces and quantification of mEPSCs recorded from CA1 neurons in acute brain slices from the indicated genotypes (10–18 cells from 3–5 mice per genotype). B, Example images and quantification of spine density from CA1 hippocampal neurons labeled by DiOlistic DiI labeling; n = 15–18 cells from five to six mice for each genotype. C, Representative EPSC traces and quantified paired pulse ratios (PPR) from CA1 pyramidal neurons evoked by two stimuli with 70 ms interstimulus interval; n = 12–18 cells from four to six mice per genotype. D, Representative EPSC traces and quantification of AMPA/NMDA receptor component ratio from CA1 pyramidal neurons. AMPA and NMDA components were measured at the indicated times at holding potentials of −70 mV and +40 mV, respectively; n = 11–14 cells from three to six animals per genotype. E, Average I–V relationships for AMPAR-mediated EPSCs; n = 8–10 cells from three to six animals per genotype. Experiments were conducted in the presence of 25 μm D-APV. All data were normalized to the EPSC amplitude at −60 mV. F, Representative immunoblots (left) and quantification (right) of protein expression levels of indicated proteins from hippocampal lysates prepared from PSD-95-ENABLED and CreNABLED mice. Arrowhead indicates the primary PSD-95mVenus band. Actin and PSD-95 were probed from the same gel. Note that the two lower molecular weight bands in the PSD-95 blot were likely its partial degradation products or different splice isoforms because these bands also shifted to higher molecular weights in the PSD-95-CreNABLED homozygous sample in which all PSD-95 is labeled by mVenus. All bands were quantified for total PSD-95 levels. Orange boxes indicate the genotypes and their corresponding protein expression levels involved in our subsequent imaging experiments. G, qPCR quantification of PSD-95 mRNA levels using a pair of primers against exons 15 and 16 that are upstream of our genetic manipulations. Pattern coding of the bars are the same as in F. H, Nested RT-PCR using the primers indicated in J revealed that mVenus sequence is present in PSD-95 mRNA in the hippocampus of PSD-95-ENABLED mice. I, Sequencing result of the band shown in H indicating that there was splicing from 53 bp after the stop codon of the endogenous exon 20 to the duplicated exon 19. J, Schematic illustration of the unexpected splicing leading to an mRNA with a normal open reading frame but a modified 3′ UTR. This modification may explain the reduction of PSD-95 expression levels in PSD-95-ENABLED mice because 3′ UTR is known to be important for the mRNA trafficking and activity-dependent translation of PSD-95 (Muddashetty et al., 2011). The PCR primers used for H are also indicated. Note that our characterization cannot rule out the simultaneous production of wild-type mRNAs. * indicates statistically significant from wild-type.
Figure 5.
Figure 5.
Comparison of the neuronal properties between PSD-95-ENABLED and sparsely labeled CreNABLED neurons within the same brain slices. A, Illustration of the experimental design in BE. Cre were introduced into sparse subset of neurons in PSD-95-ENABLED/Ai9 double-heterozygous mice. The epifluorescent tdTomato image identifying the CreNABLED neurons was overlaid on a Hoffman-modulated contrast image of the brain slice. Adjacent PSD-95-ENABLED and CreNABLED neurons were sequentially recorded with alternating orders from individual brain slices to compare their synaptic properties. B, Representative evoked EPSC traces (left) and pooled AMPA/NMDA receptor ratios. AMPA and NMDA components were measured at the indicated times at holding potentials of −70 and 40 mV, respectively. The NMDA response was completely abolished in the presence of 25 μm D-APV (gray trace); n = 16 pairs from seven animals. C, Left to right, Representative traces, amplitudes, cumulative amplitude fractions, and frequencies of mEPSCs recorded from adjacent PSD-95-CreNABLED and ENABLED neurons; n = 8 pairs from three animals. D, Representative traces (left) and quantification (right) of paired pulse (70 ms interstimulus interval) EPSC traces recorded from adjacent PSD-95-CreNABLED and ENABLED CA1 pyramidal neurons (left); n = 16 pairs from seven animals. E, Averaged LTP data (left) and the percentage potentiation above baseline (right, averaged over last 10 min) measured from adjacent PSD-95-CreNABLED (open circles) and ENABLED (closed circles) CA1 pyramidal neurons. Pairs were recorded sequentially from the same brain slices in alternating order; n = 6 pairs from five animals.
Figure 6.
Figure 6.
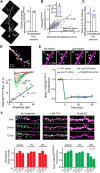
Subcellular distribution and dynamics of endogenous PSD-95 in pyramidal neurons. A, Image of a representative CA1 hippocampal neuron labeled using in utero viral infection (left) and the percentage of analyzed spines with detectable levels of PSD-95mVenus fluorescence (right). Asterisks indicate the dendrites that were imaged and analyzed in their entirety at high-magnification; n = 5 neurons from four animals. B, Plot of tdTomato fluorescence against PSD-95mVenus fluorescence of individual spines. The dashed line indicates our detection threshold, corresponding to three times the SD of the tdTomato bleedthrough into the mVenus channel in individual spines. PSD-95mVenus fluorescence was bleedthrough corrected and the data were fit with a linear function through the coordinate origin. Inset, The R2 values of the fit for five neurons. C, The SD of mVenus/tdTomato fluorescence ratios for all spines analyzed within a neuron normalized to the averaged ratio of the same neuron. D, An image of a representative CA1 oblique dendrite (top), a family of uEPSCs elicited from the spines indicated in the top (middle), and uEPSC amplitudes as a function of PSD-95mVenus fluorescence (bottom). Colored dots indicate sites of two-photon glutamate uncaging. E, Assessment of endogenous PSD-95 turnover using FRAP. An image series of a single spine (arrowhead) being bleached and monitored over time (top) and averaged recovery of PSD-95mVenus fluorescence (bottom) are shown;. n = 11, 13, and 11 for CA1, layer 2/3, and layer 5 pyramidal neurons, respectively; n = 35 for neighboring unbleached control spines. F, Endogenous PSD-95 levels in individual spines were tuned to chronic changes in neuronal activity. Representative image series of the same dendritic segments monitored over 3 d with the indicated treatment (top) and normalized spine volume (red) and PSD-95mVenus fluorescence (green) at the indicated time points (bottom) are shown; n = 7 cells from 4 slices, nine cells from five slices, and seven cells from four slices for untreated, TTX, and bicuculline (BIC) conditions, respectively. Signals from 10 to 80 spines were averaged for each cell, and each condition included a total of 370–625 spines. All data were normalized to baseline values before averaging. * indicates statistically significant from untreated controls.
Figure 7.
Figure 7.
Visualization and characterization of excitatory shaft synapses on aspiny neurons. A, Representative images of the morphology (left) and morphology overlaid with PSD-95mVenus fluorescence (right) of a dendritic branch from a cortical aspiny neuron labeled by in utero viral infection. Colored dots indicate sites of two-photon glutamate uncaging characterized in B. B, uEPSC amplitudes are plotted on the left as a function of PSD-95mVenus fluorescence and fit with a linear function. Colors correspond to the uncaging location shown in A, and uEPSCs are shown on the right (average of 5 trials). C, Assessment of endogenous PSD-95 turnover in aspiny neurons using FRAP; n = 10 for PV-positive neurons, 18 for mixed cortical aspiny neurons, 35 for all spiny neurons shown in Figure 4D, and 59 for all unbleached controls. D, Representative PV-positive neurons from a PV-IRES-Cre/PSD-95-ENABLED/Ai9 triple-heterozygous mouse. Blue dots in the high-magnification image show sites of two-photon glutamate uncaging. E, Current-clamp recordings in response to current injection confirmed that the right labeled cell in D was a fast spiking interneuron. F, Overlaid average mEPSC and uEPSC recorded from the PV-positive neuron shown in D without normalization. G, Average uEPSCs evoked at the dendritic locations indicated in D. H, Representative VTA dopaminergic neurons from a DAT-Cre/PSD-95-ENABLED/Ai9 triple-heterozygous mouse. Zoom-in shows the dendritic segment that underwent two-photon glutamate uncaging stimulation at the positions indicated (blue dots). I, Current-clamp recordings in response to current injection showing the action potential shape and Ih response characteristic for dopaminergic neurons. J, Average uEPSCs evoked at the locations indicated in H.

References

    1. Ahmed B, Anderson JC, Martin KA, Nelson JC. Map of the synapses onto layer 4 basket cells of the primary visual cortex of the cat. J Comp Neurol. 1997;380:230–242. doi: 10.1002/(SICI)1096-9861(19970407)380:2<230::AID-CNE6>3.3.CO%3B2-T. - DOI - PubMed
    1. Badea TC, Hua ZL, Smallwood PM, Williams J, Rotolo T, Ye X, Nathans J. New mouse lines for the analysis of neuronal morphology using CreER(T)/loxP-directed sparse labeling. PLoS One. 2009;4:e7859. doi: 10.1371/journal.pone.0007859. - DOI - PMC - PubMed
    1. Bayascas JR, Sakamoto K, Armit L, Arthur JS, Alessi DR. Evaluation of approaches to generation of tissue-specific knock-in mice. J Biol Chem. 2006;281:28772–28781. doi: 10.1074/jbc.M606789200. - DOI - PubMed
    1. Béïque JC, Andrade R. PSD-95 regulates synaptic transmission and plasticity in rat cerebral cortex. J Physiol. 2003;546:859–867. doi: 10.1113/jphysiol.2002.031369. - DOI - PMC - PubMed
    1. Bergmann I, Nitsch R, Frotscher M. Area-specific morphological and neurochemical maturation of nonpyramidal neurons in the rat hippocampus as revealed by parvalbumin immunocytochemistry. Anat Embryol (Berl) 1991;184:403–409. doi: 10.1007/BF00957901. - DOI - PubMed

Publication types

MeSH terms

LinkOut - more resources