. 2014 Dec 10;34(50):16877-89.
doi: 10.1523/JNEUROSCI.3012-14.2014.

Human scalp potentials reflect a mixture of decision-related signals during perceptual choices

Affiliations

Human scalp potentials reflect a mixture of decision-related signals during perceptual choices

Marios G Philiastides et al. J Neurosci. .

Abstract

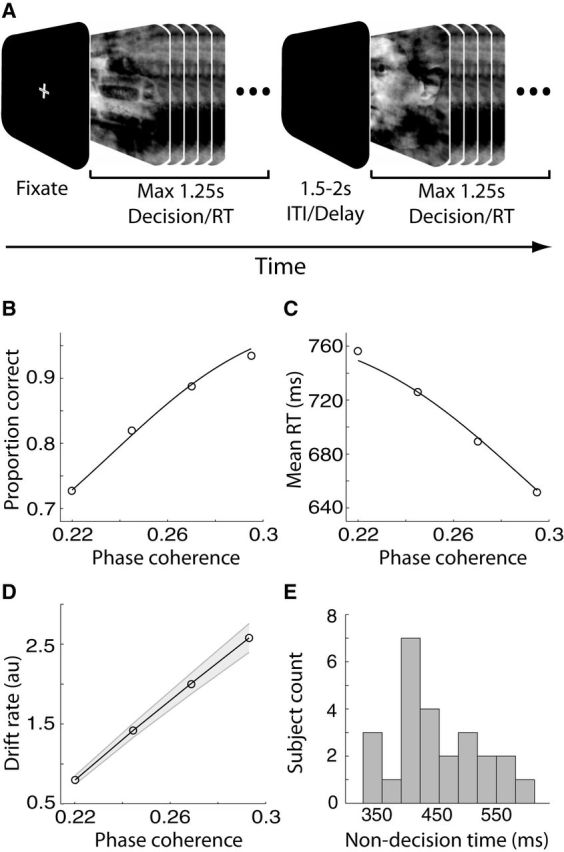
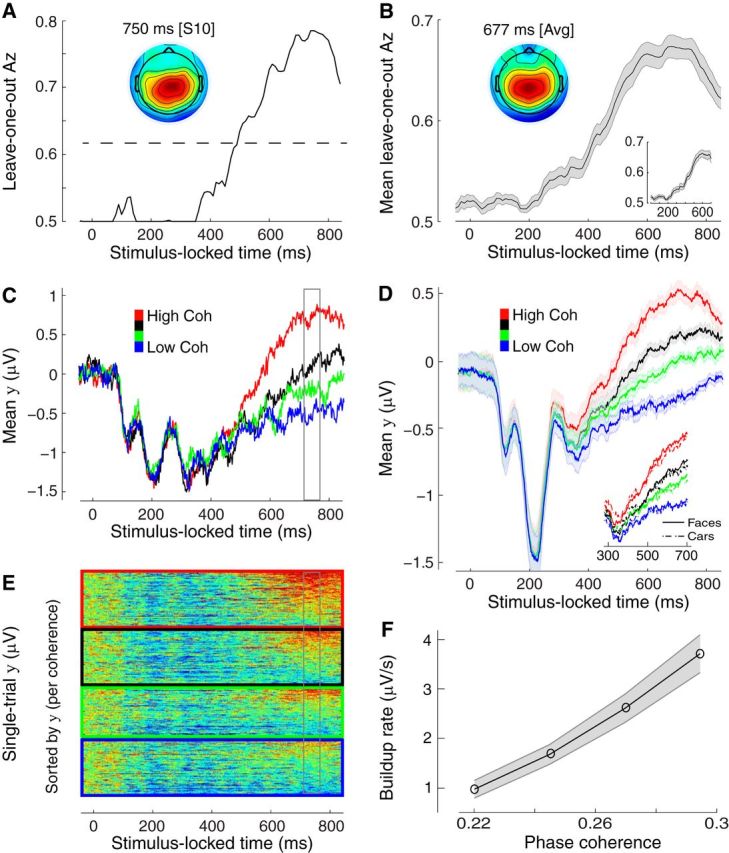
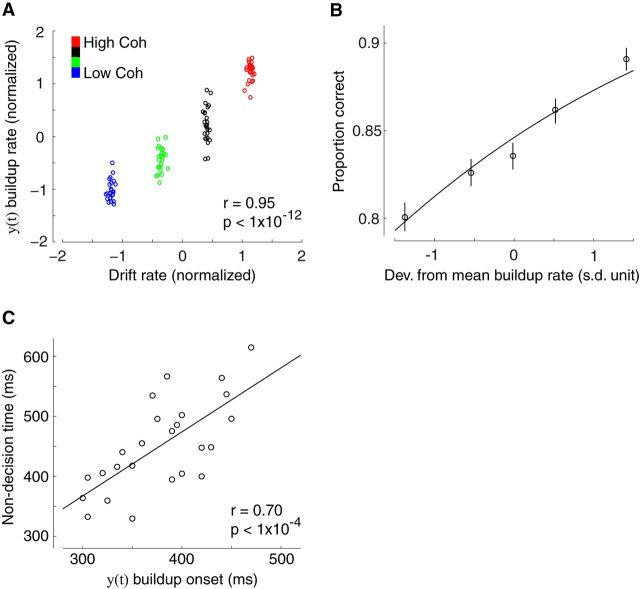
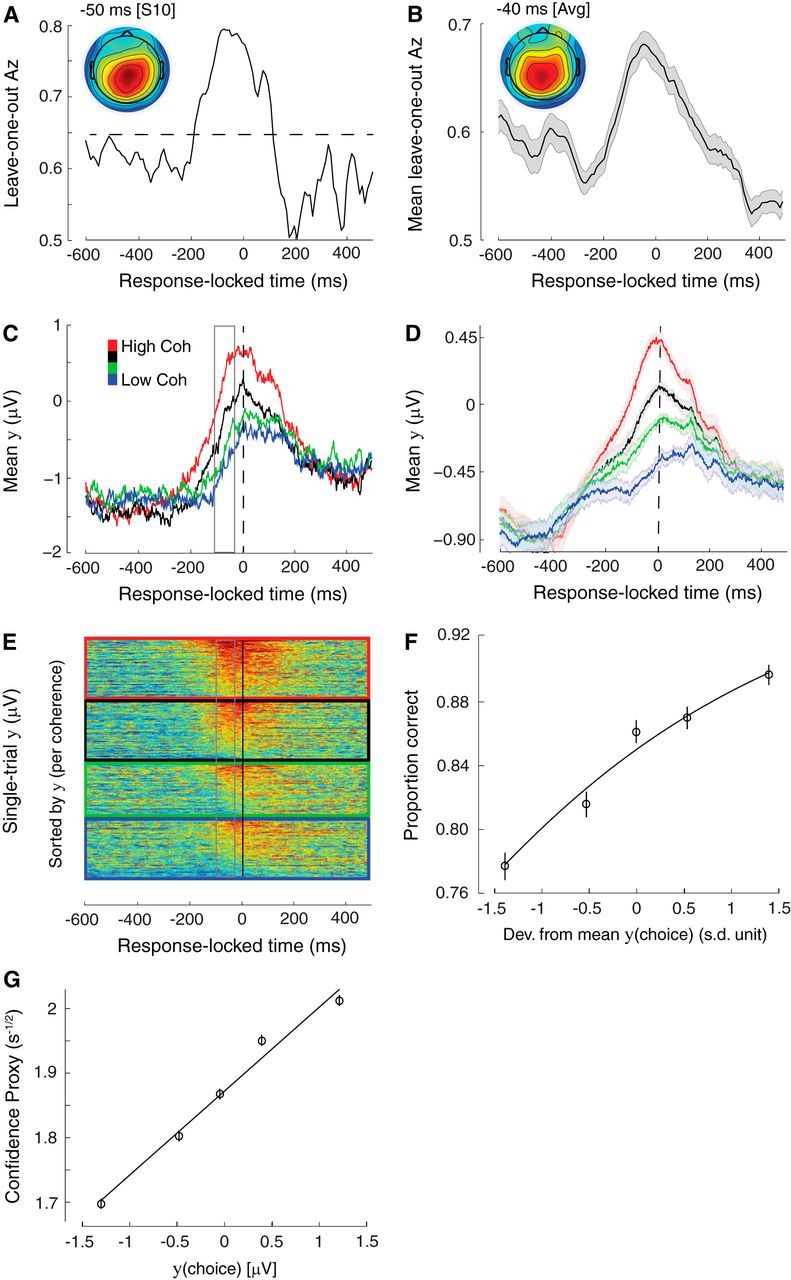
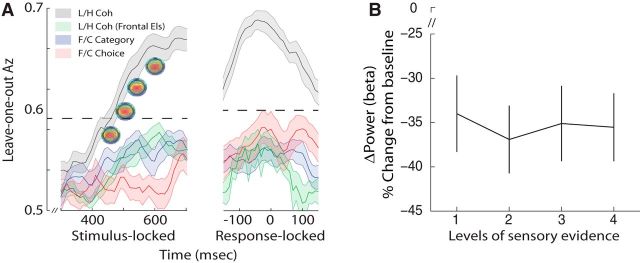
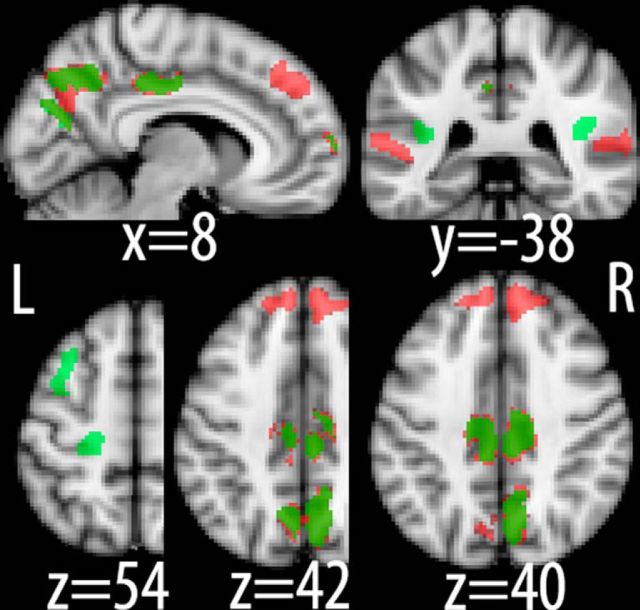
Single-unit animal studies have consistently reported decision-related activity mirroring a process of temporal accumulation of sensory evidence to a fixed internal decision boundary. To date, our understanding of how response patterns seen in single-unit data manifest themselves at the macroscopic level of brain activity obtained from human neuroimaging data remains limited. Here, we use single-trial analysis of human electroencephalography data to show that population responses on the scalp can capture choice-predictive activity that builds up gradually over time with a rate proportional to the amount of sensory evidence, consistent with the properties of a drift-diffusion-like process as characterized by computational modeling. Interestingly, at time of choice, scalp potentials continue to appear parametrically modulated by the amount of sensory evidence rather than converging to a fixed decision boundary as predicted by our model. We show that trial-to-trial fluctuations in these response-locked signals exert independent leverage on behavior compared with the rate of evidence accumulation earlier in the trial. These results suggest that in addition to accumulator signals, population responses on the scalp reflect the influence of other decision-related signals that continue to covary with the amount of evidence at time of choice.

Keywords: EEG; confidence; diffusion model; evidence accumulation; perceptual decision making; single-trial.


Figures

Figure 1.
Figure 1.
Experimental design, behavioral, and computational modeling results. A, Schematic representation of our behavioral paradigm. For each trial, a noisy and rapidly updating (every 33.3 ms) dynamic stimulus of either a face or a car image, at one of four possible phase coherence levels, was presented for a maximum of 1.25 s. Within this time subjects had to indicate their choice by pressing a button. The dynamic stimulus was interrupted upon subjects' response and it was followed by a variable delay lasting between 1.5 and 2 s. ITI, Intertrial interval. B, Average proportion of correct choices, across subjects, as a function of the phase coherence of our stimuli. Performance improved as phase coherence increased. C, Average RT, across subjects, as a function of the phase coherence of our stimuli. Mean RT decreased as phase coherence increased. In B and C curves are average model fits to the behavioral data using the diffusion model of Palmer et al. (2005). D, Average DDM drift rates as a function of the phase coherence of our stimuli. Drift rates increased as phase coherence increased. Shaded region represents SEs across subjects. E, DDM non-decision time distribution across participants indicating a sizeable between-subject variability.
Figure 2.
Figure 2.
Stimulus-locked discriminating activity. A, Classifier performance (Az) during high-vs-low sensory evidence discrimination of stimulus-locked data for a representative subject. The dashed line represents the subject-specific Az value leading to a significance level of p = 0.01, estimated using a bootstrap test. The scalp topography is associated with the discriminating component estimated at time of maximum discrimination. B, Mean classifier performance and scalp topography across subjects (N = 25). Shaded region represents SE across subjects. C, The temporal profile of the discriminating component activity averaged across trials (for the same participant as in A) for each level of sensory evidence, obtained by applying the subject-specific spatial projections estimated at the time of maximum discrimination (gray window) for an extended time window relative to the onset of the stimulus (−50 to 850 ms poststimulus). Note the gradual build-up of component activity, the slope of which is modulated by the amount of sensory evidence. D, The mean temporal profile of the discriminating component across subjects for each level of sensory evidence. Same convention as in C. Shaded region represents SE across subjects. Inset, Same data broken down by stimulus category (face and cars). E, Single-trial discriminant component maps for the same data shown in C. Each row in these maps represents discriminant component amplitudes, y(t), for a single trial across time. The panels, from top to bottom, are sorted by the amount of sensory evidence (high to low). We sorted the trials within each panel by the mean component amplitude (y) in the window of maximum discrimination (shown in gray). Note single-trial variability within each level of sensory evidence. F, The mean build-up rate of the accumulating activity across subjects was positively correlated with the amount of sensory evidence. Build-up rates were estimated by linear fits through the data based on subject-specific onset and peak accumulation times (see Materials and Methods). Shaded region represents SEs across subjects.
Figure 3.
Figure 3.
Correlating build-up activity with behavioral and modeling parameters. A, The build-up rate of accumulating activity in y(t) was positively correlated with DDM estimates of drift rate. Each data point represents a participant at one of the four possible levels of sensory evidence. B, Trial-by-trial deviations from the mean build-up rate in y(t) were positively correlated with the probability of making a correct response (Eq. 5). To visualize this association the data points were computed by grouping trials into five bins based on the deviations in build-up rate. Importantly, the curve is a fit of Equation 5 to individual trials. Error bars represent SEs across subjects. C, The onset time of accumulating activity in y(t) was positively correlated with DDM estimates of non-decision time across participants, indicating that the decision process moved later in time for participants with longer non-decision times. Each data point represents a single participant.
Figure 4.
Figure 4.
Response-locked discriminating activity. A, Classifier performance (Az) during high-vs-low sensory evidence discrimination of response-locked data for a representative subject. The dashed line represents the subject-specific Az value leading to a significance level of p = 0.01, estimated using a bootstrap test. The scalp topography is associated with the discriminating component estimated at time of maximum discrimination. B, Mean classifier performance and scalp topography across subjects (N = 25). Shaded region represents SE across subjects. C, The temporal profile of the discriminating component activity averaged across trials (for the same participant as in A) for each level of sensory evidence, obtained by applying the subject-specific spatial projections estimated at the time of maximum discrimination (gray window) for an extended time window around the subjects' response (−600 to 500 ms around the response). Note that the traces at time of choice (vertical dashed line) appear to be parametrically modulated by the amount of sensory evidence, rather than converging to a common “threshold.” D, The mean temporal profile of the discriminating component across subjects for each level of sensory evidence. Same convention as in C. Shaded region represents SE across subjects. E, Single-trial discriminant component maps for the same data shown in C. Each row in these maps represents discriminant component amplitudes, y(t), for a single trial across time. The panels, from top to bottom, are sorted by the amount of sensory evidence (high to low). We sorted the trials within each panel by the mean component amplitude (y) in the window of maximum discrimination (shown in gray). Note single-trial variability within each level of sensory evidence. F, Trial-by-trial fluctuations in component amplitude at time of choice were positively correlated with the probability of making a correct response (Eq. 7). To visualize this association the data points were computed by grouping trials into five bins based on the deviations in component amplitude. Importantly, the curve is a fit of Equation 7 to individual trials. Error bars represent SEs across subjects. G, Trial-by-trial deviations from the mean component amplitude at time of choice were positively correlated with a DDM-derived proxy of decision confidence, which in turn is inversely proportional to the square root of decision time (DT; see text for details). The data points were obtained following the same procedure as in F. Importantly, the curve is a linear fit to individual trials. Error bars represent SEs across subjects.
Figure 5.
Figure 5.
Control analyses. A, Mean classifier performance (Az) during high-vs-low sensory evidence discrimination along with representative scalp topographies at different time windows during the decision phase (gray), high-vs-low sensory evidence discrimination using only far-frontal sensors (green), face-vs-car category discrimination (blue), and face-vs-car choice discrimination (red) of stimulus- and response-locked data. The dashed line represents the mean Az value leading to a significance level of p = 0.01, estimated using a bootstrap test. Shaded region represents SE across subjects. B, Beta power (18–30 Hz) estimates during a window centered at time of choice, expressed as percentage signal change from prestimulus baseline across the four levels of sensory evidence. Error bars represent SE across subjects.
Figure 6.
Figure 6.
Neuronal source reconstruction. Source localization linked to stimulus-locked (red) and response-locked (green) discriminating activity, respectively. Note the distributed nature of the identified network as well as the overlap between the two analyses in posterior parietal cortex. Slice coordinates are given in millimeters in MNI space.

References

    1. Blankertz B, Lemm S, Treder M, Haufe S, Müller KR. Single-trial analysis and classification of ERP components–a tutorial. Neuroimage. 2011;56:814–825. doi: 10.1016/j.neuroimage.2010.06.048. - DOI - PubMed
    1. Bogacz R, Brown E, Moehlis J, Holmes P, Cohen JD. The physics of optimal decision making: a formal analysis of models of performance in two-alternative forced-choice tasks. Psychol Rev. 2006;113:700–765. doi: 10.1037/0033-295X.113.4.700. - DOI - PubMed
    1. Cheadle S, Wyart V, Tsetsos K, Myers N, de Gardelle V, Herce Castañón S, Summerfield C. Adaptive gain control during human perceptual choice. Neuron. 2014;81:1429–1441. doi: 10.1016/j.neuron.2014.01.020. - DOI - PMC - PubMed
    1. Dakin SC, Hess RF, Ledgeway T, Achtman RL. What causes non-monotonic tuning of fMRI response to noisy images? Curr Biol. 2002;12:R476–R477. author reply R478. - PubMed
    1. de Lange FP, Jensen O, Dehaene S. Accumulation of evidence during sequential decision making: the importance of top-down factors. J Neurosci. 2010;30:731–738. doi: 10.1523/JNEUROSCI.4080-09.2010. - DOI - PMC - PubMed

Publication types

LinkOut - more resources