

doi: 10.3389/fncir.2014.00139.
eCollection 2014.
Single dendrite-targeting interneurons generate branch-specific inhibition
Affiliations
- PMID: 25505385
- PMCID: PMC4243555
- DOI: 10.3389/fncir.2014.00139
Item in Clipboard
Single dendrite-targeting interneurons generate branch-specific inhibition
Front Neural Circuits.
.
Abstract
Microcircuits composed of dendrite-targeting inhibitory interneurons and pyramidal cells (PCs) are fundamental elements of cortical networks, however, the impact of individual interneurons on pyramidal dendrites is unclear. Here, we combine paired recordings and calcium imaging to determine the spatial domain over which single dendrite-targeting interneurons influence PCs in olfactory cortex. We show that a major action of individual interneurons is to inhibit dendrites in a branch-specific fashion.
Keywords: IPSP/C (inhibitory postsynaptic potential/current); backpropagating action potential; olfactory cortex; piriform cortex; pyramidal cells.
Figures
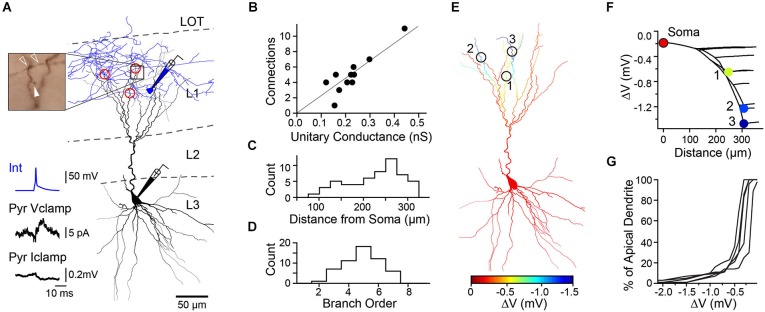
A combination of dendritic synaptic location and L3 PC cable properties can produce branch specific inhibition by single L1 INTs. (A) Anatomical reconstruction of a synaptically connected cell pair (black: PC soma and dendrites, blue: L1 INT soma and axon) and location of putative synaptic contacts (red circles). Upper left, light micrograph showing site of one synaptic contact (open arrowheads: INT axon boutons, closed arrowhead: PC dendritic spine). Bottom left, traces show PC (black) average unitary inhibitory postsynaptic current (Vclamp, Vh = −50 mV) and potential (Iclamp, resting potential) in response to an INT spike (blue). (B) Summary of results from reconstructed pairs (n = 11 cells, 11 slices, 11 mice) shows relationship between number of putative connections and measured unitary conductance. Line, linear fit, r2 = 0.79. (C) Location of synaptic contacts relative to PC soma. (D) Branch order of PC dendrites receiving synaptic contacts. (E) Simulated spatial profile of hyperpolarization from resting membrane potential (ΔV) for the PC recorded in (A). (F) Plot of hyperpolarization vs. distance from soma (0 μm) for all regions of apical dendrite with numbered synaptic contacts corresponding to sites in (E). Red circle at distance = 0 represents the voltage at the soma. (G) Cumulative distribution of predicted dendritic hyperpolarization for reconstructed L1 INT-L3 PC pairs (n = 5 cells, 5 slices, 5 mice).
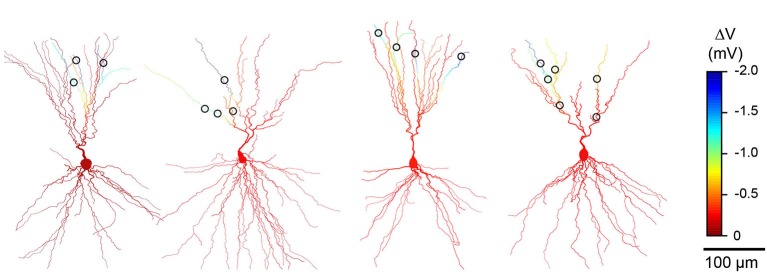
Simulations consistently predict branch specific inhibition in different L3 pyramidal cells (PCs). Results from anatomical reconstructions of four additional cell pairs (as in Figure 1) showing dendritic morphology of L3 PCs and L1 interneuron synaptic contacts (circles). Color scale indicates simulated change in membrane potential during co-activation of all inhibitory synaptic contacts.
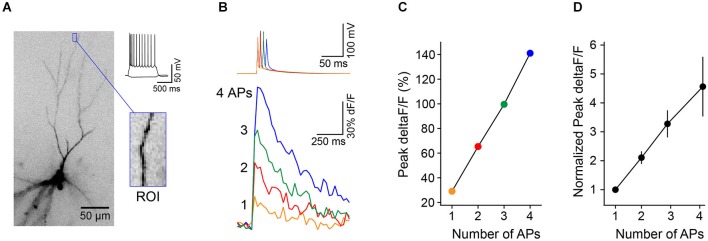
Brief trains of back-propagating APs cause linear increases in Ca2+ in L3 PC distal apical dendrites. (A) L3 PC (identified by morphology and intrinsic electrical properties) filled with the calcium-sensitive dye OGB1-AM. Blue box, distal region of interest (ROI) used for measurements of Ca2+ transients. (B) Trains of 1–4 APs (50 Hz) evoked via somatic current injection (top traces) elicit Ca2+ transients (bottom traces, deltaF/F) in the ROI from cell in (A). (C) The relationship between peak dF/F and number of APs is linear in this range. (D) Summary of results (n = 8 cells, error bar = ±SEM) shows linear relationship between Ca2+ and number of APs.
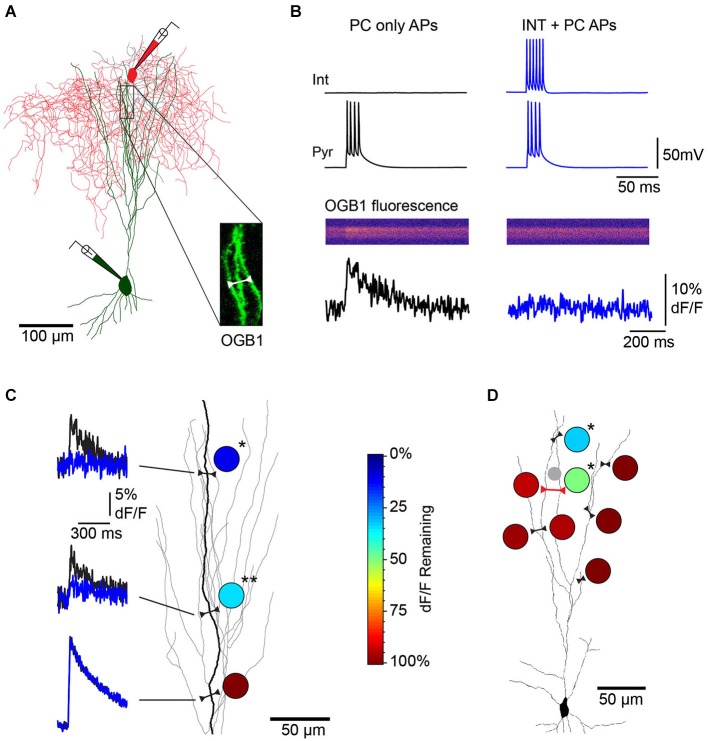
Single L1 interneurons elicit branch specific inhibition of bAP-evoked Ca2+ transients in L3 PC apical dendrites. (A) Reconstruction of a synaptically connected cell pair from a 2-photon image stack of an Oregon Green-BAPTA1 (OGB1)-filled L3 PC (green) and L1 interneuron (red) filled with Alexa 594 dye. Inset, location of distal apical dendrite line scan. (B) Single L1 INT suppresses bAP-evoked Ca2+ influx in L3 PC apical dendrites (responses of cell pair and dendrite region from (A)). Left, dendritic Ca2+ transient (bottom) elicited by PC somatic APs (top, black traces) under control conditions. Right, a train of APs in the connected L1 INT abolishes the bAP-evoked Ca2+ transient in the PC dendrite (blue traces). (C) Multiple line scans over different regions of the same PC dendrite branch show location-dependent suppression of bAP-evoked Ca2+ responses. Left, dF/F elicited by PC only APs (black) overlaid with dF/F elicited by INT+PC APs (blue). Circles, heat map of dendritic inhibition plotted as percent of control dF/F remaining during INT co-activation at each of the three imaging sites. (*p = 0.0103, **p = 0.0066; n = 4 trials/condition). Color scale on right applies to all other panels. (D) Multiple line scans over different dendritic branches of the same PC show branch-specific inhibition. Single line scan including two neighboring branches (red line) confirmed branch-specific modulation of Ca2+ transients during the same trials. (*p = 0.0414 (proximal site), p = 0.0206 (distal site); n = 3 trials/condition). The small gray circle represents the location of the L1 INT soma.
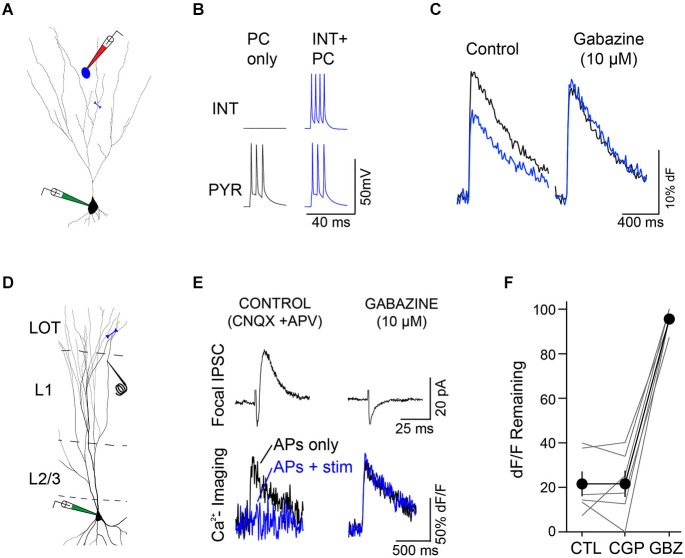
Modulation of dendritic excitability is mediated by GABAA receptors. (A) Synaptically-connected L1 interneuron (blue)-L3 PC (black) pair. Blue line indicates region of line scan for measurement of Ca2+ transients (B) PC APs alone (black traces) were interleaved with trials in which APs were evoked in both the interneuron and PC (blue traces). (C) Under control conditions (left) co-activation of the L1 interneuron (blue trace) caused a marked reduction in the PC bAP-evoked Ca2+ transient (black trace). Right: application of gabazine (10 uM) completely blocked the suppression of the bAP-evoked Ca2+ transient by the L1 interneuron. (D) Minimal stimulation experiments confirmed the role of GABAA receptors in the modulation of bAP-evoked Ca2+ transients. Experimental configuration, whole-cell recordings were made from L3 PCs filled with OGB1-AM. A focal stimulating electrode was placed close to a branch of dendrite where line scans (blue line) were performed. Experiments were performed in the presence of glutamate receptor antagonists (CNQX, 10 μM and D-APV, 50 μM) to isolate inhibitory synaptic transmission. (E) Representative experiment. Left, top: focal stimulation elicited a small inhibitory postsynaptic current (IPSC (black trace, Vm = −45 mV) in the PC. Bottom: bAP-evoked Ca2+ transients in the PC (black trace) were strongly reduced during a train (6 pulses, 100 Hz) of L1 stimuli (blue traces). Right, application of gabazine (10 μM) eliminated the L1-evoked IPSC (top) and abolished the effect of L1 stimulation on the PC bAP-evoked Ca2+ transients. (F) Summary (n = 6 cells, lines represent individual cells, circles indicate mean ± SEM) demonstrating that suppression of bAP-evoked Ca2+ transients by focal L1 stimulation is unaffected by the GABAB receptor antagonist CGP 55845 (10 μM, CGP) but completely blocked by subsequent application of gabazine (10 μM, GBZ).
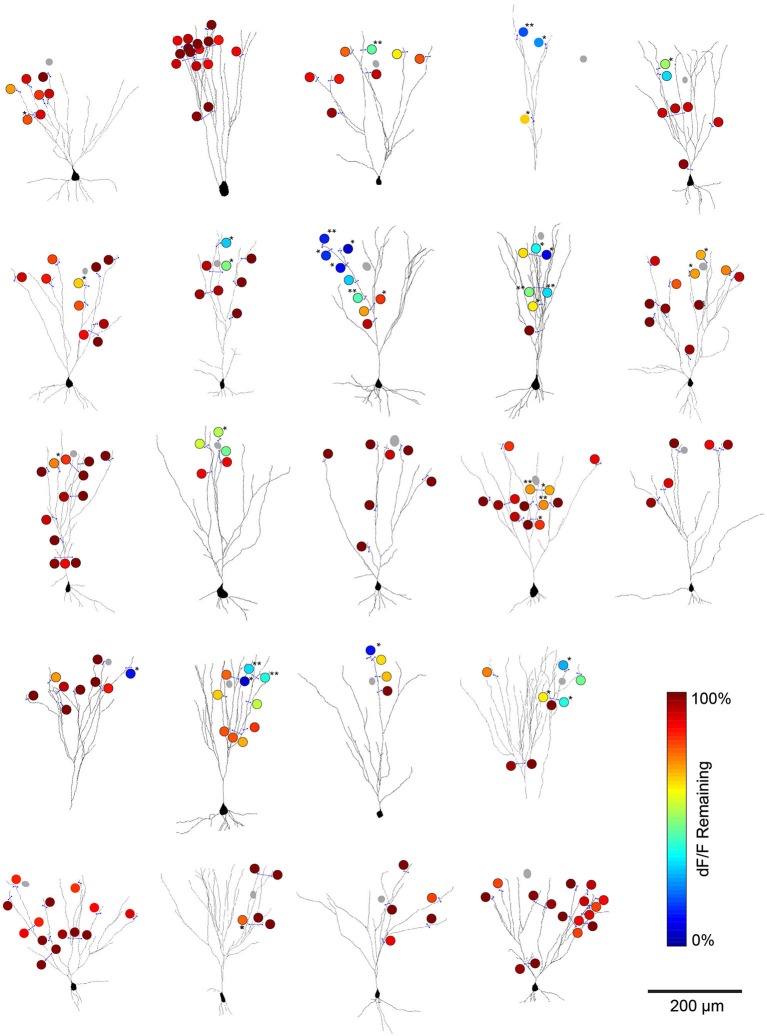
L1 interneuron-mediated modulation of bAP-evoked Ca2+ transients for all imaged cell pairs. Summary plots of imaging results for the cell pairs analyzed in Figure 2. Cells were reconstructed from 2-photon stacks of OGB1-AM raw fluorescence in L3 PCs. Blue lines represent the location of line scans used for deltaF/F calculations. Gray circles represent the soma of the simultaneously recorded L1 interneuron. The color scale (circles) indicates the percent of the peak deltaF/F remaining when the L1 interneuron was co-activated with the L3 PC (compared to the Ca2+ response when bAPs were evoked in L3 PCs alone). Significance calculated by student’s t-test comparing peak deltaF/F values for trials of PYR APs alone vs. trials of INT+PYR APs (3–5 trials per condition per imaging site), *=p < 0.05; **=p < 0.01.
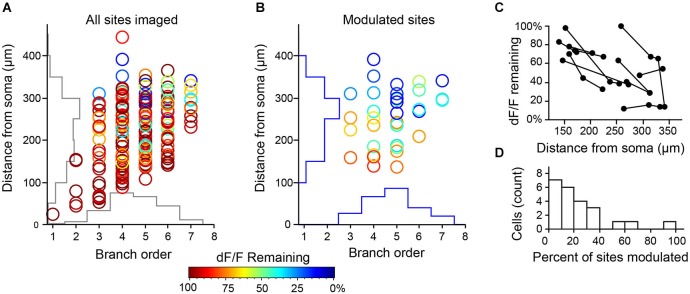
Summary of modulation at all imaging sites for L1 interneuron-PC pairs. (A) (N = 201 sites, 23 cell pairs from 23 slices and 22 mice). Axes show corresponding histograms of imaging locations. (B) Distribution of sites with significant modulation (36 sites in 17 cell pairs, p < 0.05, 3–5 trials/condition) show strongest effect on most distal dendrites. (C) When multiple sites were imaged along the same dendritic branch (connected points), the effect of inhibition increased with distance from the soma. (D) Inhibition by single L1 INTs operates over a small fraction of the total dendritic arbor. Histogram represents the percentage of imaged sites in a single L3 PC with significant modulation by an individual L1 INT.
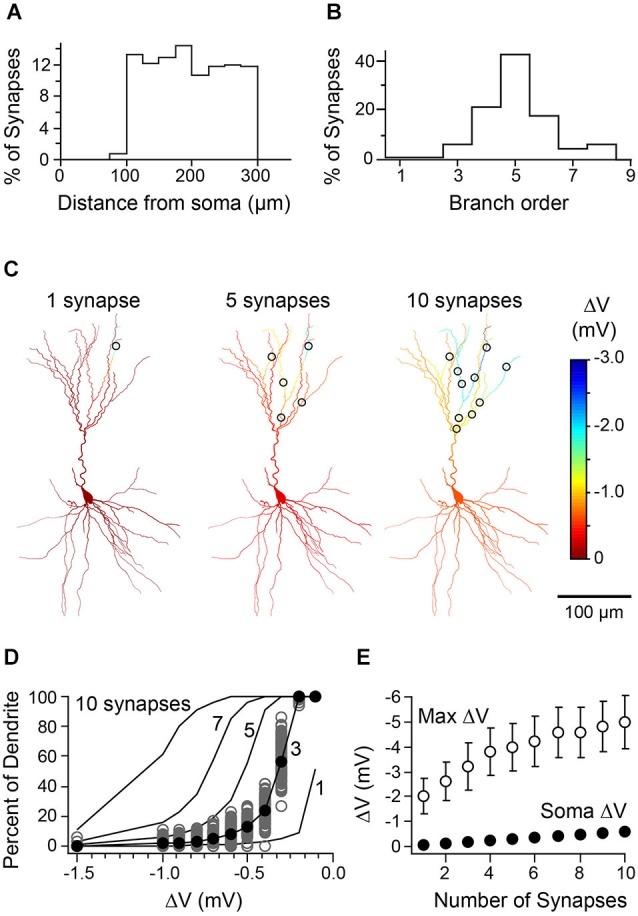
Relationship between number of synaptic contacts of L1 interneuron-L3 PC pairs and distribution of inhibition. (A) Histogram representing the distance from soma for locations of synapses drawn in the model (n = 100 synapses/cell over 5 cells; compare to histogram in Figure 1C). (B) Histogram of the branch order for synapses randomly drawn from the uniform distribution represented in Figure 1D. (C) Simulated spatial profile of hyperpolarization from the activation of 1, 5, or 10 randomly placed synapses (same cell as in Figure 1). (D) Cumulative distribution curves representing mean dendritic hyperpolarization generated by 1, 3, 5, 7, or 10 synapses placed in the same cell. Gray circles, 100 iterations of 3 synapses distributed over the apical dendrites. Black circles, the mean cumulative distribution of dendritic hyperpolarization (mean of values depicted by gray circles). Black lines, mean curves generated by 100 iterations of the model. (E) Summary data from simulations of five cells showing the mean maximal dendritic voltage change (open circles) and somatic voltage change (closed circles) as a function of the number of synapses activated (error bars are < SEM).
References
Publication types
MeSH terms
Substances
Grants and funding
LinkOut - more resources
Full Text Sources
Other Literature Sources
Miscellaneous