

Modulation of CYP3a expression and activity in mice models of type 1 and type 2 diabetes
- PMID: 25505621
- PMCID: PMC4186456
- DOI: 10.1002/prp2.82
Modulation of CYP3a expression and activity in mice models of type 1 and type 2 diabetes
Abstract
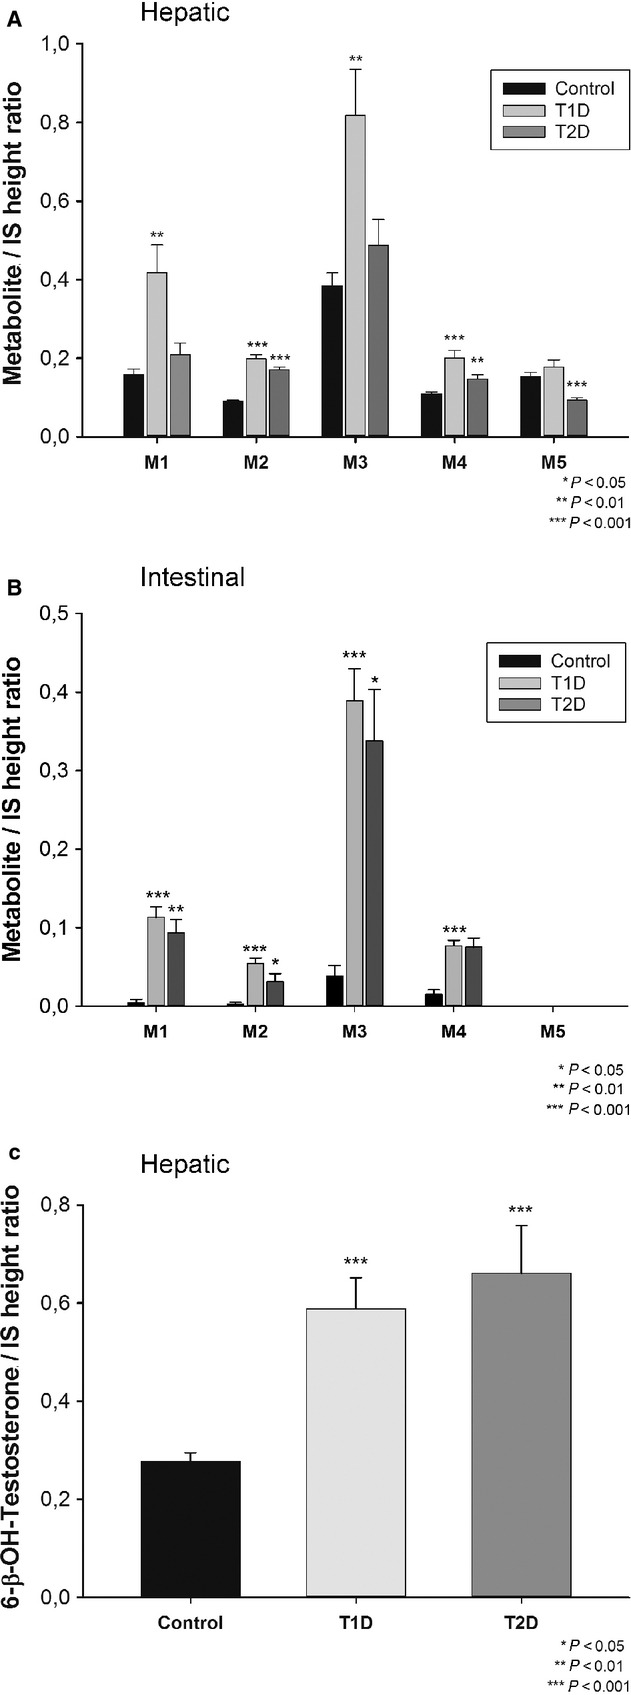
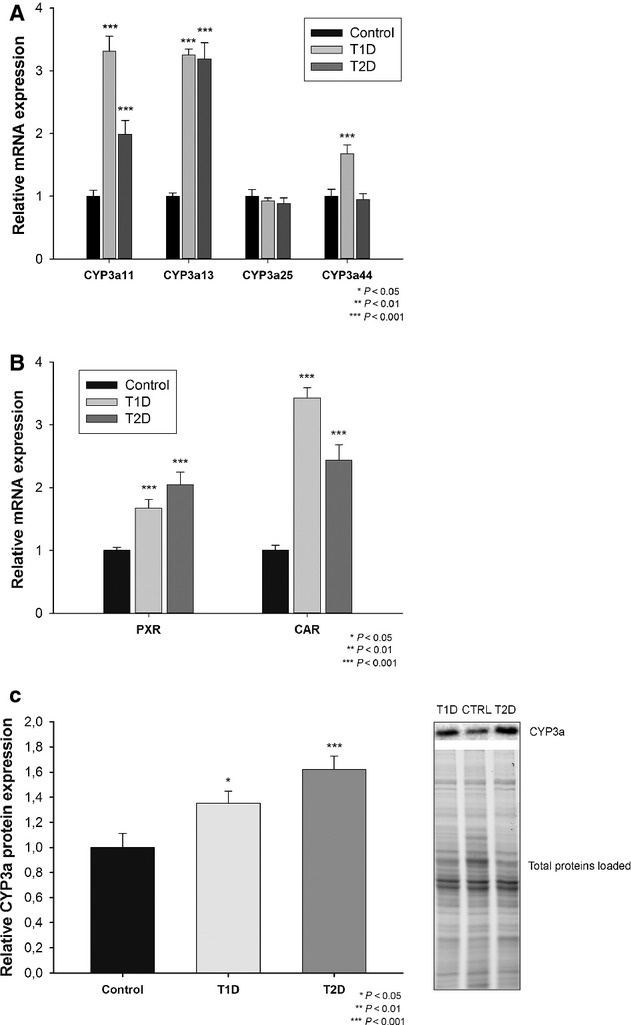
CYP3A4, the most abundant cytochrome P450 enzyme in the human liver and small intestine, is responsible for the metabolism of about 50% of all marketed drugs. Numerous pathophysiological factors, such as diabetes and obesity, were shown to affect CYP3A activity. Evidences suggest that drug disposition is altered in type 1 (T1D) and type 2 diabetes (T2D). The objective was to evaluate the effect of T1D and T2D on hepatic and intestinal CYP3a drug-metabolizing activity/expression in mice. Hepatic and intestinal microsomes were prepared from streptozotocin-induced T1D, db/db T2D and control mice. Domperidone was selected as a probe substrate for CYP3a and formation of five of its metabolites was evaluated using high performance liquid chromatography. Hepatic CYP3a protein and mRNA expression were assessed by Western blot and reverse-transcription quantitative polymerase chain reaction respectively. Hepatic microsomal CYP3a activity was significantly increased in both T1D and T2D groups versus control group. Intestinal CYP3a activity was also significantly increased in both T1D and T2D groups. Moreover, significant increases of both hepatic CYP3a mRNAs and protein expression were observed in both T1D and T2D groups versus control group. Additional experiments with testosterone further validated the increased activity of CYP3a under the effect of both T1D and T2D. Although differences exist in the pathophysiological insults associated with T1D and T2D, our results suggest that these two distinct diseases may have the same modulating effect on the regulation of CYP3a, ultimately leading to variability in drug response, ranging from lack of effect to life-threatening toxicity.
Keywords: Domperidone as a CYP3a substrate; mice models of type 1 and type 2 diabetes; modulation of CYP3a expression & activity.
Figures
Similar articles
-
Decreased CYP3A expression and activity in guinea pig models of diet-induced metabolic syndrome: is fatty liver infiltration involved?Drug Metab Dispos. 2013 May;41(5):952-7. doi: 10.1124/dmd.112.050641. Epub 2013 Feb 14. Drug Metab Dispos. 2013. PMID: 23412133
-
Role of hepatic and intestinal cytochrome P450 3A and 2B6 in the metabolism, disposition, and miotic effects of methadone.Clin Pharmacol Ther. 2004 Sep;76(3):250-69. doi: 10.1016/j.clpt.2004.05.003. Clin Pharmacol Ther. 2004. PMID: 15371986 Clinical Trial.
-
Intravenous and oral alfentanil as in vivo probes for hepatic and first-pass cytochrome P450 3A activity: noninvasive assessment by use of pupillary miosis.Clin Pharmacol Ther. 2004 Nov;76(5):452-66. doi: 10.1016/j.clpt.2004.07.006. Clin Pharmacol Ther. 2004. PMID: 15536460 Clinical Trial.
-
Tissue Specific Modulation of cyp2c and cyp3a mRNA Levels and Activities by Diet-Induced Obesity in Mice: The Impact of Type 2 Diabetes on Drug Metabolizing Enzymes in Liver and Extra-Hepatic Tissues.Pharmaceutics. 2017 Sep 26;9(4):40. doi: 10.3390/pharmaceutics9040040. Pharmaceutics. 2017. PMID: 28954402 Free PMC article.
-
Cytochrome P450 3A expression and activity in the rabbit lacrimal gland: glucocorticoid modulation and the impact on androgen metabolism.Invest Ophthalmol Vis Sci. 2005 Dec;46(12):4697-706. doi: 10.1167/iovs.05-0139. Invest Ophthalmol Vis Sci. 2005. PMID: 16303967
Cited by
-
Type 2 Diabetes, Atrial Fibrillation, and Direct Oral Anticoagulation.J Diabetes Res. 2019 Dec 6;2019:5158308. doi: 10.1155/2019/5158308. eCollection 2019. J Diabetes Res. 2019. PMID: 31886279 Free PMC article. Review.
-
Type 2 Diabetes and ADP Receptor Blocker Therapy.J Diabetes Res. 2016;2016:6760710. doi: 10.1155/2016/6760710. Epub 2015 Dec 28. J Diabetes Res. 2016. PMID: 26824047 Free PMC article. Review.
-
Prevention of atherothrombotic events in patients with diabetes mellitus: from antithrombotic therapies to new-generation glucose-lowering drugs.Nat Rev Cardiol. 2019 Feb;16(2):113-130. doi: 10.1038/s41569-018-0080-2. Nat Rev Cardiol. 2019. PMID: 30250166 Free PMC article. Review.
-
High fat diet induced obesity is mitigated in Cyp3a-null female mice.Chem Biol Interact. 2018 Jun 1;289:129-140. doi: 10.1016/j.cbi.2018.05.001. Epub 2018 May 5. Chem Biol Interact. 2018. PMID: 29738703 Free PMC article.
-
Imbalance of Drug Transporter-CYP450s Interplay by Diabetes and Its Clinical Significance.Pharmaceutics. 2020 Apr 11;12(4):348. doi: 10.3390/pharmaceutics12040348. Pharmaceutics. 2020. PMID: 32290519 Free PMC article. Review.
References
-
- Akhlaghi F, Dostalek M, Falck P, Mendonza AE, Amundsen R, Gohh RY, et al. The concentration of cyclosporine metabolites is significantly lower in kidney transplant recipients with diabetes mellitus. Ther Drug Monit. 2012;34:38–45. - PubMed
-
- Bruyère A, Decleves X, Bouzom F, Proust L, Martinet M, Walther B, et al. Development of an optimized procedure for the preparation of rat intestinal microsomes: comparison of hepatic and intestinal microsomal cytochrome P450 enzyme activities in two rat strains. Xenobiotica. 2009;39:22–32. - PubMed
-
- Chen GM, Hu N, Liu L, Xie SS, Wang P, Li J, et al. Pharmacokinetics of verapamil in diabetic rats induced by combination of high-fat diet and streptozotocin injection. Xenobiotica. 2011;41:494–500. - PubMed
-
- Cheng PY, Morgan ET. Hepatic cytochrome P450 regulation in disease states. Curr Drug Metab. 2001;2:165–183. - PubMed
LinkOut - more resources
Full Text Sources
Other Literature Sources
Miscellaneous
