. 2014 Nov 27:6:322.
doi: 10.3389/fnagi.2014.00322. eCollection 2014.

The neuron-astrocyte-microglia triad in a rat model of chronic cerebral hypoperfusion: protective effect of dipyridamole

Affiliations

The neuron-astrocyte-microglia triad in a rat model of chronic cerebral hypoperfusion: protective effect of dipyridamole

Daniele Lana et al. Front Aging Neurosci. .

Abstract

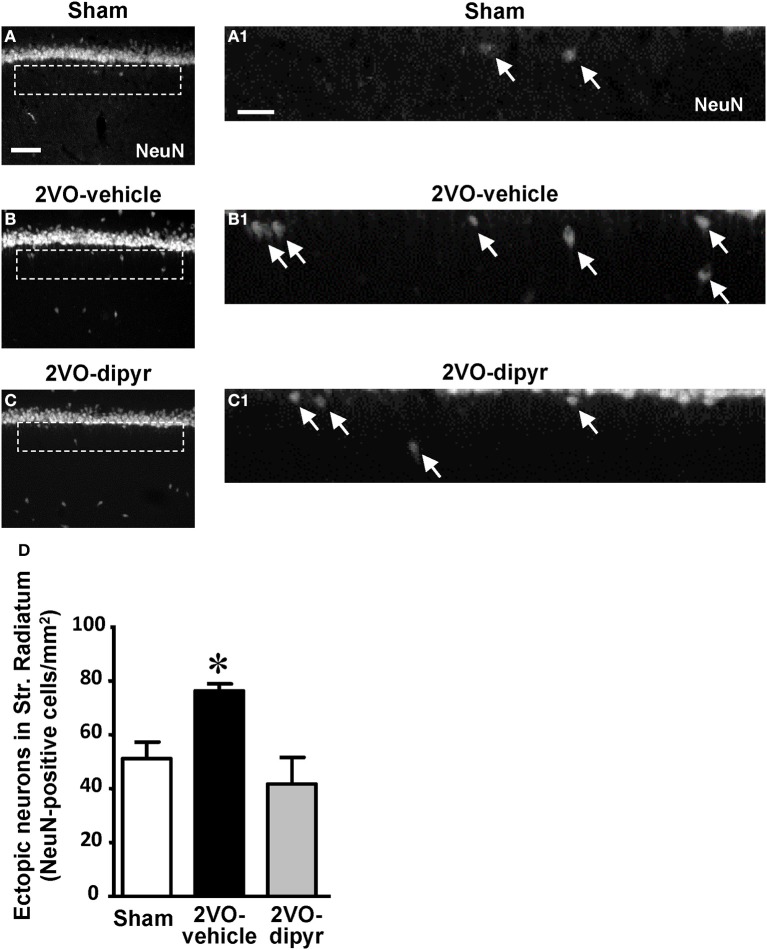
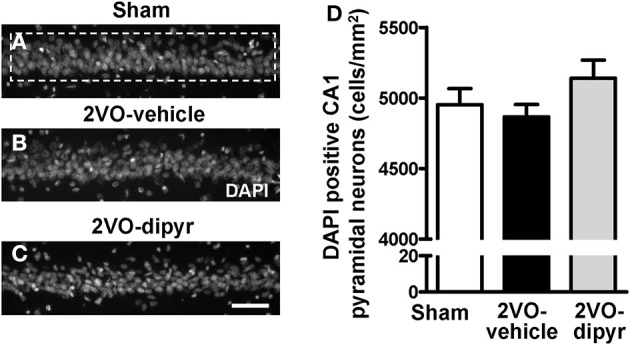
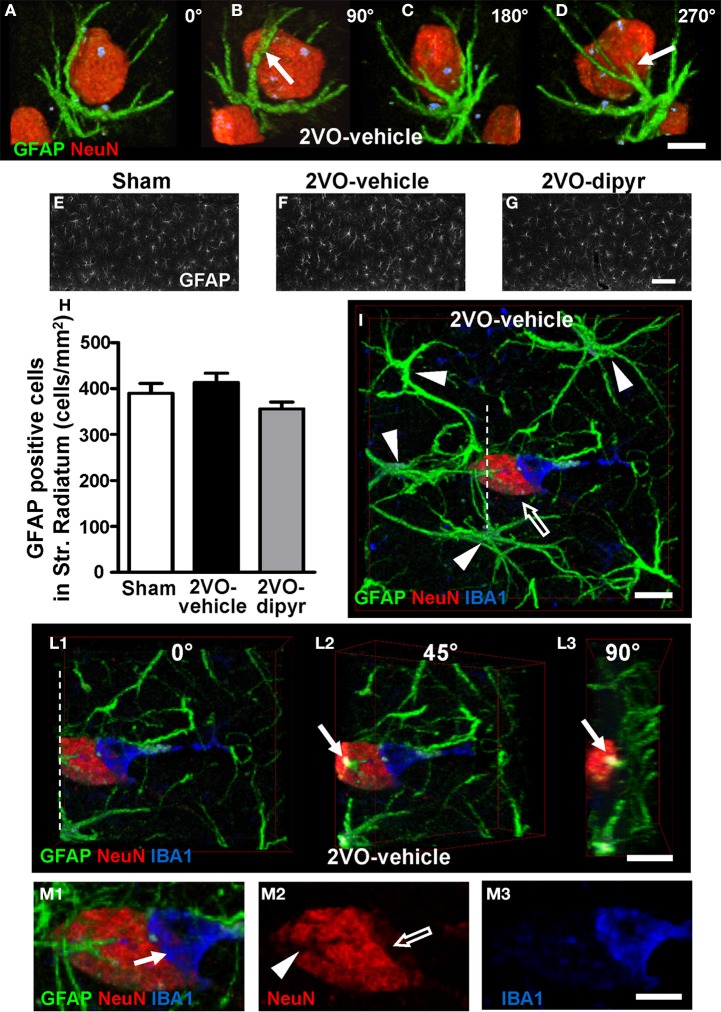
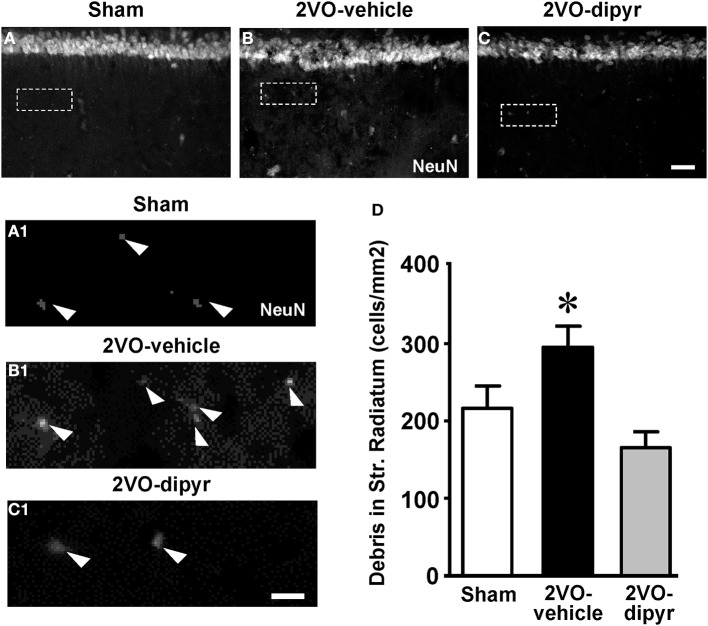
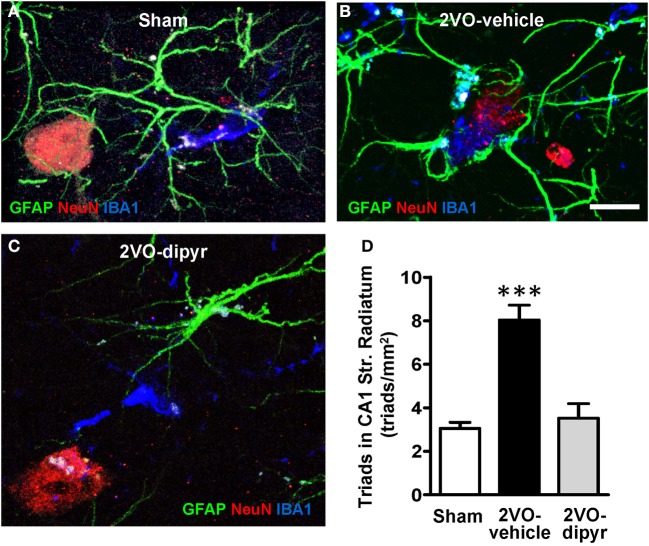
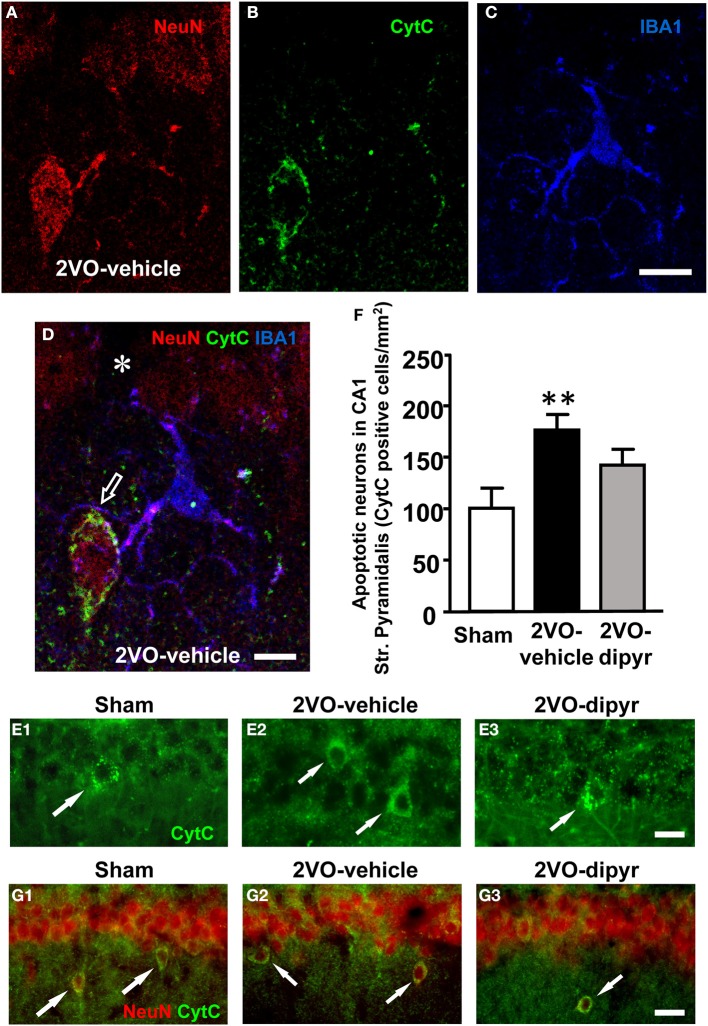
Chronic cerebral hypoperfusion during aging may cause progressive neurodegeneration as ischemic conditions persist. Proper functioning of the interplay between neurons and glia is fundamental for the functional organization of the brain. The aim of our research was to study the pathophysiological mechanisms, and particularly the derangement of the interplay between neurons and astrocytes-microglia with the formation of "triads," in a model of chronic cerebral hypoperfusion induced by the two-vessel occlusion (2VO) in adult Wistar rats (n = 15). The protective effect of dipyridamole given during the early phases after 2VO (4 mg/kg/day i.v., the first 7 days after 2VO) was verified (n = 15). Sham-operated rats (n = 15) were used as controls. Immunofluorescent triple staining of neurons (NeuN), astrocytes (GFAP), and microglia (IBA1) was performed 90 days after 2VO. We found significantly higher amount of "ectopic" neurons, neuronal debris and apoptotic neurons in CA1 Str. Radiatum and Str. Pyramidale of 2VO rats. In CA1 Str. Radiatum of 2VO rats the amount of astrocytes (cells/mm(2)) did not increase. In some instances several astrocytes surrounded ectopic neurons and formed a "micro scar" around them. Astrocyte branches could infiltrate the cell body of ectopic neurons, and, together with activated microglia cells formed the "triads." In the triad, significantly more numerous in CA1 Str. Radiatum of 2VO than in sham rats, astrocytes and microglia cooperated in the phagocytosis of ectopic neurons. These events might be common mechanisms underlying many neurodegenerative processes. The frequency to which they appear might depend upon, or might be the cause of, the burden and severity of neurodegeneration. Dypiridamole significantly reverted all the above described events. The protective effect of chronic administration of dipyridamole might be a consequence of its vasodilatory, antioxidant and anti-inflammatory role during the early phases after 2VO.

Keywords: CA1; apoptosis; confocal microscopy; neuron-astrocyte-microglia triad; phagocytosis.


Figures

Figure 1
Figure 1
(A) Experimental scheme. Chronic hypoperfusion in the rat was obtained by occlusion of the Right and Left common carotid arteries separately, 7 days apart. Dipyridamole was administered i.v. for 7 days. (B) Representation of the regions of Interest (ROI) in CA1 hippocampus Str. Pyramidale and Str. Radiatum where all imunohistochemical analyses were performed. (C) Representation of a triple immunostaining of a neuron-astrocyte-microglia triad. Neuron (NeuN positive, red), astrocyte (GFAP positive, green), microglia (IBA1 positive, blue). Scale bar: 5 μm.
Figure 2
Figure 2
Quantitative analysis of ectopic neurons in CA1 Str. Radiatum. (A–C) Representative photomicrographs of immunostained neurons (NeuN positive), taken at an epifluorescent microscope, in CA1 Str. Pyramidale and CA1 Str. Radiatum of a sham (A), a 2VO-vehicle (B), and a 2VO-dipyridamole rat (C). Images show the presence of ectopic neurons in the Str. Radiatum within 100 μm from the Str. Pyramidale. Scale bar: 70 μm. (A1–C1) Higher magnification images of the framed areas shown in (A–C), respectively. Arrows indicate ectopic neurons. Scale bar: 25 μm. (D) Quantitative analysis of ectopic neurons in CA1 Str. Radiatum of sham (white column, n = 7), 2VO-vehicle (black column, n = 8), and 2VO-dipyridamole (gray column, n = 8) rats (ectopic neurons/mm2; mean ± s.e.m.; *at least P < 0.05 vs. sham and 2VO-dipyridamole rats, One-Way ANOVA followed by Newman–Keuls Multiple Comparison Test). Quantification was performed blind by two researchers in the region of interest (ROI) of CA1 Str. Radiatum and results were averaged. ROIs were calculated in mm2 and the counts of NeuN immunopositive cells were expressed as neurons/mm2.
Figure 3
Figure 3
Quantitative analysis of cells labeled with DAPI in CA1 Str. Pyramidale. (A–C) Representative photomicrographs, taken at an epifluorescent microscope, of DAPI staining in CA1 Str. Pyramidale of a sham (A), a 2VO-vehicle (B), and a 2VO-dipyridamole rat (C). Scale bar: 50 μm. (D) Quantitative analysis of DAPI positive pyramidal neurons in CA1 Str. Pyramidale of sham (white column, n = 12), 2VO-vehicle (black column, n = 12), and 2VO-dipyridamole (gray column, n = 11) rats (DAPI positive neurons/mm2; mean ± s.e.m.; not significant, One-Way ANOVA). Quantification of CA1 pyramidal neurons was obtained subtracting the quantity of GFAP positive astrocytes and IBA1 positive microglia from the total of DAPI positive cells in CA1 ROI (area highlighted by the dashed rectangle in A). Quantification was performed blind by two researchers in the region of interest (ROI) of CA1 Str. Pyramidale (framed area in A) and results were averaged. ROIs were calculated in mm2 and the counts of DAPI positive neurons were expressed as cells/mm2.
Figure 4
Figure 4
Neuron-astrocyte-microglia interplay and quantification of astrocytes. (A–D) Double immunostaining of neurons (red) and astrocytes (green). The confocal images represent 3D renderings of 49 confocal scans (total thickness 14.7 μm) acquired starting at 0.3 μm depth into the slice. The confocal image shown in (A) was digitally rotated by 90° (B), 180° (C), and 270° (D) around its vertical axis. Scale bar: 7.5 μm. (E–G) Representative epifluorescent photomicrographs of GFAP immunostained astrocytes in CA1 Str. Radiatum of a sham (E), a 2VO-vehicle (F), and a 2VO-dipyridamole rat (G). GFAP positive astrocytes were counted in Str. Radiatum (ROI as represented in E–G). Scale bar: 50 μm. (H) Quantitative analysis of GFAP positive astrocytes in CA1 Str. Radiatum of sham (white column, n = 11), 2VO-vehicle (black column, n = 8), and 2VO-dipyridamole rats (gray column, n = 10) counted as described above (GFAP positive cells/mm2; mean ± s.e.m.; n.s., One-Way ANOVA). Quantification was performed blind by two researchers and results were averaged. ROIs were calculated in mm2 and the counts of astrocytes were expressed as neurons/mm2. (I–L3) Representative confocal images of triple immunostaining of astrocytes (green), neurons (red, open arrow), and microglia (blue) in the CA1 Str. Radiatum of a 2VO-vehicle rat. The 3D confocal rendering in (I) was obtained from 30 confocal scans (total thickness 9.0 μm) acquired starting at 3 μm depth into the slice. Arrowheads show the bodies of 4 astrocytes projecting their branches toward the neuron and forming a glia “micro scar” around it. The 3D confocal rendering in (I) was digitally cut along the white dotted line (L1) and rotated by 45° (L2) and 90° (L3) around the vertical axis. Arrows in (L2, L3) show that an astrocyte branch infiltrates the neuronal cell body. Scale bar in I–L3: 10 μm. (M1–M3) High magnification confocal renderings of the neuron-astrocyte-microglia triad shown in (I). Arrow in (M1) indicates an IBA1-positive microglia cell phagocytosing the neuron. Panel (M2) shows a neuron immunostained for NeuN. The open arrow indicates that neuronal cytoplasm is missing underneath the phagocitosing microglia cell. Arrowhead shows the grooves formed by astrocyte branches infiltrating the neuron cell body. Panel (M3) shows the IBA1 positive amoeboid microglia cell. Scale bar: 5 μm.
Figure 5
Figure 5
Quantitative analysis of neuronal debris in CA1 Str. Radiatum. (A–C) Representative photomicrographs, taken at an epifluorescent microscope, of NeuN immunostaining in CA1 Str. Pyramidale and CA1 Str. Radiatum of a sham (A), a 2VO-vehicle (B), and a 2VO-dipyridamole rat (C) showing the presence of NeuN positive debris in the Str. Radiatum (arrowheads in the magnifications A1–C1). Neuronal debris were defined as NeuN-positive fragments with dimensions ranging between 2.5 and 6.5 μm. Scale bar: 75 μm. (A1–C1) High magnification images of the framed areas shown in (A–C). Scale bar: 10 μm. (D) Quantitative analysis of neuronal debris in CA1 Str. Radiatum of sham (white column, n = 9), 2VO-vehicle (black column, n = 10), and 2VO-dipyridamole rats (gray column, n = 11) counted in CA1 Str. Radiatum (debris/mm2; mean ± s.e.m.; *at least P < 0.05 vs. sham and vs. 2VO-dipyridamole rats; One-Way ANOVA and Newman–Keuls Multiple Comparison Test). Quantification was performed blind by two researchers in the region of interest (ROI) of CA1 Str. Radiatum and results were averaged. ROIs were calculated in mm2 and the counts of NeuN positive debris were expressed as neurons/mm2.
Figure 6
Figure 6
Quantitative analysis of resting and reactive microglia cells. (A–C) Representative photomicrographs, taken at an epifluorescent microscope, of IBA1 positive cells in CA1 Str. Radiatum of a sham (A), a 2VO-vehicle (B), and a 2VO-dipyridamole rat (C). Scale bar: 50 μm. (D) Quantitative analysis of microglia cells in CA1 Str. Radiatum of sham (n = 8), 2VO-vehicle (n = 8), and 2VO-dipyridamole rats (n = 11). Black portion of columns represent resting microglia cells, white portion of columns represent reactive microglia cells, the entire columns represent total microglia cells. Total microglia in 2VO-vehicle rats was significantly different from sham and 2VO-dipyridamole rats (IBA1 positive cells/mm2; mean ± s.e.m.; *P < 0.05 vs. the two other groups, One-Way ANOVA and Newman–Keuls Multiple Comparison Test). Resting and reactive microglia did not differ among the three experimental groups. Quantification was performed blind by two researchers in the region of interest (ROI) of CA1 Str. Radiatum (represented in A–C) and results were averaged. ROIs were calculated in mm2 and the counts of resting and reactive microglia were expressed as neurons/mm2.
Figure 7
Figure 7
Evidence of triads and phagocytosis of neurons in CA1 Str. Radiatum of 2VO-vehicle rats. Triple immunostaining of GFAP (green), NeuN (red), and IBA1 (blue) in CA1 Str. Pyramidale and Str. Radiatum of three different 2VO-vehicle rats. (A) Confocal 3D rendering of triple immunostaining in the CA1 Str. Pyramidale and Str. Radiatum of a 2VO-vehicle rat obtained stacking three consecutive confocal z scans (0.3 μm each, total thickness 0.9 μm acquired at 2.8 μm depth into the neuron). Arrows indicate an empty space that separates the neuron from the surrounding CA1 pyramidal neurons. Scale bar: 5 μm. (A1) Magnification of the framed area in (A). The arrowhead shows that the neuronal cytoplasm is inside the microglia cell body. Scale bar: 2 μm. (B) Confocal 3D rendering of triple immunostaining in the CA1 Str. Pyramidale and Str. Radiatum of a different 2VO-vehicle rat. The image represents a 3D rendering of 33 confocal scans (total thickness 9.9 μm) acquired starting at 0.3 μm depth into the slice. The ectopic neuron (open arrow) is in close contact with both astrocyte branches and a microglia cell that resides on top of the neuron and embraces it with its branches. Scale bar: 10 μm. (B1–B3) Magnifications of the framed area in (B). Astrocytes were omitted for clarity. The open arrow in (B2) shows the lack of NeuN immunostaining beneath the microglia cell, indicating that the microglia is phagocytosing the neuron. Scale bar: 10 μm. (C) Triple immunostaining in the CA1 Str. Radiatum of a third 2VO-vehicle rat. This image represents a 3D rendering of 37 confocal scans (total thickness 11.1 μm) acquired starting at 3.6 μm depth into the slice. Two ectopic neurons (red) are surrounded by astrocyte branches and phagocytosed by microglia cells. The open arrow shows a fusiform-shaped microglia cell. Scale bar: 8 μm. (C1–C3) Higher magnification confocal “sub-slices” of the framed area in (C) obtained stacking 12 consecutive confocal z scans (0.3 μm each, total thickness 3.6 μm acquired at 1.5 μm depth into the neuron). Astrocytes were omitted for clarity. Arrowheads in (C1) indicate colocalization of neuronal cytoplasm within IBA1-positive reactive microglia cell. Open arrow in (C2) indicates loss of NeuN staining. Scale bar: 5 μm.
Figure 8
Figure 8
Quantitative analysis of triads in CA1 Str. Radiatum. Triple immunostaining of GFAP (green), NeuN (red), and IBA1 (blue) in CA1 Str. Radiatum of a sham (A), a 2VO-vehicle (B), and a 2VO-dipyridamole (C) rat. (A) Confocal 3D rendering of triple immunostaining in CA1 Str. Radiatum of a sham rat obtained stacking 35 consecutive confocal z scans (0.3 μm each, total thickness 10.5 μm acquired at 5.4 μm depth into the slice). (B) Confocal 3D rendering of triple immunostaining in CA1 Str. Radiatum of a 2VO-vehicle rat obtained stacking 49 consecutive confocal z scans (0.3 μm each, total thickness 14.7 μm). (C) Confocal 3D rendering of triple immunostaining in CA1 Str. Radiatum of a 2VO-dypiridamole rat obtained stacking 30 consecutive confocal z scans (0.3 μm each, total thickness 9 μm acquired at 6.9 μm depth into the slice). Note the absence of a direct interplay among neurons, astrocytes and microglia in sham (A) and 2VO-dipyr (B). Scale bar in A–C: 15 μm. (D) Quantitative analysis of triads in CA1 Str. Radiatum of sham (n = 4), 2VO-vehicle (n = 5), and 2VO-dipyridamole (n = 4) rats (triads/mm2, mean ± s.e.m.; ***P < 0.01 vs. sham and 2VO-dipyr rats; One-Way ANOVA and Newman–Keuls Multiple Comparison Test).
Figure 9
Figure 9
Immunofluorescence of CytC and quantitative analysis of CytC positive neurons in CA1 Str. Pyramidale. (A–D) Confocal immunostaining of neurons (NeuN, red), Cyt C (green), and microglia (IBA1, blue) in CA1 Str. Pyramidale and Str. Radiatum. Panels (A–D) show a cell “sub-slice,” obtained stacking 2 confocal z scans (0.3 μm each, total thickness 0.6 μm acquired at 1.8 μm depth into the neuron). Scale bar: 15 μm. (D) Merge of the three above images showing the colocalization of CytC with NeuN in the cytoplasm of an ectopic neuron and the close proximity of a microglia cell projecting its branches to surround the neuron (open arrow). The asterisk in the pyramidal cell layer shows an empty spot possibly in correspondence to the place where the neuron was previously located. Scale bar: 8 μm. (E1–E3) Representative images showing CytC positive neurons in the pyramidal cell layer of the three experimental groups (arrows). Scale bar: 10 μm. (F) Quantitative analysis of CytC positive neurons in Str. Pyramidale of sham (white column, n = 10), 2VO-vehicle (black column, n = 12), and 2VO-dipyridamole (gray column, n = 10) rats (CytC positive neurons/mm2, mean ± s.e.m.; **P < 0.01 vs. sham; One-Way ANOVA and Newman–Keuls Multiple Comparison Test). Quantification was performed blind by two researchers in the region of interest (ROI) of CA1 Str. Pyramidale (represented in E1–E3) and results were averaged. ROIs were calculated in mm2 and the counts of CytC positive cells were expressed as neurons/mm2. (G1–G3) Representative images showing that ectopic neurons are CytC positive in the CA1 Str. Radiatum of the three experimental groups (arrows). Scale bar: 15 μm.

Similar articles

Cited by

References

    1. Aktas B., Utz A., Hoenig-Liedl P., Walter U., Geiger J. (2003). Dipyridamole enhances NO/cGMP-mediated vasodilator-stimulated phosphoprotein phosphorylation and signaling in human platelets—in vitro and in vivo/ex vivo studies. Stroke 34, 764–769. 10.1161/01.STR.0000056527.34434.59 - DOI - PubMed
    1. Al Bahrani A., Taha S., Shaath H., Bakhiet M. (2007). TNF-alpha and IL-8 in acute stroke and the modulation of these cytokines by antiplatelet agents. Curr. Neurovasc. Res. 4, 31–37. 10.2174/156720207779940716 - DOI - PubMed
    1. Allen N. J., Barres B. A. (2009). Neuroscience: Glia—more than just brain glue. Nature 457, 675–677. 10.1038/457675a - DOI - PubMed
    1. Barres B. A. (2008). The mystery and magic of glia: a perspective on their roles in health and disease. Neuron 60, 430–440. 10.1016/j.neuron.2008.10.013 - DOI - PubMed
    1. Barreto G. E., Gonzalez J., Torres Y., Morales L. (2011). Astrocytic-neuronal crosstalk: implications for neuroprotection from brain injury. Neurosci. Res. 71, 107–113. 10.1016/j.neures.2011.06.004 - DOI - PubMed

LinkOut - more resources