

Defining Boundaries for Ecosystem-Based Management: A Multispecies Case Study of Marine Connectivity across the Hawaiian Archipelago
- PMID: 25505913
- PMCID: PMC4260462
- DOI: 10.1155/2011/460173
Defining Boundaries for Ecosystem-Based Management: A Multispecies Case Study of Marine Connectivity across the Hawaiian Archipelago
Abstract
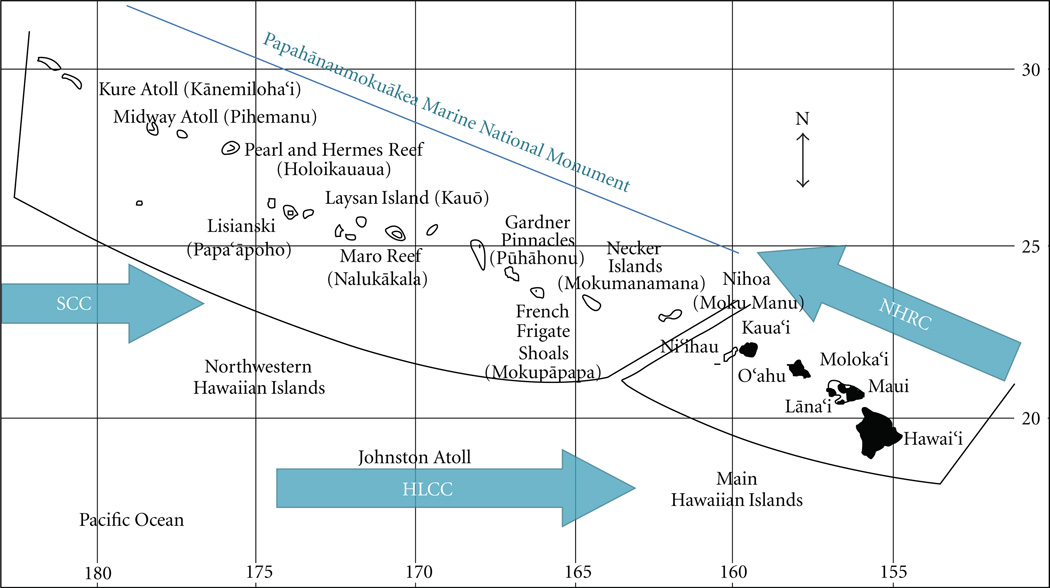
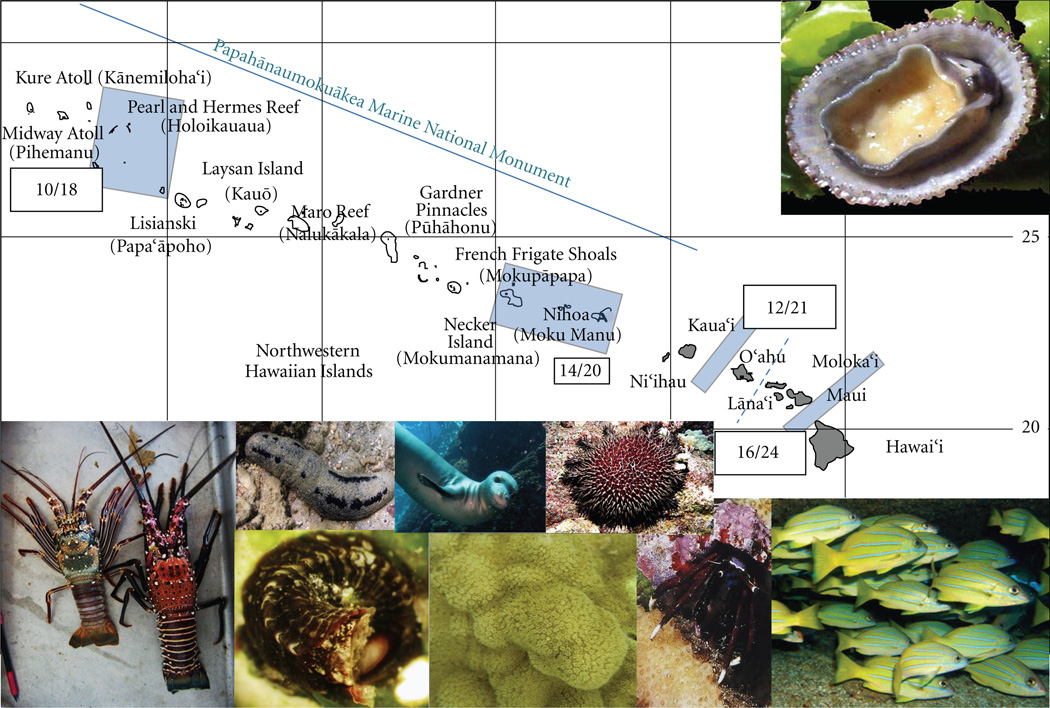
Determining the geographic scale at which to apply ecosystem-based management (EBM) has proven to be an obstacle for many marine conservation programs. Generalizations based on geographic proximity, taxonomy, or life history characteristics provide little predictive power in determining overall patterns of connectivity, and therefore offer little in terms of delineating boundaries for marine spatial management areas. Here, we provide a case study of 27 taxonomically and ecologically diverse species (including reef fishes, marine mammals, gastropods, echinoderms, cnidarians, crustaceans, and an elasmobranch) that reveal four concordant barriers to dispersal within the Hawaiian Archipelago which are not detected in single-species exemplar studies. We contend that this multispecies approach to determine concordant patterns of connectivity is an objective and logical way in which to define the minimum number of management units and that EBM in the Hawaiian Archipelago requires at least five spatially managed regions.
Figures
References
-
- Pauly D, Christensen V, Dalsgaard J, Froese R, Torres F. Fishing down marine food webs. Science. 1998;279(5352):860–863. - PubMed
-
- Pauly D, Watson R. Counting the last fish. Scientific American. 2003;289(1):42–47. - PubMed
-
- Worm B, Barbier EB, Beaumont N, et al. Impacts of biodiversity loss on ocean ecosystem services. Science. 2006;314(5800):787–790. - PubMed
-
- McLeod KL, Leslie HM. Why ecosystem-based management? In: McLeod KL, Leslie HM, editors. Ecosystem-Based Management for the Oceans. Washington, DC, USA: Island Press; 2009.
-
- Spalding MD, Fox HE, Allen GR, et al. Marine ecoregions of the world: a bioregionalization of coastal and shelf areas. BioScience. 2007;57(7):573–583.
Grants and funding
LinkOut - more resources
Full Text Sources
Miscellaneous