. 2014 Nov 20;6(11):100.
doi: 10.1186/s13073-014-0100-8. eCollection 2014.

YMAP: a pipeline for visualization of copy number variation and loss of heterozygosity in eukaryotic pathogens

Affiliations

YMAP: a pipeline for visualization of copy number variation and loss of heterozygosity in eukaryotic pathogens

Darren A Abbey et al. Genome Med. .

Abstract

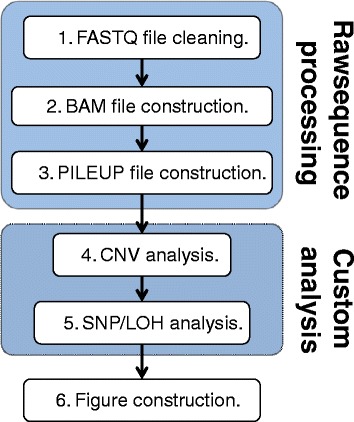
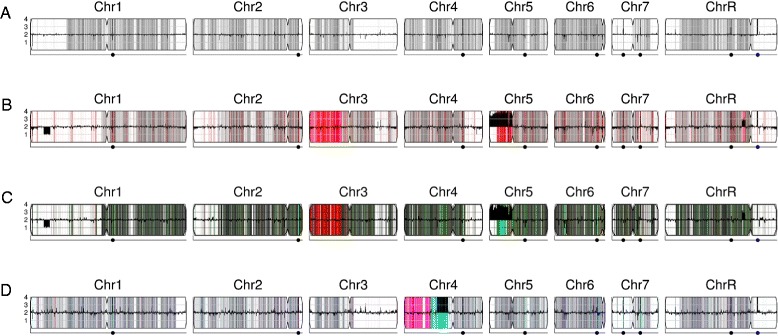
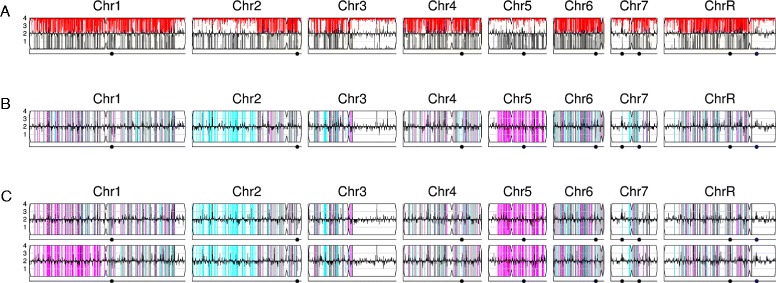
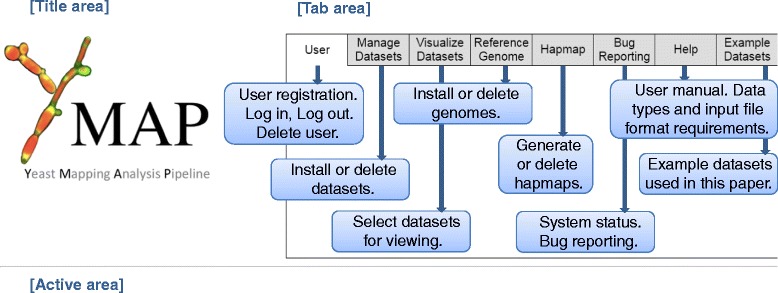
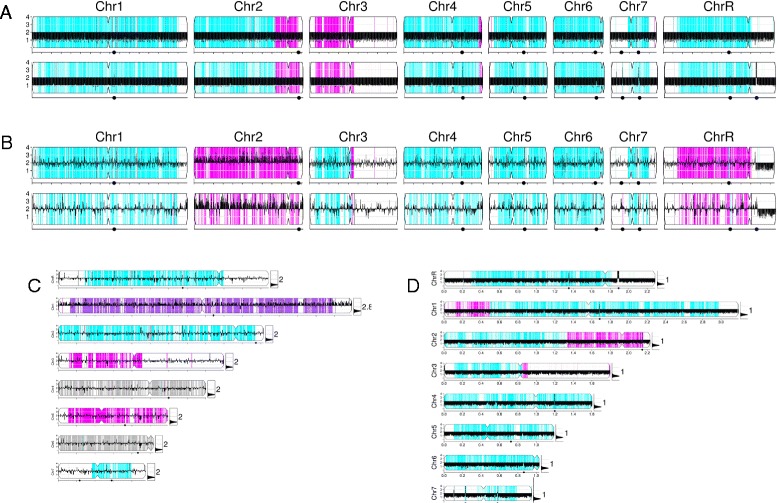
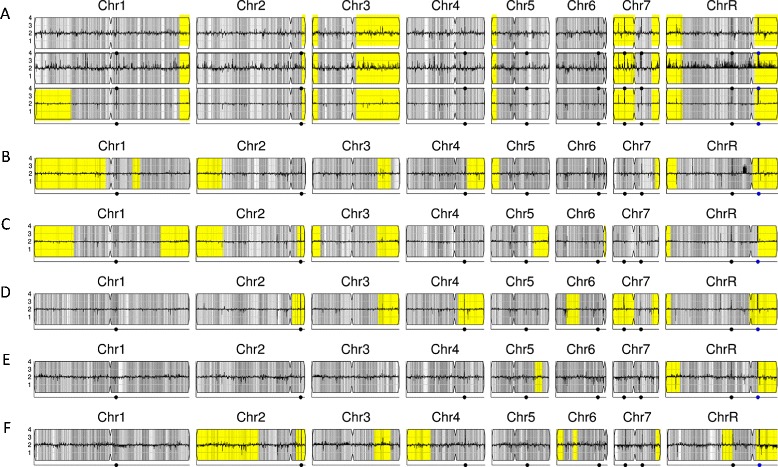
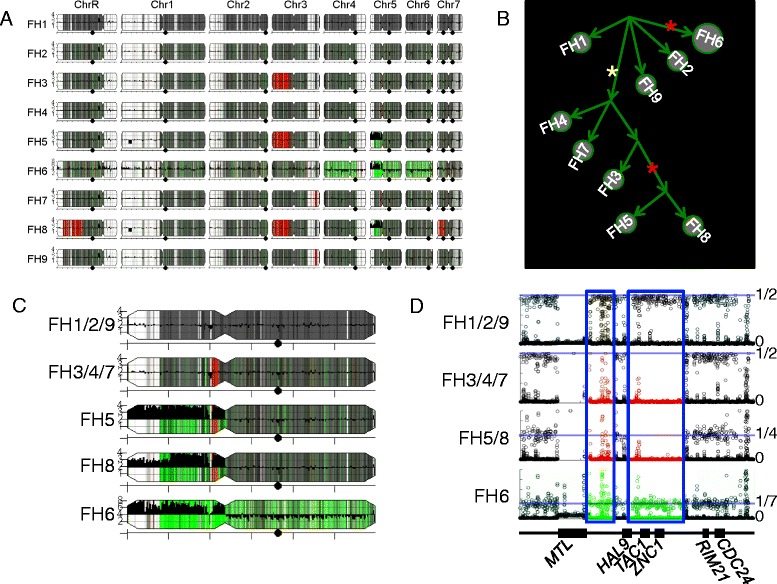
The design of effective antimicrobial therapies for serious eukaryotic pathogens requires a clear understanding of their highly variable genomes. To facilitate analysis of copy number variations, single nucleotide polymorphisms and loss of heterozygosity events in these pathogens, we developed a pipeline for analyzing diverse genome-scale datasets from microarray, deep sequencing, and restriction site associated DNA sequence experiments for clinical and laboratory strains of Candida albicans, the most prevalent human fungal pathogen. The YMAP pipeline (http://lovelace.cs.umn.edu/Ymap/) automatically illustrates genome-wide information in a single intuitive figure and is readily modified for the analysis of other pathogens with small genomes.


Figures

Figure 1
Figure 1
Conceptual overview of Y MAP genome analysis pipeline. The central computation engine of the pipeline has three major components: raw sequence processing, custom analysis, and figure construction/presentation.
Figure 2
Figure 2
Normalization of chromosome-end bias. (A, B) Black bars up- and down-wards from the figure midline represent local copy number estimates, scaled to genome ploidy. Different levels of grey shading in the background indicate local changes in SNP density, with darker grey indicating more SNPs. Detailed interpretations are similar to those described in [25]. (A) Map of data with chromosome end bias present in read-depth CNV estimates for strain YQ2 dataset (from EMBL-EBI BioSamples database [34], accession SAMEA1879786). (B) Corrected CNV estimates for strain YQ2 mapped across all C. albicans chromosomes. (C, D) Raw and corrected normalized read-depth CNV estimates relative to distance from chromosome ends. Red, LOWESS fit curve.
Figure 3
Figure 3
Normalization of GC-content bias. (A) GC-content bias present in read-depth CNV estimates using WGseq for strain FH6. (B) Corrected CNV estimates mapped across FH6 genome. (C,D) Raw and corrected normalized read-depth CNV estimates versus GC content. Red, LOWESS fit curve. Chromosome illustrations are as in Figure 2.
Figure 4
Figure 4
Normalization of fragment-length-bias in ddRADseq data. (A) High noise of raw read-depth CNV estimates in CHY477 [35] ddRADseq data with GC-content, fragment-length, and position-effect biases. (B) CNV estimates mapped across the genome and corrected for GC bias, fragment length bias and normalized to the reference data. (C) Average read-depth CNV estimates versus predicted restriction fragment length for strain RBY917 Mata/a -his, -leu, delta gal1::SAT1/GAL1 derived from SNY87 [36]. Black, LOWESS fit curve. (D) Corrected average read-depth CNV estimates versus fragment length, with regions of low reliability data in red, as described in more detail in the text. Chromosome illustrations are as in Figure 2.
Figure 5
Figure 5
Presentation styles for WGseq data. (A) Heterozygous reference strain SC5314 (NCBI Sequence Read Archive (SRA) [39], accession SRR868699) showing SNP density, number of SNPs per 5 kb region illustrated in degree of darkness in grey bars; centromere loci are illustrated as an indentation in the chromosome cartoon. (B) Clinical isolate FH5 showing changes in allelic ratio in red and CNV changes including i(5L) in black - all determined relative to the parental strain FH1 (NCBI SRA [40], accession SAMN03144961). (C) Strain FH5 relative to strain FH1 (as in (B)), with complete LOH in red and allelic ratio changes (for example, 3:1 on Chr5L) in green. (D) SC5314-derived lab isolate YJB12746 showing segmental LOH (of both homologs ‘a’ (cyan) and ‘b’ (magenta)) in addition to a segmental aneuploidy on chromosome 4. Chromosome illustrations are as in Figure 2.
Figure 6
Figure 6
Presentation styles for ddRADseq data. (A,B) Allelic ratios drawn as grey lines from top and bottom edges. (A) Allelic ratios for YJB12712 derivative 2 (top, red) compared with reference SC5314 (bottom, grey). Regions that are predominantly white in both samples were homozygous in the parent strain. (B) Data from YJB12712 derivative 2 illustrated without the reference control and using the hapmap color scheme: white regions were homozygous in the reference strain, cyan is homolog ‘a’, and magenta is homolog ‘b’. (C) Two additional isolates (YJB12712 derivative 1 and YJB12712 derivative 9) from the same experiment illustrating different degrees of LOH on the left arm of Chr1. Chromosome illustrations are as in Figure 2.
Figure 7
Figure 7
Outline of user interface to pipeline. Functions are accessed through the tabbed upper-right portion of the interface. Resulting figures are displayed in the lower portion of the interface.
Figure 8
Figure 8
Analysis of strains derived from C. albicans lab reference strain SC5314. (A) Comparison of SNP/CGH array (top row) to WGseq (bottom row) for YJB10490, a haploid C. albicans derivative of SC5314 [41]. (B) Comparison of SNP/CGH-array (top row) to ddRADseq (bottom row) for auto-diploid C. albicans strain YJB12229 [41]. (C) A SNP/CGH array dataset for near-diploid isolate Ss2 [43], showing LOHs and a trisomy of Chr1. (D) WGseq dataset for haploid YJB12353 [41], showing whole-genome LOH.
Figure 9
Figure 9
LOH patterns differ in different C. albicans clinical isolates. (A) Three isolates of C. albicans reference strain C5314 from different sources (EMBL EBI BioSamples [34], accession SAMN02141741; in-house; NCBI SRA, accession SAMN02140351), showing variations. (B) FH1. (C) ATCC200955 (NCBI SRA [39], accession SAMN02140345). (D) ATCC10231 (NCBI SRA [39], accession SAMN02140347). (E) YL1 (EMBL EBI BioSamples [34], accession SAMEA1879767). (F) YQ2 (EMBL EBI BioSamples [34], accession SAMEA1879786). Grey, heterozygous regions as in previous figures; yellow, regions of contiguous LOH highlighted.
Figure 10
Figure 10
Comparison of a series of clinical isolates. (A) Genome maps for the FH series of clinical isolates from an individual patient all compared with the initial isolate (FH1) as in Figure 5C. White, regions homozygous in all isolates; red, regions with recently acquired LOH; green, regions with unusual (neither 1:1 or 1:0) allelic ratios. (B) Dendrogram illustrating relationships in FH-series lineage. Yellow star indicates an early TAC1 LOH event. Red stars indicate independent i(5L) formation events. (C) Close-up of Chr5L showing region that underwent LOH event in isolates FH3/4/5/7/8, but not in isolate FH6, using the same color scheme as in (A). (D) Allelic ratios surrounding region of Chr5L with LOH (0 = homozygous; 1/2 = heterozygous). Red highlights region of LOH in FH3/4/7/5/8. Horizontal light blue lines indicate expected allelic ratios (top to bottom: 1/2, 1/2, 1/4, and 1/7). Dark blue boxes enclose regions with LOH in FH3/4/5/7/8. Allelic ratio data in the boxes is colored consistent with other subfigures. Mating type locus (MTL) is only found in one copy in assembly 21 of the reference genome. The missing data in the MTL region of FH3/4/5/7/8 indicates these strains are homozygous for the MTL-alpha homolog (not present in the reference genome), while FH1/2/6/9 contain both homologs.

References

    1. Selmecki A, Forche A, Berman J. Aneuploidy and isochromosome formation in drug-resistant Candida albicans. Science. 2006;313:367–370. doi: 10.1126/science.1128242. - DOI - PMC - PubMed
    1. Selmecki A, Gerami-Nejad M, Paulson C, Forche A, Berman J. An isochromosome confers drug resistance in vivo by amplification of two genes, ERG11 and TAC1. Mol Microbiol. 2008;68:624–641. doi: 10.1111/j.1365-2958.2008.06176.x. - DOI - PubMed
    1. Kobayashi T, Heck DJ, Nomura M, Horiuchi T. Expansion and contraction of ribosomal DNA repeats in Saccharomyces cerevisiae: requirement of replication fork blocking (Fob1) protein and the role of RNA polymerase I. Genes Dev. 1998;12:3821–3830. doi: 10.1101/gad.12.24.3821. - DOI - PMC - PubMed
    1. Ketel C, Wang HSW, McClellan M, Bouchonville K, Selmecki A, Lahav T, Gerami-Nejad M, Berman J. Neocentromeres form efficiently at multiple possible loci in Candida albicans. PLoS Genet. 2009;5:e1000400. doi: 10.1371/journal.pgen.1000400. - DOI - PMC - PubMed
    1. Baum M, Sanyal K, Mishra PK, Thaler N, Carbon J. Formation of functional centromeric chromatin is specified epigenetically in Candida albicans. Proc Natl Acad Sci U S A. 2006;103:14877–14882. doi: 10.1073/pnas.0606958103. - DOI - PMC - PubMed

LinkOut - more resources