Evaluation of neonatal streptozotocin induced diabetic rat model for the development of cataract
- PMID: 25505935
- PMCID: PMC4253707
- DOI: 10.1155/2014/463264
Evaluation of neonatal streptozotocin induced diabetic rat model for the development of cataract
Abstract
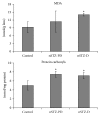
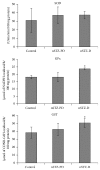
Type 2 diabetes (T2D) generally follows prediabetes (PD) conditions such as impaired fasting glucose (IFG) and/or impaired glucose tolerance (IGT). Although studies reported an association of IGT or IFG with cataract, the experimental basis for PD associated cataract is not known. Hence, we evaluated neonatal streptozotocin (nSTZ) induced rat model to study PD associated cataractogenesis by injecting STZ to two-day old rats. While majority (70%) of nSTZ injected pups developed IGT (nSTZ-PD) by two months but not cataract even after seven months, remaining (30%) nSTZ rats developed hyperglycemia (nSTZ-D) by two months and mature cataract by seven months. Lens biochemical analysis indicated increased oxidative stress as indicated by increased SOD activity, lipid peroxidation, and protein carbonyl levels in nSTZ-D cataractous lens. There was also increased polyol pathway as assessed by aldose reductase activity and sorbitol levels. Though nSTZ-PD animals have not shown any signs of lenticular opacity, insolubilization of proteins along with enhanced polyol pathway was observed in the lens. Further there was increased oxidative stress in lens of IGT animals. These results suggest that oxidative stress along with increased polyol pathway might play a role in IGT-associated lens abnormalities. In conclusion, nSTZ-PD rat model could aid to investigate IGT-associated lens abnormalities.
Figures


Similar articles
-
Insulin resistance mediated biochemical alterations in eye lens of neonatal streptozotocin-induced diabetic rat.Indian J Exp Biol. 2011 Oct;49(10):749-55. Indian J Exp Biol. 2011. PMID: 22013741
-
Elevated Expression of indoleamine 2,3-dioxygenase (IDO) and accumulation of kynurenic acid in the pathogenesis of STZ-induced diabetic cataract in Wistar rats.Curr Eye Res. 2009 Apr;34(4):274-81. doi: 10.1080/02713680902725954. Curr Eye Res. 2009. PMID: 19373575
-
Inhibition of aldose reductase by Aegle marmelos and its protective role in diabetic cataract.J Ethnopharmacol. 2013 Aug 26;149(1):215-21. doi: 10.1016/j.jep.2013.06.025. Epub 2013 Jul 1. J Ethnopharmacol. 2013. PMID: 23827758
-
[The oxidative stress in the cataract formation].Nippon Ganka Gakkai Zasshi. 1995 Dec;99(12):1303-41. Nippon Ganka Gakkai Zasshi. 1995. PMID: 8571853 Review. Japanese.
-
The Synergistic Effects of Polyol Pathway-Induced Oxidative and Osmotic Stress in the Aetiology of Diabetic Cataracts.Int J Mol Sci. 2024 Aug 20;25(16):9042. doi: 10.3390/ijms25169042. Int J Mol Sci. 2024. PMID: 39201727 Free PMC article. Review.
Cited by
-
Quantification of Photoreceptors' Changes in a Diabetic Retinopathy Model with Two-Photon Imaging Microscopy.Int J Mol Sci. 2024 Aug 11;25(16):8756. doi: 10.3390/ijms25168756. Int J Mol Sci. 2024. PMID: 39201444 Free PMC article.
-
Glutamate is effective in decreasing opacity formed in galactose-induced cataract model.Sci Rep. 2024 Feb 19;14(1):4123. doi: 10.1038/s41598-024-54559-y. Sci Rep. 2024. PMID: 38374148 Free PMC article.
-
Combined Administration of Streptozotocin and Sucrose Accelerates the Appearance of Type 2 Diabetes Symptoms in Rats.J Diabetes Res. 2019 Jul 4;2019:3791061. doi: 10.1155/2019/3791061. eCollection 2019. J Diabetes Res. 2019. PMID: 31355292 Free PMC article.
-
Liver mitochondrial membrane fluidity at early development of diabetes and its correlation with the respiration.J Bioenerg Biomembr. 2017 Jun;49(3):231-239. doi: 10.1007/s10863-017-9700-5. Epub 2017 Mar 24. J Bioenerg Biomembr. 2017. PMID: 28337566
-
The Metabolic Responses to L-Glutamine of Livers from Rats with Diabetes Types 1 and 2.PLoS One. 2016 Aug 4;11(8):e0160067. doi: 10.1371/journal.pone.0160067. eCollection 2016. PLoS One. 2016. PMID: 27490892 Free PMC article.
References
-
- IDF Diabetes Atlas. 6th. International Diabetes Federation; 2013.
-
- Quoc P. S., Charles M. A., Cuong N. H., et al. Blood glucose distribution and prevalence of diabetes in Hanoi (Vietnam) American Journal of Epidemiology. 1994;139(7):713–722. - PubMed
Publication types
MeSH terms
LinkOut - more resources
Full Text Sources
Other Literature Sources
Medical

