Protective effects of aqueous extract of Solanum nigrum Linn. leaves in rat models of oral mucositis
- PMID: 25506066
- PMCID: PMC4258331
- DOI: 10.1155/2014/345939
Protective effects of aqueous extract of Solanum nigrum Linn. leaves in rat models of oral mucositis
Abstract
Oral mucositis is one of the most debilitating side effects in patient undergoing chemotherapy or chemoradiotherapy. Leaves of the plant Solanum nigrum are used in folklore medicine to treat oral ulcers in India. However, no pharmacological investigation has been carried out till date. Aqueous extract of Solanum nigrum leaves (AESN) was prepared and subjected to various phytochemical screening. HPLC analysis of the ethyl acetate fraction was carried out. The aqueous extract (100 and 200 mg/kg) was further evaluated for its protective effect on two rat models: (a) busulfan plus infrared radiation (chemoradiotherapy) induced oral mucositis and (b) methotrexate (chemotherapy) induced oral mucositis. Various parameters including body weight change, food intake, and mortality were measured. AESN showed protective effect in both models of oral mucositis; however, the higher dose was more effective in chemotherapy induced oral mucositis. A reduction in oral mucositis score (P < 0.05) was observed in the treatment groups. Significant (P < 0.05) improvement in food intake was also observed in AESN treated groups. Aqueous extract of Solanum nigrum leaves has protective effect on chemotherapy and chemoradiotherapy induced oral mucositis in rats.
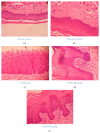
Figures


Similar articles
-
Anti-seizure activity of the aqueous leaf extract of Solanum nigrum linn (solanaceae) in experimental animals.Afr Health Sci. 2008 Jun;8(2):74-9. Afr Health Sci. 2008. PMID: 19357754 Free PMC article.
-
Solanum nigrum Toxicity and Its Neuroprotective Effect Against Retinal Ganglion Cell Death Through Modulation of Extracellular Matrix in a Glaucoma Rat Model.J Ocul Pharmacol Ther. 2024 Jun;40(5):309-324. doi: 10.1089/jop.2023.0089. Epub 2024 Apr 11. J Ocul Pharmacol Ther. 2024. PMID: 38603587
-
Antinociceptive, anti-inflammatory and antipyretic effects of Solanum nigrum aqueous extract in animal models.Methods Find Exp Clin Pharmacol. 2009 Mar;31(2):81-8. doi: 10.1358/mf.2009.31.2.1353876. Methods Find Exp Clin Pharmacol. 2009. PMID: 19455262
-
Potential Therapeutic Effects of Gut Hormones, Ghrelin and Obestatin in Oral Mucositis.Int J Mol Sci. 2019 Mar 27;20(7):1534. doi: 10.3390/ijms20071534. Int J Mol Sci. 2019. PMID: 30934722 Free PMC article. Review.
-
An Evidence-Based Research on Botanical Sources for Oral Mucositis Treatment in Traditional Persian Medicine.Curr Drug Discov Technol. 2021;18(2):225-234. doi: 10.2174/1570163817666200203110803. Curr Drug Discov Technol. 2021. PMID: 32013832 Review.
Cited by
-
A Phase II Randomized Clinical Trial and Mechanistic Studies Using Improved Probiotics to Prevent Oral Mucositis Induced by Concurrent Radiotherapy and Chemotherapy in Nasopharyngeal Carcinoma.Front Immunol. 2021 Mar 24;12:618150. doi: 10.3389/fimmu.2021.618150. eCollection 2021. Front Immunol. 2021. PMID: 33841399 Free PMC article. Clinical Trial.
-
Anticancer L-Asparaginase and Phytoactive Compounds From Plant Solanum nigrum Against MDR (Methicillindrug resistant) Staphylococcus aureus and Fungal Isolates.Dose Response. 2022 Apr 27;20(2):15593258221092379. doi: 10.1177/15593258221092379. eCollection 2022 Apr-Jun. Dose Response. 2022. PMID: 35558870 Free PMC article.
-
Bioactive Constituents and Toxicological Evaluation of Selected Antidiabetic Medicinal Plants of Saudi Arabia.Evid Based Complement Alternat Med. 2022 Jan 17;2022:7123521. doi: 10.1155/2022/7123521. eCollection 2022. Evid Based Complement Alternat Med. 2022. PMID: 35082904 Free PMC article. Review.
-
Antioxidant Activities of Solanum Nigrum L. Leaf Extracts Determined in in vitro Cellular Models.Foods. 2019 Feb 8;8(2):63. doi: 10.3390/foods8020063. Foods. 2019. PMID: 30744041 Free PMC article.
-
Polyherbal Medicine Divya Sarva-Kalp-Kwath Ameliorates Persistent Carbon Tetrachloride Induced Biochemical and Pathological Liver Impairments in Wistar Rats and in HepG2 Cells.Front Pharmacol. 2020 Mar 25;11:288. doi: 10.3389/fphar.2020.00288. eCollection 2020. Front Pharmacol. 2020. PMID: 32269524 Free PMC article.
References
Publication types
MeSH terms
Substances
LinkOut - more resources
Full Text Sources
Other Literature Sources

